Articles
Probability Ellipse for Tropical Cyclone Track Forecasts with Multiple Ensembles
2020 Volume 98 Issue 4 Pages 821-833

Details
2020 Volume 98 Issue 4 Pages 821-833
The effectiveness of the probability ellipse for tropical cyclone (TC) track forecasts is investigated with multiple ensembles from the Japan Meteorological Agency (JMA), the European Centre for Medium-Range Weather Forecasts (ECMWF), the U.S. National Centers for Environmental Prediction (NCEP), and the Met Office in the United Kingdom (UKMO). All TCs during the 3 years from 2016 to 2018 are included in the verification. We show that the multiple ensembles composed of these four global ensembles are capable of predicting the situation-dependent uncertainties of TC track forecasts appropriately in both the along-track (AT) and cross-track (CT) directions. The use of a probability circle involves the implicit assumption of an isotropic error distribution, whereas the introduction of the probability ellipse makes it possible to provide information as to which is more uncertain; the direction or speed of TC movement. Compared to the probability circle adopted operationally at JMA, the probability ellipse can potentially reduce the area by 16, 15, and 24 %, on average, at forecast times (FT) of 3, 4, and 5 days, respectively, indicating that narrowing warning areas of TC track forecasts by the probability ellipse enables us to enhance disaster prevention/mitigation measures.
In recent decades, tropical cyclone (TC) track forecasting techniques have been developed, and TC track forecast accuracy has been significantly improved (Heming and Goerss 2010; Heming et al. 2019), owing to a better understanding of TC dynamics (Ito et al. 2019) and improvements in numerical weather predictions (Yamaguchi et al. 2017; Magnusson et al. 2019). Previous studies have shown the value of dynamical ensemble forecasts to estimate the uncertainties associated with TC track forecasts (Yoden 2007; Yamaguchi et al. 2009, 2012; Majumdar and Finocchio 2010; Dupont et al. 2011; Leornardo and Colle 2017; Titley et al. 2020), but progress in the treatment of forecast uncertainty associated with TC tracks has been slow. Despite the adoption of probability circles or cones by weather centers to represent TC track forecast uncertainties (Elliott and Yamaguchi 2014), many operational TC forecasting centers still don't use ensemble-based forecast uncertainty information in their operational TC warnings (Titley et al. 2019).
The Japan Meteorological Agency (JMA), which issues track forecasts for TCs in the western North Pacific as the Regional Specialized Meteorological Center (RSMC) (Regional Specialized Meteorological Center Tokyo – Typhoon Center 1989), has adopted probability circles to represent track uncertainty. A probability circle is defined as the domain that the center of a TC is expected to exist within at a given forecast time (FT). This probability was changed from 60 % to 70 % with improvement in TC track forecasts in 1997, and JMA started to provide information of three-day TC track forecasts (Regional Specialized Meteorological Center Tokyo – Typhoon Center 1997; Nagata et al. 1998). The radius of the probability circle at a given FT were calculated from the statistical relationship between forecast errors and TC movement (speed and direction) at the FT in data from the past several years (Mannoji 2005). In 2009, with the implementation of the JMA Typhoon Ensemble Prediction System (TEPS) (Yamaguchi et al. 2009), JMA began to issue five-day TC track forecasts (Kishimoto 2010). Radii of probability circles for the 3- to 72-h forecasts were conventionally determined in the same way as previously with the statistical relationship between forecast errors and TC movement, whereas those for the 96- to 120-h forecasts were determined according to confidence levels based on the cumulative ensemble spread calculated by the TEPS (Yamaguchi et al. 2009; Narita 2015). However, the differing methods used to determine probability circle radii between the 3- to 72-h and 96- to 120-h forecasts resulted in discontinuities in the rate of increase of the radius. To address this issue, JMA has explored a new method of determining radii uniformly for forecast lead times of up to 5 days that uses multiple ensembles, from JMA, the European Centre for Medium-Range Weather Forecasts (ECMWF), the U.S. National Centers for Environmental Prediction (NCEP), and the Met Office in the United Kingdom (UKMO) (Fukuda and Yamaguchi 2019). Fukuda and Yamaguchi (2019) found a stronger relationship between TC position errors and ensemble spreads for multiple ensembles than for a single ensemble and showed that the multiple-ensemble method provided the most appropriate probability circles with the highest correlation between radii of the circle and TC track forecast errors among the statistical, single, and multiple-ensemble methods. Therefore, in 2019, JMA implemented probability circles with a 70 % probability radius obtained by the multiple-ensemble technique for operational TC track forecasts.
Fukuda and Yamaguchi (2019) also found, however, that the mean probability circle radius and, therefore, the mean area differed little, whether determined by the conventional statistical, single-ensemble, or multiple-ensemble method, indicating that the multiple-ensemble method does not produce a significant reduction in probability circle area compared with the statistical and single-ensemble methods. The use of a probability circle involves the implicit assumption of an isotropic error distribution, whereas the introduction of the probability ellipse would make it possible to provide information as to which is more uncertain; the direction or speed of TC movement.
TC track forecasts of ensemble members do not always exhibit isotropic scatter. Hamill et al. (2011) verified ensemble forecasts from different global ensemble prediction systems (EPSs) initialized with an ensemble Kalman filter and reported that the ensemble forecasts were often stretched in particular directions. Bivariate normal ellipses were fit to the ensembles, and forecast errors were larger in magnitude along the primary eigenvector of the fitted forecast ellipses and smaller along the secondary eigenvectors. They showed that the most skillful EPSs exhibited some consistency between the magnitude of the projection of mean error onto the eigenvectors and of member deviations from the mean position. Zhang and Yu (2017) evaluated the forecast uncertainty information of two operational EPSs, one from ECMWF (ECMWFEPS) and the other from NCEP (NCEP-EPS), and their grand ensemble (EPS-CON). They reported that for ECMWF-EPS and EPS-CON, the hit ratio, defined as the proportion of TCs falling into the 70 % probability ellipse, was greater than the 80 % at all FT up to 120 h. The EPS-CON hit ratio was highest because EPS-CON ellipses were larger due to the overdispersiveness of the consensus forecasts by ECMWF-EPS and NCEP-EPS. The warning area based on such overdispersive ensembles is overestimated, which is not useful for the end users of the products. Considering this increase in ellipse size, Zhang and Yu (2017) showed that the uncertainty information from ECMWF-EPS was representative and adopted the ECMWF-EPS probability ellipse in their proposed TC track forecast scheme. Their study thus revealed that a more representative probability ellipse could potentially indicate the effective uncertainty of TC track forecasts. However, how the probability ellipse differs from the probability circle, cone, or error swath, which has been widely adopted by many weather centers such as RSMC Tokyo, RSMC Miami, and Joint Typhoon Warning Center (Titley et al. 2019), has not yet been investigated. Thus, quantitative assessment of the benefits of the probability ellipse relative to those of the probability circle is of great importance. Although ensemble predictions seem to have the potential to represent the uncertainties associated with TC track forecasts in an elliptical shape, our understanding of the relative benefits of an approach using the probability ellipse compared with the conventional approach is limited.
In this study, using four ensembles from JMA, ECMWF, NCEP, and UKMO, we investigate how much the forecast area of the probability ellipse decreases with multiple ensembles and evaluate the effectiveness of the ellipse compared with that of the circle for TC track forecasts under the same 70 % detection rate. Reducing the forecast area and showing the situation-dependent forecast uncertainty by the probability ellipse lead to narrow warning areas where TCs are expected to come and contribute to further disaster prevention/mitigation. Section 2 describes the data specifications and the probability circle and ellipse methods for representing TC track predictions. Section 3 describes the characteristics of TC forecast errors and ensemble spreads decomposed into the along-track (AT) and cross-track (CT) directions and presents the results of the comparison between the circle and the ellipse. Section 4 discusses seasonality and other properties of the multiple-ensemble results. Section 5 is a summary.
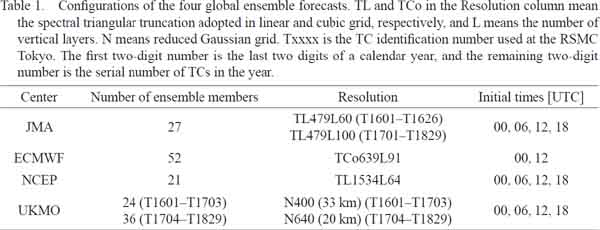
To investigate the effectiveness of the probability ellipse for TC track forecasts, TC tracking data of the Japan Meteorological Agency Ensemble Prediction System (Japan Meteorological Agency 2019), the European Centre for Medium-Range Weather Forecasts Ensemble (Palmer 2019), the National Centers for Environmental Prediction Global Ensemble Forecast system (Toth and Kalnay 1997), and the Met Office Global and Regional Ensemble Prediction System (Bowler et al. 2008) are used. These data are created at each weather center. The data from ECMWF, NCEP, and UKMO are provided to JMA for operational use. Table 1 shows the configurations of these ensembles. The maximum size of the four-center multiple ensemble is 124 for Typhoon Nanmadol (the third typhoon for named TCs in 2017; hereafter, T1703) and before, and 136 for Typhoon Talas (the fourth typhoon in 2017; hereafter, T1704) and after. The initial times of the ensembles used in this study are 00 and 12 UTC to adjust the initial times of ECMWF. JMA's official TC track forecast data also are used to investigate the position error characteristics at initial times of 00, 06, 12, and 18 UTC. JMA's best-track data are used to calculate the position errors of TC track forecasts.
The TC track forecasts are verified at FT of 24, 48, 72, 96, and 120 h. The data period is from 2016 to 2018, and TCs from T1601 to T1829 are included in the verification (i.e., all TCs during the 3-year period). Verification is performed when TC intensity is tropical storm or stronger (i.e., when the 10-min average of the maximum sustained wind speed is 34 knots or more at both the initial and verification times), and when the number of ensemble members tracking the TC is 50 or more at the verification time.
2.3 Forecast methodProbability circle and ellipse areas are compared. A probability circle (ellipse) is defined as a circle (ellipse) that includes 70 % of the ensemble members around the ensemble mean central location. The maximum radius of the probability circle is calculated at the limit of 2000 km. There are three parameters to determine the probability ellipse: the long and short axes and the rotation angle. By changing the long and short axes every 20 km and the rotation angle every 10 degrees, the three parameters that provided the smallest area while keeping the above condition (70 % of ensemble members around the ensemble mean location are included in the ellipse) are adopted at each forecast case.
2.4 Verification methodThe ensemble spread is the standard deviation of the distances between the TC central positions of the individual ensemble members and the ensemble mean position. As this study investigates the probability ellipse, the ensemble spread is defined in both the AT and CT directions. The AT direction is defined at a given forecast time T as the vector difference in the ensemble mean forecast of the TC position between T and T – 24 h (Yamaguchi et al. 2009), whereas the CT direction is set as the direction orthogonal to the AT direction. The ensemble spread in the AT (CT) direction at forecast time T is calculated as follows. First, the vector difference between the ensemble mean and each ensemble member location at T is projected onto the AT (CT) direction. Second, the magnitude of the vector difference in the AT (CT) direction is calculated for all ensemble members. Then, the standard deviation of the magnitudes of the vector differences in the AT (CT) direction is defined as the ensemble spread in the AT (CT) direction.
The position errors in the JMA's official TC track forecasts and the ensemble mean TC track predictions of the multiple ensemble are also decomposed into the AT and CT directions. The AT direction is defined at a given forecast time T as the vector difference in the forecast TC central location between T and T – 24 h, and the CT direction is set to the direction orthogonal to the AT direction. The decomposition of position error into AT and CT components is schematically illustrated in Fig. 1.
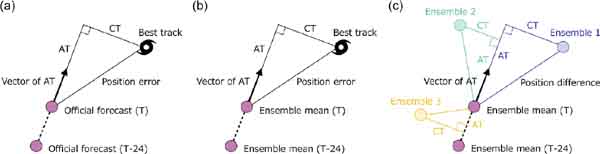
Schematic illustration of the decomposition of the TC position error/difference into its along-track (AT) and cross-track (CT) components. The AT direction is defined as the vector difference between forecasts at a given forecast time T and at T – 24 h. (a) The TC position error in the JMA's official TC track forecast. (b) The TC position error of the ensemble mean TC track prediction for a multiple ensemble. (c) Calculation of the ensemble spread of the multiple ensemble as an example of the three members.
Figure 2 shows the position error of the JMA's official track forecasts and its AT and CT components as a function of FT up to 5 days during the 3-year verification period. Errors in the AT direction are larger than those in the CT direction at all FT (Fig. 2), which differ by 7, 12, 20, 23, and 20 km at 24, 48, 72, 96, and 120 h. Although the use of probability circles involves the implicit assumption that position errors are isotropic, this result shows that, contrary to this assumption, errors are likely to be larger on average in the AT direction than in the CT direction.
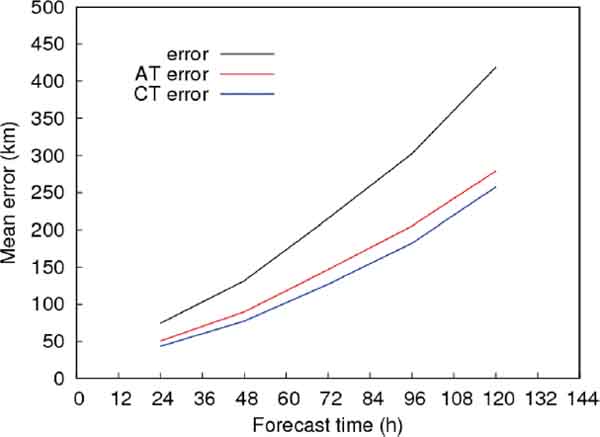
Mean position errors (km) of the JMA's official TC track forecasts as a function of forecast time (h). The mean error (black line) is decomposed into the error in the AT direction (red line) and that in the CT direction (blue line). The verification period is the 3-year period from 2016 to 2018.
Figure 3 shows scatter plots of errors in the AT and CT directions at FT of 48, 72, and 96 h in 10° latitude bands (LAT) from 10° to 40°N. Although, at the short FT and in the low latitude band, the error distribution is nearly isotropic (e.g., FT048, LAT20–30°N), at longer FT and in the higher latitude bands, the distribution is elongated in the AT direction. For example, errors in the AT direction are much larger on average than those in the CT direction in verifications conducted at the FT of 72 and 96 h in the 30–40°N latitude band (Figs. 3f, i). These results indicate that, in the midlatitudes, errors are likely to be larger on average in the AT direction than in the CT direction. Many TCs move into the midlatitude and are affected by the synoptic features (Swinbank et al. 2016; Ito et al. 2019). The TC motion can increase under extratropical transition, which is the complex evolutionary process with interactions between TCs and the midlatitude environment, making TC prediction difficult (Jones et al. 2003). This error distribution can be attributed to the fact that the movement of TCs during extratropical transition is strongly influenced by the westerly jet and that errors are larger in the direction of flow of the jet stream.
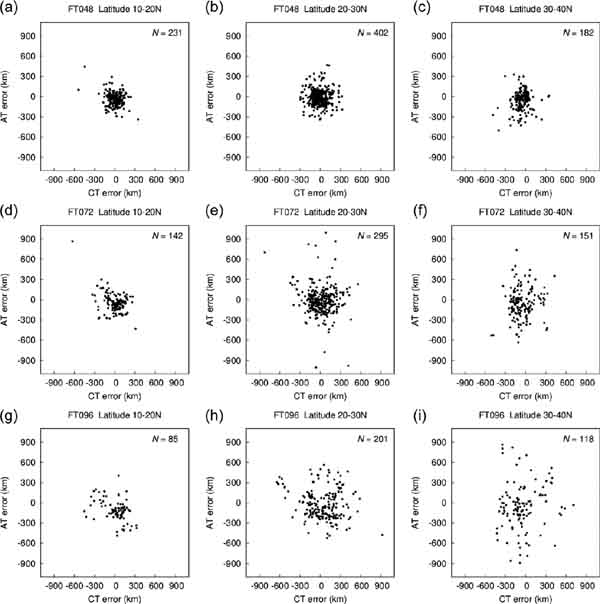
Scatter plots of position errors (km) of the JMA's official TC track forecasts decomposed into their AT and CT components at forecast times (FT) of 48, 72, and 96 h (rows) in the 10–20°N, 20–30°N, and 30–40°N latitude bands (LAT) (columns). (a) FT048, LAT10–20°N. (b) FT048, LAT20–30°N. (c) FT048, LAT30–40°N. (d) FT072, LAT10–20°N. (e) FT072, LAT20–30°N. (f) FT072, LAT30–40°N. (g) FT096, LAT10–20°N. (h) FT096, LAT20–30°N. (i) FT096, LAT30–40°N. The number of samples (N) is shown in each panel.
Figures 4a and 4b show examples of TC track predictions for Typhoon Malakas in 2016 and Typhoon Shanshan 2018, respectively, in the multiple-ensemble results from JMA, ECMWF, NCEP, and UKMO, along with the probability circle and ellipse at the FT of 72 h. The probability circle and ellipse share the same center, which is at the ensemble mean of the TC central position over all ensemble members, and the circle or ellipse includes the TC central position of 70 % of the ensemble members. Typhoon Malakas is a typical example of the ensemble spread being larger in the AT direction than in the CT direction; the ratio of the ensemble spread in the AT direction to that in the CT direction (hereafter referred to as AT/CT) is 5.2, indicating that the uncertainty as to when the typhoon will approach (i.e., its speed of movement) is larger than the uncertainty as to where it will move (i.e., its direction of movement). In contrast, Typhoon Shanshan is a typical example of the ensemble spread being larger in the CT direction than in the AT direction; the ratio of the ensemble spread in the CT direction to that in the AT direction (hereafter referred to as CT/AT) is 2.5. In this example, the uncertainty as to where the typhoon will move is larger than the uncertainty as to when it will approach.
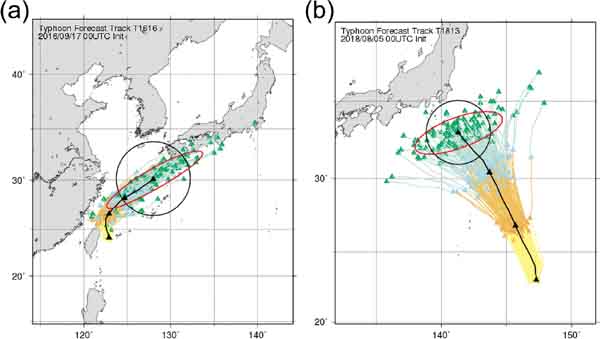
Examples of TC track prediction by the multiple ensemble (colored lines) and the ensemble mean forecasts (black line) at forecast times of 24, 48, and 72 h (orange, light blue, and green triangles, respectively) for (a) Typhoon Malakas, which initiated at 00 UTC on 17 September 2016, and (b) Typhoon Shanshan, which initiated at 00 UTC on 5 August 2018. The probability circle (black) and ellipse (red) at the forecast time of 72 h are also shown in (a) and (b).
Figures 5a and 5b show the ensemble mean TC locations where AT/CT and CT/AT, respectively, is 1.5 or more at the FT of 72 h during the 3-year verification period. There are more cases with uncertainties in the AT direction than cases with uncertainties in the CT direction: AT/CT is 1.5 or more in 76 cases and CT/AT is 1.5 or more in 49 cases. Moreover, CT/AT never exceeds 2.8, whereas AT/CT can take larger values and its maximum is 5.2 (Figs. 4a, 5). Notably, large AT/CT values are seen particularly in the midlatitudes (e.g., 30–40°N), where the westerly jet plays an important role in steering TCs. The relatively large uncertainties in the AT direction shown here are consistent with the fact that errors of the official TC track forecasts tend to be larger in the AT direction and in the midlatitudes (Figs. 2, 3).
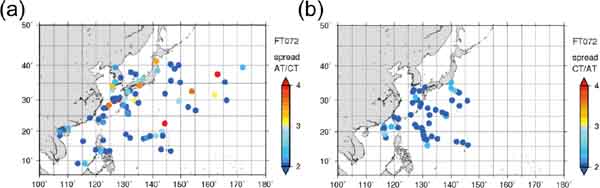
Ensemble mean TC locations at a forecast time of 72 h where (a) the ratio of the ensemble spread in the AT to CT direction (AT/CT) is 1.5 or more, and (b) the ratio of the ensemble spread in the CT to AT direction (CT/AT) is 1.5 or more.
Figure 6 shows the relationships between the ensemble spreads in the AT (CT) direction and the position errors of the ensemble mean predictions in the AT (CT) direction at FT of 48, 72, and 96 h. Errors are binned according to the spreads. The number of the bins is set to three in line with the number of categories of TC track forecast uncertainties used in RSMC Tokyo (Fukuda and Yamaguchi 2019). In a well-calibrated ensemble, the resulting line is close to the diagonal (Haiden et al. 2019). The mean error of the bin with large (middle-size) spreads is larger than that with middle-size (small) spreads for both AT and CT directions. Meanwhile, the mean spread is larger than the mean error in the bin with large spreads, indicating that the ensemble forecasts are overdispersive. The correlation coefficients (r) are positive, ranging from 0.29 to 0.62, and comparable to those for the spread–error relationship (r = 0.42 and 0.32 at FT of 48 and 96 h, respectively) obtained without decomposition into the AT and CT components (Fukuda and Yamaguchi 2019). The correlation coefficients tend to be larger when the relationship in the AT direction is evaluated than when it is evaluated in the CT direction, implying that the ensembles are more skillful in predicting uncertainties in the AT direction. The results shown here indicate that the multiple ensemble composed of the four global ensembles is capable of predicting the situation-dependent uncertainties of TC track forecasts in the AT and CT directions; therefore, an elliptical, instead of a circular, shape can be used to represent the forecast uncertainties associated with TC tracks.
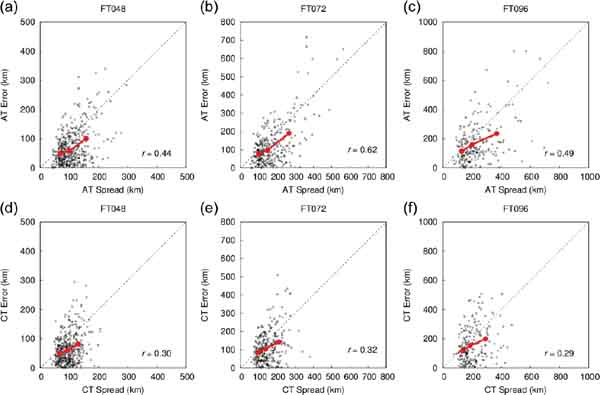
Relationship between the ensemble spread (km) and the position error of the ensemble mean prediction (km) in the AT and CT directions (rows) at forecast times of 48, 72, and 96 h (columns). The spreads are set to three equally binned categories, and the average error and spread for each bins are shown (red line). The value of the correlation coefficient is shown in each panel. AT: (a) FT048, (b) FT072, (c) FT096. CT: (d) FT048, (e) FT072, (f) FT096.
The area ratio of the probability ellipse to the probability circle is evaluated to determine whether the area is reduced by adoption of the probability ellipse instead of the probability circle. Table 2 shows the evaluation results as well as the number of cases and the detection rate at each FT. The area ratios are calculated by dividing the total area of the probability ellipses by the total area of probability circles for all prediction cases at each FT during the verification period (2016–2018). The detection rate is defined as the percentage of the observed TC central positions, based on the JMA's best-track data, that are within the probability circle or ellipse. All of the obtained area ratios are smaller than 1; therefore, the use of the probability ellipse instead of the probability circle has the potential to reduce the area. Moreover, the area ratio becomes smaller as the FT increases; thus, adoption of the probability ellipse instead of the probability circle more effectively reduces the uncertainty area when FT are longer (e.g., 5 days).
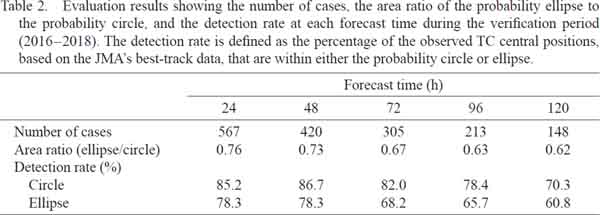
Although both probability circle and ellipse are created so that they include the TC central positions of 70 % of the ensemble members, the detection rates are not 70 %. Those of the probability circle are more than 70 % at all FT and tend to be much larger than 70 % at early FT, implying that, on average, the multiple ensemble spreads are too large (overdispersive) at the early FT. For a fair comparison of area between the probability circle and ellipse, the area ratios should be evaluated when the detection rate of both the probability circle and ellipse is 70 %.
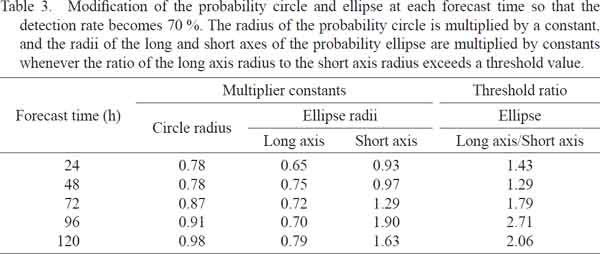
Thus, the size of the probability circle and ellipse must be modified so that the detection rate becomes 70 %. For the probability circle, we simply multiply the radius of the probability circle by a constant such that the detection rate becomes 70 %. Note that the value of the multiplier at a given FT is the same for all prediction cases during the 3-year verification period. For the probability ellipse, we multiply the radii of the long and short axes by constants whenever the ratio of the long axis radius to the short axis radius exceeds a certain threshold. The constants and the threshold are introduced to fix the direction along the long axis of the ellipse; otherwise, it may happen that the direction of the long (short) axis changes to the direction of the short (long) axis. These three values are determined such that the total area of the probability ellipse is minimized. Table 3 shows the multiplier constants for the probability ellipse and circle along with the threshold ratio for the ellipse at each FT. All constants for the probability circle are smaller than 1 and become larger as the FT increases, which is consistent with the detection rates shown in Table 2. The constants for the long axis of the probability ellipse are smaller than those for the short axis radius; thus, the ellipses become more circular when they are modified to have a detection rate of 70 %. Examples of modified probability circles and ellipses are shown in Fig. 7.
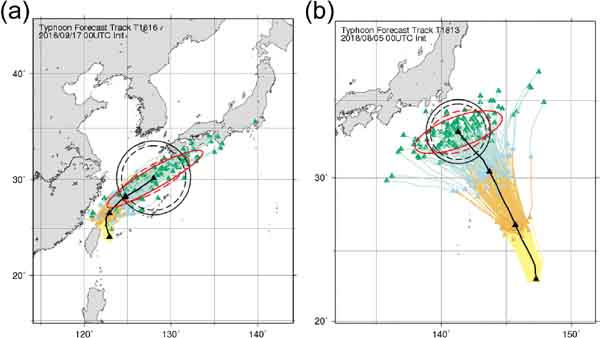
As in Fig. 4, but modified probability circles and ellipses (dashed lines) are described.
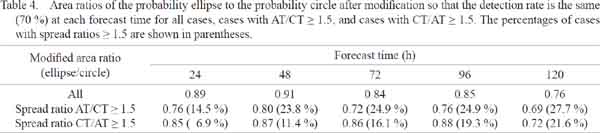
Even after this modification, the evaluated area ratios are still smaller than 1 and tend to be smaller at longer FT (Table 4). For example, the area is reduced on average by 16, 15, and 24 % at the FT of 3, 4, and 5 days, respectively, by adopting the probability ellipse instead of the probability circle. If the area ratios are evaluated only for cases with AT/CT (CT/AT) ≥ 1.5, the area is reduced by 28, 24, and 31 % (14, 12, and 28 %) at the FT of 3, 4, and 5 days, respectively (Table 4).
The ensemble mean TC locations where AT/CT (CT/AT) is 1.5 or more at a FT of 72 h are shown in Figs. 8a, 8c, 8e, and 8g (Figs. 8b, d, f, h) for March–May (MAM), June–August (JJA), September–November (SON), and December–February (DJF), respectively. Cases with AT/CT ≥ 1.5 are more frequent than cases with CT/AT ≥ 1.5 in all seasons. There are 82 named TCs during the 3-year verification period, and TCs in JJA and SON account for 91 % of all TCs. Cases with large uncertainty in the AT direction are concentrated in JJA and SON and tend to occur at more northerly locations during JJA than during SON. This result can be explained by the southward shift of the westerly jet from summer to autumn. Most cases with AT/CT ≥ 3.0 occur in SON, when the westerly jet is relatively strong over the midlatitudes. Cases with large uncertainty in the CT direction are also concentrated in JJA and SON and also tend to occur at more northerly locations during JJA than during SON. These large uncertainties in the CT direction tend to occur at or near the recurvature point of the TC track or in an environment where the TC steering flow is weak.
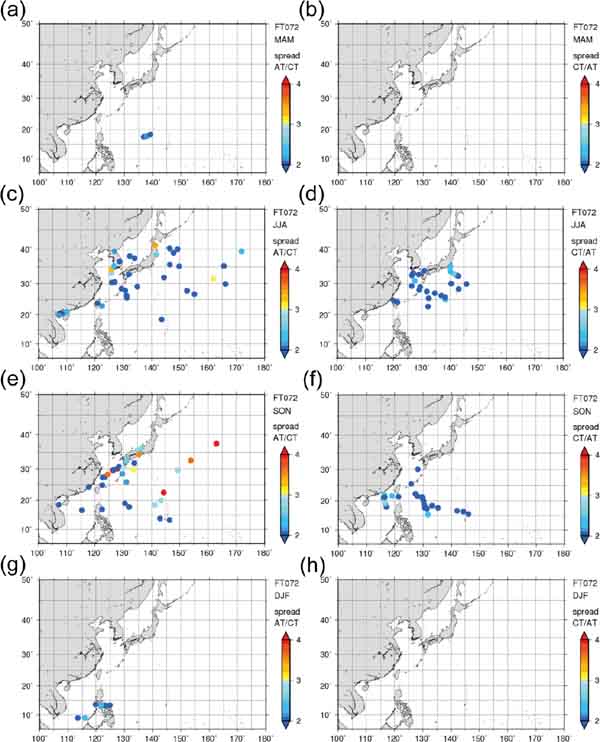
As in Fig. 5, but for seasonal variabilities of AT/CT and CT/AT: (a) and (b) March–May (MAM); (c) and (d) June–August (JJA); (e) and (f) September–November (SON); and (g) and (h) December–February (DJF).
In a few cases, the ensemble spread is extremely large and the radius of the probability circle and the long axis radius of the ellipse are over 2000 km. For example, for Typhoon Saola (2017), some ensemble members predict a westward path, whereas other ensemble members show the TC following a recurving path and moving toward the northeast (Fig. 9). The radius of the probability circle for this TC is 2010 km at a FT of 120 h. Such a large probability circle would be inappropriate as there would be a large portion of the probability where there are no tracks for a bifurcation situation. It would therefore be better to consider another approach, such as selecting one of the two scenarios and then creating either a probability circle or ellipse for that scenario.
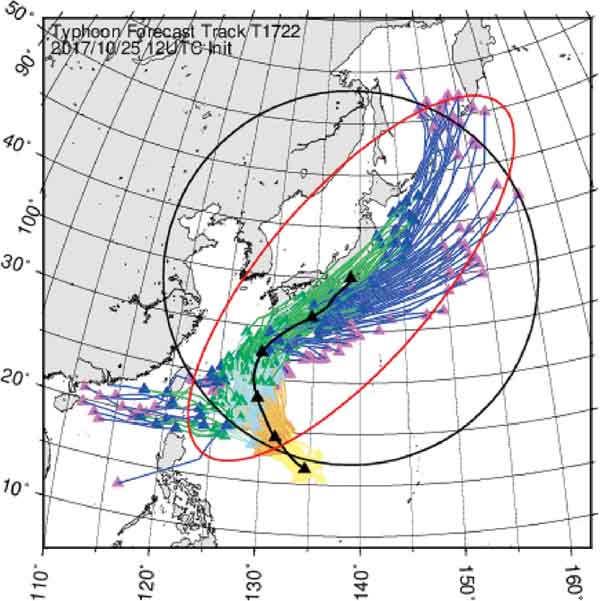
TC track forecasts of ensemble members showing TC movement in two distinct directions (Typhoon Saola, initiated at 12 UTC on 25 October 2017). The TC track and locations of each ensemble member at forecast times of 24, 48, 72, 96, and 120 h are shown (orange, light blue, green, blue, and pink triangles, respectively). The black line shows the TC track of the ensemble mean forecast. The probability circle (black) and ellipse (red) at the forecast time of 120 h are also shown.
The effectiveness of the probability ellipse for TC track forecasts was investigated by using multiple ensembles from JMA, ECMWF, NCEP, and UKMO and verified for all TCs from 2016 to 2018. First, evaluation of the characteristics of the JMA's official TC track forecasts showed that TC position errors were larger in the AT direction than in the CT direction at all FT. Moreover, these large errors in the AT direction were particularly notable in the midlatitudes, where the movement of TCs is greatly influenced by the westerly jet. Furthermore, we assessed the relationship between ensemble spreads and mean TC position errors in the AT and CT directions. The four-center multiple ensemble was found to be able to represent TC track forecast uncertainties in the AT and CT directions appropriately. The probability circle from the statistical method based on climatology does not sufficiently represent forecast uncertainty (Narita 2015), while the multiple ensemble composed of the four global ensembles is capable of appropriately predicting the situation-dependent uncertainties of TC track forecasts in the AT and CT directions.
We also examined the reduction of the area by replacing the probability circle with the probability ellipse. When the area ratio of the probability ellipse to the probability circle was evaluated at the same detection rate of 70 %, the probability ellipse could reduce the area by 16, 15, and 24 % on average at FT of 3, 4, and 5 days, respectively. Decreasing the forecast area by the probability ellipse enables us to narrow warning areas of TC track forecasts and to enhance disaster prevention/mitigation measures. Moreover, the probability ellipse would be better representation for likely uncertainty of TC track forecasts.
JMA operationally employs the probability circle with a radius based on confidence levels derived from cumulative ensemble spreads of the multiple ensemble (Fukuda and Yamaguchi 2019). The probability circle implicitly assumes that position errors are distributed isotropically, but the introduction of the probability ellipse makes it possible to provide appropriate information about uncertainty in both the direction and speed of TC movement. This additional information would be useful for decision-makers and disaster preparedness planning communities.
This study focused on the uncertainty of TC track forecasts. However, the TC-related disaster may occur outside of the warning area. Thus, expansion of the uncertainty of TC track forecast into the uncertainty of hazards is important (Titley et al. 2020). Future challenges include training forecasters on the utilization of ensembles, as the use of advanced probabilistic information requires changes in operational working practice, and developing ensemble-based and hazardbased forecasts for strong winds, heavy precipitation, and storm surge.
The authors thank Dr. Masayuki Kawashima and two anonymous reviewers for useful comments. This work was partly supported by JSPS KAKENHI Grant Number JP18H01283.