3. Mechanism of impacts
3.1 Evolutions of the vortices
Figure 2 shows the time evolutions of the minimum sea level pressure (MSLP) and maximum azimuthal-mean wind (MAMW) at the height of 10 m in CTL, SUA, SLC, and SUALC from the 3-km simulation data. The vortices in the first 60 h experience adjustment and spin-up processes, with little development, followed by different intensification rates among the four cases. The development of vortices varies with the existing background flows on a beta plane. A strong TC develops at t = 120 h in SLC with an MSLP of 959 hPa, whereas the vortex develops much more slowly throughout the whole 120-h simulation in SUA with an MSLP of 994 hPa. The vortices in CTL and SUALC develop at rates between those in SLC and SUA with final MSLPs of 980 hPa and 967 hPa, respectively. The time when the MAMW at 10 m exceeds 15 m s−1 is defined as the time of cyclogenesis. This definition may correspond to a peak wind above 17 m s−1, but denotes a relatively stable vortex. Based on this definition, tropical cyclogenesis occurs at t = 99 h in CTL and SUALC, at t = 117 h in SUA, and at t = 93 h in SLC.

Also, the simulated TCs have a vertical structure typical of a strong TC at the end of the simulation. Figure 3 displays the vertical–radial cross-sections of the azimuthal-mean tangential wind, radial wind, and diabatic heating fields in CTL, SUA, and SLC. The TCs in these three experiments are all characterized by a tilted eyewall and a salient “in–up–out” secondary circulation. In SLC, the maximum tangential wind reaches 58 m s−1 at a radius of nearly 40 km at 850 hPa (Fig. 3c). Furthermore, there are strong radial inflow and outflow layers in the planetary boundary layer (PBL) and upper-level, respectively (Fig. 3f). The structures of the axisymmetric TC wind and heating fields in CTL and SUA are similar to those in SLC but with apparently weak magnitudes (Figs. 3a, b, d, e).

The modeling results indicate that the vortex with the enhanced lower-level cyclonic circulation has a rapid intensification rate. This finding is partly consistent with previous observational and numerical analyses insomuch that a preexisting weak disturbance in an environment with enhanced lower-level cyclonic vorticity is more likely to evolve into a TC (Gray 1968, 1998; Zehr 1992; Cao et al. 2012, 2014a, b; Fu et al. 2012). However, Xu et al. (2016) showed that a vortex does not always experience rapid development when it interacts with a monsoon gyre. The discrepancy between the findings of this study and Xu et al. (2016) are discussed further in the following section.
On the other hand, the upper-level anticyclonic circulation makes a negative contribution to vortex development compared to CTL. This result is inconsistent with the earlier study of MZ81, which reported that the presence of an upper-level anticyclonic circulation is necessary and favorable for TC genesis. However, our finding is consistent with the argument in W98: During the vortex intensification stage, a vortex without an upper-level anticyclonic circulation develops more quickly than a vortex with an upper-level anticyclonic circulation. We will further investigate why the upper-level anticyclonic circulation and lower-level cyclonic circulation have opposite effects on TC genesis in the following analyses.
3.2 Upper-level anticyclonic circulation
Figure 4 shows the wind field and zonal wind evolutions at 150 hPa in CTL, SUA, and SLC from the 27-km simulation data at t = 0 h, 72 h, and 120 h. At first, the winds at 150 hPa in CTL and SLC are negligible, whereas a strong anticyclonic circulation appears in SUA (Figs. 4a, d, g). At t = 72 h, westerly winds almost prevail at the upper-level in CTL and SUA. The stronger winds appear north of the vortex center in the latter (Figs. 4b, e). This result implies there are westerly winds in the upper-level of SUA, induced by the large-scale background circulation, resulting in large vertical wind shear. In contrast, a relatively clear anticyclonic circulation develops, with weak easterly winds located on the southwest side of the vortex center in SLC (Fig. 4h). Toward the end of the simulation, the westerly winds on the north side of the vortex center intensify from 6 m s−1 to 14 m s−1 in CTL (Figs. 4b, c) and from 10 m s−1 to 14 m s−1 in SUA (Figs. 4e, f). Furthermore, there is apparent divergence around the vortex center, with easterly winds to the west and westerly winds to the east in CTL (Fig. 4c), while strong westerly winds are still dominant to the northeast in SUA (Fig. 4f). In the presence of the lower-level cyclonic circulation, a rather strong and organized anticyclonic circulation appears in SLC (Fig. 4i). This circulation implies that the upper-level anticyclonic circulation develops well due to well-organized deep convection.

In addition to the upper-level winds, we also examined the winds at the lower-level (Fig. 5). Initially, the winds of the vortices are the same in CTL and SUA at 850 hPa (Figs. 5a, d), whereas the winds in SLC spread widely over a large area (Fig. 5g). At t = 72 h, although the extents of the vortices in CTL and SUA are almost the same, the wind magnitude is slightly larger in CTL than in SUA; this indicates that the upper-level anticyclonic circulation has an overall negative effect on vortex development (Figs. 5b, e). On the other hand, the wind magnitudes are almost the same in CTL and SLC, with a maximum easterly wind of 10 m s−1 (Figs. 5b, h). However, the extents of the easterly and westerly winds are broader in SLC than in CTL and SUA. At t = 120 h, the winds are much stronger in SLC than in CTL and SUA (Figs. 5c, f, i).

Based on the upper-level wind distributions in Fig. 4, Fig. 6 further shows the area-averaged (720 km × 720 km) vertical zonal wind shear, which dominates the total vertical wind shear, around the TC center between 150 hPa and 850 hPa from t = 0 h to t = 96 h. Note that 200 hPa and 850 hPa are conventional choices for calculating the vertical wind shear. However, in the present study, the upper-level circulation is maximal at 150 hPa. To better examine the background vertical wind shear's effect on TC genesis, a spatial filtering technique is applied to separate the mesoscale vortex from the environmental circulation. Winds with wavelengths larger than 500 km are considered large-scale background circulation, while winds with wavelengths smaller than 500 km represent the TC-scale vortex and smaller-scale convection. A strong vertical wind shear can inhibit TC development by ventilating moisture and energy away from the TC core region (e.g., Gray 1968), or entraining low-entropy air into the boundary layer (e.g., Riemer et al. 2010). The differences in the vertical zonal wind shear are closely associated with the development of vortices in these three experiments. The vertical zonal wind shear in SUA ranges from 6 m s−1 to 8 m s−1 after t = 66 h, whereas it varies between −2 m s−1 and 4 m s−1 in SLC, and the vertical zonal wind shear in CTL falls between 0 m s−1 and 6 m s−1. Before t = 72 h, the vertical zonal wind shears in the three runs have prominent differences before the vortices start to intensify (Figs. 6, 2). Note that the difference in the vertical zonal wind shear is not very sensitive to the size of the averaging box (such as 720 km × 720 km, 600 km × 600 km, and 450 km × 450 km) or to the use of spatial filtering (figures not shown).

The evolution of the vertical zonal wind shear depends closely on the zonal wind structures at the upper and lower levels, particularly the former. At first, the upper-level anticyclonic circulation is antisymmetric around the vortex center (Fig. 4d). At t = 72 h, the westerly winds to the north in SUA are the strongest among the three experiments at the upper-level (Fig. 4e); these westerly winds are associated with the development of a beta gyre in the lower-level cyclonic circulation and the resultant asymmetry. A cyclonic circulation-induced beta gyre is a pair of vorticity anomalies, with low vorticity to the northeast of the cyclone center and high vorticity to the southwest of the cyclone center at the lower-level. These conditions lead to maximum winds in the northeastern part of the vortex at the lower-level (Holland 1983; Fiorino and Elsberry 1989; Wu and Emanuel 1993, 1994). The strong winds in the northeastern quadrant of the vortex induce large surface heat fluxes (including sensible and latent heat fluxes) and thus higher atmospheric humidity (figure not shown). The friction-induced near-surface inflow further leads to ascending motion and more upward moisture transport, facilitating more convective heating in the region with the maximum wind and heat fluxes.
Figure 7 shows the 600-hPa geopotential height, sea level pressure (SLP), and 300-hPa vertical velocity fields in CTL, SUA, and SLC averaged over t = 60–72, 72–84, and 84–96 h. The major vertical motions are mostly located in the northeastern or southeastern quadrants of the vortex, similar to the upper-level westerly winds. Thus, the asymmetries of the vertical motion and associated diabatic heating might play an important role in generating the upper-level asymmetric westerly flows. The diabatic heating in the northeastern quadrant of the vortex is associated with the upper-level outflows and divergent flows. In other words, the relatively large diabatic heating in the northeastern quadrant of the vortex generates anomalous southwesterly outflows around the vortex center at the upper-level. With the effect of Earth's vorticity, the northwesterly winds beyond the vortex core are dominant at the upper-level in the northeastern quadrant of the vortex as shown in Fig. 4. When the large-scale upper-level anticyclone is added into the CTL run, it increases the westerly wind asymmetry north of the vortex, resulting in a larger vertical westerly wind shear than that in CTL, as shown in Fig. 6. The processes above are similar to those proposed by Li et al. (2014). They suggested that the convection asymmetries and associated diabatic heating induced by the land-sea surface contrast play a critical role in generating upper-level asymmetric westerly flows. Moreover, due to the weakest inertial instability at the upper-level in SUA, induced by strong anticyclonic flows, the outflow jet extends over a greater horizontal distance at the upper-level than at the lower-level (Ge et al. 2010). The vertical wind shear in the simulation is different from the beta shear, which results from the height-dependent planetary vorticity advection (Wang and Holland 1996a, b; Ritchie and Frank 2007; Fang and Zhang 2012). These studies mainly examined the beta shear's effect on a mature TC's intensity. Ritchie and Frank (2007) indicated that the beta shear is primarily associated with the structure of the initial vortex, which consists of a cyclone in the lower-level and an anticyclone in the upper-level. In the present study, the imposed large-scale anticyclonic circulation in the upper-level induces the vertical wind shear.

Previous studies have shown that vertical wind shear can lead to the development of a forced secondary circulation with an anomalous ascent on the downshear side and an anomalous descent on the upshear side (e.g., Zhang and Kieu 2006; Ge et al. 2013). These studies suggested that the ascending branch on the downshear side may reinforce itself through releasing latent heat by convection and enhance the secondary circulation. This enhanced secondary circulation could overcome the tilting induced by vertical wind shear and restore the vertical alignment, resulting in TC genesis (Ge et al. 2013). In contrast, some other studies suggested that a diabatically driven secondary circulation cannot maintain a mature TC's vertical alignment directly (Jones 2004; Reasor et al. 2004; Reasor and Eastin 2012). These researchers indicated that an inviscid damping mechanism intrinsic to a vortex's dry adiabatic dynamics is responsible for decreasing deviations from an upright state. To further examine how vertical wind shear makes a negative contribution to TC genesis, we investigate the vertical zonal cross-section of the meridional wind through the vortex center at t = 72, 84, and 96 h in CTL, SUA, and SLC (Fig. 8). At t = 72 h, the vortices more or less tilt eastward in the vertical direction under the beta-induced westerly shear that results from the height-dependent advection of the planetary vorticity (Figs. 8a, d, g). The tilt induced by the beta-induced shear might play a role in the early development of asymmetric convection. This eastward tilt is the most remarkable in SUA due to the strongest vertical zonal wind shear (Figs. 8d, 6). Twelve hours later, the vertical tilt decreases and the vertical alignment of each vortex in CTL and SLC is gradually restored, with more evident vertical alignment in the latter (Figs. 8b, h). Accompanied by this vertical alignment, the vortices begin to intensify rapidly (Fig. 2). However, the vertical tilt persists in SUA during the following 12 h (Fig. 8e), indicating that the secondary circulation is not strong enough to restore the vertical alignment in SUA. At t = 96 h, the vortices become vertically aligned in CTL and SLC (Figs. 8c, i). The meridional wind, however, is much stronger in SLC than in CTL. In SUA, the meridional wind of the vortex is still characterized by an eastward tilt with height and a zonal asymmetric structure at the middle-lower levels at t = 96 h (Fig. 8f); as a result, the vortex develops slowly in SUA (Fig. 2).

As discussed above, strong vertical wind shear can ventilate moisture and energy away from the TC core region, inhibiting TC development (Gray 1968). Figure 9 shows the time–azimuthal cross-sections of the radial-mean (0–150 km) vertical motion at 300 hPa for CTL, SUA, and SLC from t = 60 h to t = 120 h. The 300-hPa level is the maximum vertical motion location. Before t = 90 h, the dominant vertical motions in the three runs are located in the northeastern and southeastern quadrants of the vortex. Among the three runs, the extents of the azimuthal coverage of the vertical motions are the smallest in SUA, indicating that the SUA's larger vertical wind shear makes a negative contribution to the frequency of the convective cells. After t = 90 h, convection starts to develop along the anti-clockwise direction of the vortex in CTL and SLC (Figs. 9a, c). In SLC, the vortex is almost entirely wrapped by deep convection at t = 102 h, indicating that the vertical motion asymmetries and associated diabatic heating decrease remarkably (Fig. 9c). In contrast, the vertical movement is still confined largely to the northeast and southeast quadrants of the vortex in SUA.

Figure 10 further shows the vertical–radial cross-sections of the azimuthal-mean diabatic heating averaged over t = 60–72, 72–84, and 84–96 h in the three runs. At 60–72 h, the diabatic heating is generally similar among three runs (Figs. 10a, d, g). In the following 12 h, the differences in diabatic heating become evident among the three experiments. The convection in SLC is the most vigorous, maximizing at 500 hPa at a radius of approximately 30 km (Fig. 10h). The convection in CTL is maximized at a radius of 50 km at the same level but with a relatively weak magnitude (Fig. 10b). In contrast, the diabatic heating in SUA is the weakest at the vortex center (Fig. 10e), which may be due to the absence of a clear eye region and the tilt of the heating structure in the weak vortex. At 84–96 h, greater diabatic heating is promoted in all three cases, with gradual restoration of the vortices' vertical alignment, as shown in Fig. 8. The heating structure in SLC (Fig. 10i) bears a characteristic convective precipitation regime (Mapes and Houze 1995), while the convective heating in CTL intensifies and contracts from a radius of 50 km to 20 km (Figs. 10b, c). In contrast, the heat in SUA has a relatively larger size, indicating that the TC is characterized by a less contracted vortex (Fig. 10f). The results shown in Figs. 9 and 10 suggest that a strong vertical zonal wind shear can induce slow vortex development by ventilating energy away from the inner core during the early stage of TC genesis.

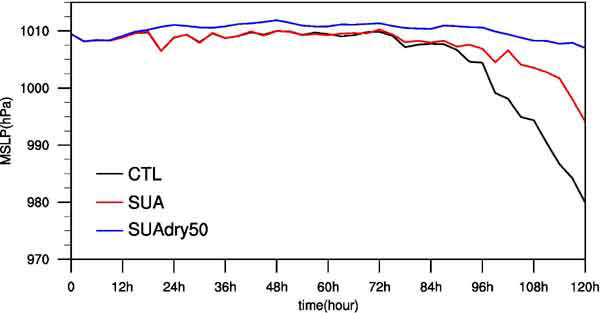
Two groups of additional sensitivity experiments support the physical mechanisms that we propose. The first group of experiments is similar to the SUA case, except the initial specific humidity is decreased by 50 % to examine the impact of the moisture. This experiment is called SUAdry50. As expected, vortex development is slower in SUAdry50 than in SUA and CTL due to the decrease in moisture (Fig. 11). Furthermore, we compare the surface latent and sensible heat fluxes and the vertical structure of the vortex between SUA and SUAdry50. The asymmetric surface heat fluxes in SUAdry50 appear at t = 72 h and then intensify at t = 84 h and t = 96 h (Figs. 12a–c). The vortex does not show an obvious tilt at t = 72 h in SUAdry50 (Fig. 12d). The vortex has a similar vertical tilt at t = 60 h as at t = 72 h (figure not shown). With increased asymmetric surface heat fluxes, the eastward tilt in SUAdry50 increases remarkably after t = 84 h (Figs. 12e, f). Due to the decreased moisture content in the atmosphere, convection development and vertical tilting are delayed in SUAdry50 compared to SUA (Figs. 8, 12). The comparison between SUA and SUAdry50 indicates that the vertical wind shear and vertical tilt do not develop earlier than the asymmetry of surface heat fluxes. The SUAdry50 sensitivity experiment supports the hypothesis that the vertical tilt of the vortex is induced by the asymmetries of the surface fluxes and associated diabatic heating.

The second group of experiments is similar to CTL and SUA, except that these experiments are conducted on an f plane at 15°N; thus, they are called CTL_f and SUA_f, respectively. The f plane eliminates the beta gyres, and the anticyclone in the upper-level is well maintained (figure not shown). Figure 13 shows that the vortex development in SUA_f is similar to the vortex in CTL_f, indicating that the well-organized upper-level anticyclone does not detrimentally affect tropical cyclogenesis. Through a comparison with the simulation results on the beta plane, we conclude that the establishment and development of the beta gyre, and the evolution and deformation of the upper-level anticyclonic circulation on the beta plane, result in a large vertical wind shear, which is unfavorable to tropical cyclogenesis. We will investigate the mechanisms by which the vortices in SUA_f and CTL_f have similar genesis times in future work.
3.3 Lower-level cyclonic circulation
As Fig. 2 shows, the modeling results indicate that the vortex has a large intensification rate under the lower-level cyclonic circulation. Thus, to examine how the lower-level cyclonic circulation makes a positive contribution to TC genesis, we first investigate the time evolutions of the area-averaged tangential wind, surface heat flux, relative humidity, and diabatic heating from t = 48 h to t = 96 h in CTL, SUA and SLC (Fig. 14). The vortex's superposition with the large-scale cyclonic circulation at the lower-level enhance the tangential wind in the core (Fig. 14b). These conditions induce greater surface heat fluxes (including both sensible and latent heat fluxes) in SLC than in CTL and SUA (Fig. 14c), leading to the upward extension of high humidity. As a result, the vertically averaged magnitude of relative humidity is greater in SLC than in CTL and SUA (Fig. 14c), which is favorable for the development of convection reflected by the vertically integrated diabatic heating (Fig. 14d). As shown in Fig. 9, the extent of the azimuthal coverage of strong vertical motion is the greatest in SLC, reflecting the occurrence of more convective bursts inside or near the maximum wind radius.

Previous studies showed that convective cells could experience progressive organization and aggregation toward the vortex center (Ge et al. 2013). Schecter and Dubin (1999) showed that vorticity anomalies, generated by small convective cells, could segregate under the ambient radial vorticity gradient's influence. Positive vorticity can move up, and negative vorticity can move down along the ambient vorticity gradient, resulting in the separation of positive and negative vorticities. Figure 15 shows the horizontal distribution of the relative vorticity for the small-scale system and large-scale system in CTL and SLC from t = 78 h to t = 108 h at an interval of 6 h by using the Fourier spatial filtering technique. Compared with CTL, the positive convectively generated vorticity anomalies have a faster build-up in SLC at t = 84 h (Figs. 15b, h). Subsequently, more small-scale vorticity anomalies aggregate toward the center region of the vortex in SLC (Figs. 15d–f, j–l). Ge et al. (2015) suggested that a larger ambient vorticity gradient is more favorable for a quicker segregation process. Figure 16 shows the radial profiles of the azimuthal-mean relative vorticity and the related vorticity gradient (-d(Vor)/dR; Vor is relative vorticity and R is the radial distance from the TC center) near the TC center during the early stage of TC genesis. Consistent with the earliest TC genesis, the relative vorticity and the radial vorticity gradient are the largest in SLC among the three cases, which leads to a quicker TC genesis.

As an indicator of the potential for TC development, the Okubo–Weiss (OW) parameter is examined to measure the effect of horizontal flow deformation. At the middle level, large deformed flows can facilitate penetration of surrounding dry air into the core of a vortex, suppressing TC development (Dunkerton et al. 2009; Raymond et al. 2011; Ge et al. 2013). This process may inhibit the increases in moisture and convection necessary for the lower-level vortex spinup (Nolan 2007). Following Raymond et al. (2011), the normalized OW parameter is
where
The above parameter is expressed in the form of the square of the relative vorticity minus the squares of the two strain rate components. The parameter equals 1 when the flow is entirely rotational and −1 when the flow is strained. Generally, the maxima of the OW parameter are around the inner core of the vortex.
Figure 17 depicts the evolution of the area-averaged (60 km × 60 km) OW parameter in vertical–time cross-sections from
t = 72 h to
t = 120 h following the vortex center in the three experiments. The value of the OW parameter in SLC is much higher and more positive in the middle troposphere than in the other two experiments. Thus, rotational flows dominate over strained flows in SLC, which inhibit dry air entrainment into the vortex region core (
Raymond et al. 2011).

Note that Xu et al. (2016) found that a vortex does not experience a quicker genesis when a TC is embedded into a monsoon gyre. They demonstrated that vortex superposition with a large-scale monsoon gyre produces a vortex with a larger outer size, which is not conducive to rapid vortex development (Xu and Wang 2018). However, in our study, a vortex superposition with a large-scale cyclonic circulation at the lower-level does not lead to a noticeable increase in the maximum wind radius, except for a salient rise in the tangential wind near and outside the maximum wind radius (Fig. 18). Our simulation results show that increasing the tangential wind near and outside the maximum wind radius can result in higher surface heat fluxes in SLC, which is favorable for convection development in the core of the vortex (Fig. 14). Thus, the large-scale cyclonic circulation's positive contribution to the vortex development may be higher than the negative contribution due to the large initial size. However, the simulation result may be sensitive to the size of the large-scale cyclonic circulation, which will be investigated further in future work.

The third group of additional experiments is designed to examine the vortex development's sensitivity to the upper-level anticyclonic circulation structure (see Table 1). The four experiments in this group are the same as SUA except for differences in the vertical height, radius, and intensity of the maximum tangential wind of the upper-level anticyclonic circulation. Only one parameter of the maximum tangential wind is modified in each additional experiment relative to the parameters in SUA. In the first and second experiments (SUA_P250 and SUA_P100, respectively), the maximum upper-level anticyclonic circulation is set at 250 hPa and 100 hPa, respectively. In the third experiment (SUA_R400), the initial maximum tangential wind of the upper-level anticyclonic circulation is located at a radius of 400 km. In the fourth experiment (SUA_V16), the initial maximum tangential wind of the upper-level anticyclonic circulation is set to 16 m s−1.
Figure 19 shows the time evolutions of the MSLP in CTL, SUA, SUA_P250, SUA_P100, SUA_R400, and SUA_V16. The vortex development, influenced by the upper-level anticyclonic circulation, is not highly sensitive to the vertical height, radius, and magnitude of the maximum tangential wind of the upper-level anticyclonic circulation. Compared with that in CTL, the upper-level anticyclonic circulations in the additional experiments have a consistently negative effect on the rapid development of the vortex. The wind field evolutions at 150 hPa in SUA_P250, SUA_R400, and SUA_V16 (shown in Fig. 20) are also examined and compared with the evolution in SUA. At the initial time, the winds at 150 hPa are very weak in SUA_P250 (Fig. 20a), whereas there are intense anticyclonic circulations in SUA_R400 and SUA_V16, with stronger winds covering broader extents in the latter (Figs. 20d, g). At t = 72 h, the westerly wind development to the north-northeast in these three experiments is associated with the lower-level beta gyre and the asymmetries of the vertical motion and diabatic heating, as discussed in Section 3.2. At t = 120 h, the westerly winds poleward of the vortex center intensify and dominate on the northeastern side of the vortex center in these three runs (Figs. 20c, f, i). The westerly wind evolutions in all three experiments are similar to those in SUA (Figs. 20, 4d–f). As a result, a relatively strong vertical wind shear is induced, which slows down the development of the vortex, as discussed in Section 3.2. The simulation results indicate that the upper-level anticyclonic circulation makes a negative contribution to the vortex development compared with CTL, regardless of the vertical height, radius, and magnitude of the maximum tangential wind of the upper-level anticyclonic circulation. This conclusion agrees with the finding of Xu et al. (2016). They showed that an upper-level circulation associated with a monsoon gyre is not conducive to vortex development.


Additional sensitivity experiments examine the statistical significance of the simulation results related to the initial conditions in the CTL and SLC cases. Five three-dimensional random disturbances with the magnitude less than 10−2 m s−1 are added into the zonal wind fields in the CTL and SLC cases at the initial time, respectively. The black and red solid lines in Fig. 21 show averaged MSLP's time evolutions in the vortex in all the CTL and SLC experiments, respectively. As shown in Fig. 21, the simulation results are not so sensitive to the initial conditions, confirming that vortex development, initialized with the large-scale lower-level cyclone, invariably occurs faster than the vortex development in the control simulation.


