Abstract
Global warming already affects weather and climate worldwide; accordingly, various studies have been conducted to understand the effects of climate change on tropical cyclones. The translation speed of a tropical cyclone is a particularly important feature, as a slower translation speed lengthens the duration of a cyclone's impact. Here, on the basis of observational data, we report that tropical cyclone translation speeds in the middle latitudes of the western North Pacific basin have significantly decreased during September over the last 40 years. Historical model simulations with and without observational global warming trends reveal two main factors responsible for the translation speed slowdown: natural decadal climate variabilities (such as the Pacific Decadal Oscillation) and global warming. Both factors produce an anticyclonic anomaly in the westerly jet over western Japan; this anomaly relaxes the latitudinal geopotential height gradient, weakening the environmental synoptic winds by which tropical cyclones are steered. Furthermore, model simulations for a future warmer climate show that global warming further reduces the steering flows, leading to more slowly-moving tropical cyclones in autumn in the future.
1. Introduction
A recent study by the world's top eleven scientists on tropical cyclones (TCs) and climate change showed with high confidence that the precipitation rates of TCs will increase in a future warmer climate (Knutson et al. 2020). Although future projections of TC frequency and intensity suffer from relatively large uncertainties (e.g., Camargo 2013; Knutson et al. 2019, 2020), an anthropogenic global warming of 2 K is expected to induce a median projected increase of 14 % in the rain rates of TCs globally. Combined with this expected increase in TC rain rates, the relationship between the translation speed of TCs and global warming has attracted growing interest (Kossin 2018a, b; Moon et al. 2019; Lanzante 2019; Chan 2019; Yamaguchi et al. 2020; Zhang, D. et al. 2020; Zhang, G. et al. 2020). This interest is warranted primarily because the amount of accumulated precipitation at a given location is determined not only by the TC rain rate but also by the TC translation speed (Kim et al. 2006; Altman et al. 2013; Emanuel 2017; van Oldenborgh et al. 2017). Typhoons Faxai and Hagibis, which struck Tokyo and its surrounding areas in September and October 2019, respectively, are recent examples of slow-moving TCs that caused catastrophic damage with tremendous impacts, including the collapse of river dikes in many cities (Normile 2019). Most importantly, the translation speeds of Typhoons Faxai and Hagibis upon approaching Tokyo were 41 % and 39 % slower than the average translation speed of typhoons that approached Tokyo in September and October, respectively.
Some interesting studies have been reported in recent years on the translation speed of TCs. According to Kossin 2018a and Kossin 2018b, observational data since the mid-twentieth century indicate a slowdown of TC translation speeds, possibly due to global warming-induced weakening of the general atmospheric circulation. Some researchers have noted that this slowdown may not be a real climate signal and could instead be attributable to inhomogeneities in the observational data (Moon et al. 2019; Lanzante 2019; Chan 2019). Historical model simulations for 1951–2011 suggest that the translation speeds of TCs in the past have not significantly decreased (Yamaguchi et al. 2020). These previous studies investigated primarily annual and global or basin-wide mean TC translation speeds, whereas the abovementioned slowdown of TC translation speeds might become apparent upon examination within a certain month or season and within a delimited area. Furthermore, from climate change adaptation and mitigation perspectives, it is of great importance to investigate changes in TC characteristics in fine detail over time and space, as these characteristics may differ both temporally and spatially.
Here, we investigate whether the TC translation speed has slowed over recent decades in the western North Pacific (WNP) in detail over time and space using observational data. Then mechanisms behind the TC translation speed slowdown, if any, are explored with atmospheric reanalysis products. Furthermore, we analyze historical model simulations with and without observational global warming trends from the pre-industrial level in order to quantitatively evaluate the influence of global warming on the slowdown. Finally, future projections of the TC translation speed slowdown are discussed based on model simulation results for a future climate assuming a 4 K warming from the pre-industrial level.
The methods and data are described in Section 2, the results are outlined in Section 3 and discussed in Section 4, and the summary of this study is given in Section 5.
2. Methods and data
2.1 Best-track data and verification samples
The translation speeds of TCs are calculated using observational data known as best-track data. The best-track data are obtained from the Japan Meteorological Agency (https://www.jma.go.jp/jma/jma-eng/jmacenter/rsmc-hp-pub-eg/besttrack.html). In this study, we consider a period spanning the past 40 years (1980–2019). As previous studies have noted (Schreck et al. 2014; Moon et al. 2019; Lanzante 2019; Chan 2019), the best-track data acquired during the presatellite era contain inhomogeneities and large uncertainties in the data quality. For the 40 years from 1980 to 2019, however, geostationary satellites have been available over the WNP. Thus, it is relatively unlikely that any TC would go undetected in this period. Moreover, the best-track data have almost certainly become more homogeneous and increasingly reliable over the last 40 years.
Verification samples are limited to TC stages where the intensity classification is tropical storm or higher. The TC stages with intensity classifications of tropical depressions and extratropical cyclones are also analyzed in the best-track data. However, tropical depressions and extratropical cyclones are not considered in this study to focus on the behavior of relatively strong TCs. For exploring the physical mechanisms behind the TC translation speed slowdown, the Japanese 55-year reanalysis (JRA-55, Kobayashi et al. 2015) is used.
2.2 Model simulations
In this study, we analyze large ensemble simulation results known as Database for Policy Decision-Making for Future Climate Change (d4PDF, Mizuta et al. 2017). The simulations are conducted by an atmospheric global circulation model (AGCM). The AGCM used in this study is the Meteorological Research Institute AGCM, version 3.2 (MRI-AGCM3.2), with a 60-km horizontal grid spacing, exactly the same as that of MRI-AGCM3.2H listed in the archive of the fifth phase of the Coupled Model Intercomparison Project (CMIP5, Mizuta et al. 2012). In the simulations for the historical period with the observational global warming trend from the pre-industrial level, the observed monthly mean sea surface temperature (SST) and sea ice concentration from COBE-SST2 (Hirahara et al. 2014) are used as the lower boundary conditions. Global mean concentrations of greenhouse gases are set to the observational values for each year. The observed SST is used in the historical simulations without the observational global warming trend from the pre-industrial level, but the long-term trend is removed (Mizuta et al. 2017; Imada et al. 2017). The baseline of the detrended SST is the average from 1900 to 1919, during which the SST warming since the pre-industrial era is not clearly observed, and greenhouse gases are set to the estimated value in 1850. The ensemble size for both simulations is 100. In addition to using different initial conditions, small perturbations of SST based on its analysis error are adopted for the ensemble experiments.
A future climate scenario in which the global mean surface air temperature is assumed to be 4 K warmer than the pre-industrial climate is simulated, corresponding to global warming around the end of the twenty-first century under the CMIP5 representative concentration pathway 8.5 (RCP8.5) scenario (Yoshida et al. 2017). The amplitude of warming is kept constant throughout the simulations. The simulation period is 60 years, and the ensemble size is 90. Six CMIP5 models are used to obtain the warming pattern of the SST, and each pattern is added to the observational SST of 1951–2010. For each warming pattern, 15-member ensemble experiments are conducted using different initial conditions and sea surface perturbations for each SST change.
3. Results
3.1 Observational evidence
Using observational data of TC center positions archived in the best-track data, we calculate the translation speed every 6 h for every TC that appeared in the WNP from 1980 to 2019. Then, the translation speeds of TCs approaching major cities in the WNP are averaged in each month over the first (1980–1999, hereafter referred to as P1) and second (2000–2019, P2) twenty years. The definition of approaching is that the center position of a TC is within 300 km of the point for verification, where the distances between locations are calculated along a great circle arc. A comparison between P1 and P2 shows a clear slowdown of the monthly mean TC translation speed in September for cities north of 25°N. For example, the translation speeds of TCs having approached Tokyo, Osaka, Naha, Taizhou, and Taipei slowed down by 35, 33, 26, 23, and 10 %, respectively (see Table 1). The slowdown can also be seen in the Joint Typhoon Warning Center best-track data; it is not dependent on best-track data used (not shown).

We explore the mechanisms responsible for the TC translation speed slowdown using atmospheric reanalysis products (Kobayashi et al. 2015), revealing that the anticyclonic anomaly in the westerly jet over western Japan is the origin of the observed phenomenon (Fig. 1a). The westerly jet exists where the latitudinal gradient of the geopotential height is largest (35–50°N in Fig. 1a). The anticyclonic anomaly modulates this latitudinal geopotential height gradient, weakening (strengthening) the gradient in the southern (northern) part of the anticyclonic anomaly, leading to a decrease (increase) in the westerly jet; similarly, the meridional wind is decreased (increased) in the eastern (western) part of the anticyclone anomaly. These reductions in the zonal and meridional winds are observed in not only the upper troposphere (Fig. 1b) but also the middle troposphere (Fig. 1c). As the large-scale winds in the middle to upper troposphere generally play an important role in steering TCs, the slowdown of TC translation speeds is attributed to the slowdown of the zonal and meridional winds. Indeed, when the TC translation speeds are compared between P1 and P2 at each point on the 1° by 1° latitude–longitude grid (see Fig. 2), the area where the TC translation speed decreases corresponds well to the area where the zonal and meridional winds decrease.


The westerly jet is weakened in July and exhibits a clear northward shift in October (see Fig. 3). However, the zonal and meridional winds in the middle to upper troposphere experience the most notable slowdown in September. Further discussions as to why the slowdown is most notably seen in September will be presented in Section 4.1.
3.3 Influence of the Pacific Decadal Oscillation
The black line in Fig. 4 represents the time series of the magnitude of the mean wind vector at 500 hPa over 25–35°N and 120–140°E (see the dashed red box in Fig. 1c) during September from 1980 to 2019. The mean wind vector at 500 hPa can be considered a proxy for the strength of the environmental steering flows of TCs in this region. Evidently, the steering flows over this domain were relatively weak from 1999 to 2013 (see yellow shading of Fig. 4).

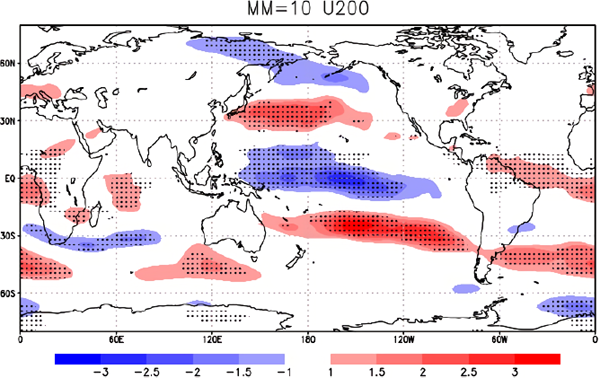
Various factors modulate the characteristics of TCs in the WNP at various time scales. The Pacific Decadal Oscillation (PDO, Mantua et al. 1997) is one such external forcing and is considered to be responsible for the interdecadal variabilities of TCs (e.g., Liu and Chan 2008; Chan 2015; Li and Zhou 2018; Liu et al. 2019). Figure 5a shows zonal wind speed anomalies at 200 hPa in September regressed on the annual mean PDO index1 over a period from 1958 to 2019. The PDO index has positive regression coefficients with the zonal wind in and around Japan, which means the westerly jet becomes stronger (weaker) when the PDO index is positive (negative). Thus, it can be inferred that the translation speed of TCs in and around Japan becomes faster (slower) than normal when the PDO is in a positive (negative) phase.

With regard to the 40 years evaluated in this study, two significant changes in the PDO phase are observed. The first is the shift from a positive to a negative PDO phase from 1997 to 1999, and the second is the shift from a negative to a positive PDO phase from 2013 to 2014 (see the red line in Fig. 4). The period during which the steering flows are weak corresponds well to the period between these two significant PDO phase change events, that is, when the PDO index is almost negative. These changes in the wind speed and their relationship with natural decadal climate variabilities suggest that the PDO plays a considerable role in the reduction in TC translation speeds described in Table 1 and Fig. 2.
3.4 Analyzing historical model simulations with and without global warming
As argued in previous studies, global warming might also play a role in the slowdown of TC translation speeds. To evaluate the contributions of the PDO and global warming separately, we analyze large ensemble historical model simulations with and without observational global warming trends from the pre-industrial level (Mizuta et al. 2017; Yoshida et al. 2017). The simulations with (without) warming trends are hereafter referred to as CTL (NGW), and the PDO positive (negative) phase during 1980–1998 (1999–2013) is referred to as PDO+ (PDO−). Please note that the observed SST is used in both model simulations and thus the PDO signal certainly exists in the simulations.
Figure 6a shows the difference in the geopotential height at 200 hPa in September between PDO+ and PDO− (PDO− minus POD+) by the 100-member ensemble mean of NGW. An anticyclonic anomaly is detected over western Japan, which means that the westerly jet can be weakened in the absence of global warming. The anticyclonic anomaly is also seen in the 100-member ensemble mean of CTL (Fig. 6b); this finding can be interpreted as a result of the combination of the PDO and global warming during the period from PDO+ to PDO− (i.e., from 1980 to 2013).

The magnitude of the mean wind vector at 500 hPa over 25–35°N and 120–140°E (see the dashed red box in Fig. 1c) during September of PDO+ and PDO− is reduced from 9.16 m s−1 to 8.56 m s−1 in NGW and from 8.75 m s−1 to 8.05 m s−1 in CTL. Consequently, in NGW, the PDO effectively reduces the wind speed by 0.60 m s−1 on average, whereas the reduction in the corresponding wind speed in CTL is 0.70 m s−1 (see Fig. 7). These results indicate that both the PDO and global warming influence the slowdown of the TC translation speed; in particular, the effect of the PDO is relatively large. Although the reduction in the wind speed exhibits variability (see Fig. 8), it is unlikely that global warming alone over the last 40 years caused the slowdown of the TC translation speed described in Table 1 and illustrated in Fig. 2.


The above conclusion does not suggest that global warming has not played a significant role in the TC translation speed slowdown. Figures 6c and d depict the difference in the geopotential height at 200 hPa in September between NGW and CTL (CTL minus NGW) during the PDO+ and PDO− periods, respectively. These plots show the influence of global warming from the pre-industrial level. The anticyclonic anomaly over western Japan is a notable feature during the periods of both PDO+ and PDO−. The magnitude of the mean wind vector at 500 hPa in September over the same domain as before is reduced from 9.16 m s−1 to 8.75 m s−1 in the PDO+ period and from 8.56 m s−1 to 8.05 m s−1 in the PDO− period. These reductions indicate that global warming from the pre-industrial level also played a significant role in diminishing the TC steering flows. In other words, global warming from the pre-industrial level might have already reduced the steering flows with the same level of influence as the PDO in recent years (see Fig. 7).
3.5 Future projections
Model simulations are conducted not only for the current climate but also for the future climate (over the period 2051–2110) assuming a 4 K warming of the surface from the pre-industrial level. Comparisons of the simulation results between the current (CTL) and future climates reflect the future variations in the steering flows. The magnitude of the mean wind vector at 500 hPa in September over the same domain (the dashed red box in Fig. 1c) is reduced from 8.05 m s−1 for the PDO− period in CTL to 6.45 m s−1 for the entire 60-year period in the future climate simulation. Although previous studies showed large uncertainties in future projections of TC translation speeds (Knutson et al. 2013; Kim et al. 2014; Gutmann et al. 2018), these results indicate that the September TC translation speeds will be significantly reduced in a future warmer climate. Such a substantial decrease in wind speed is also discovered in October (see Fig. 9). Thus, the translation speeds of TCs over Japan, the East China Sea, and their surrounding areas are expected to weaken significantly throughout autumn in the future warmer climate.

4. Discussion
4.1 Why is the slowdown most notably seen in September?
As mentioned in Introduction, a detailed study of the changes in TC characteristics over time and space is very important from climate change adaptation and mitigation perspectives, as they may differ both temporally and spatially. Indeed, we have examined the slowdown of the TC translation speed each month and at each location and confirmed that the slowdown is most notably seen in the mid-latitudes in September (not shown).
First of all, as shown in Figs. 5a and 7 of Yamaguchi and Maeda (2020), the westerly jet over and around Japan is largely modulated by PDO. One possible reason why the TC translation speed slowdown is most notably seen in September is that September is a month when the season progresses from summer to autumn, and the westerly jet in the mid-latitudes changes significantly in intensity (e.g., Hirahara et al. 2012). When the westerlies are modulated by the PDO during such a month (Fig. 5a), the amount of changes in the westerlies can become larger, and consequently, the impact on the translation speed of TCs becomes greater. The intensity of the westerlies in the mid-latitudes changes significantly in October as well. However, the modulation of the westerlies by the PDO is less distinctive in and around Japan (Fig. 10) though reasons for this need further investigations. It is consistent with previous studies (e.g., Urabe and Maeda 2014) that the impact of SST anomalies on the atmospheric circulation varies from month to month. Indeed, the regression coefficient averaged over the red dashed box in Fig. 1c in September is 1.39 while it is 0.92 in October.
As shown in Fig. 9, the significant slowdown of the translation speeds of TCs is seen not only in September but also in October in the future. This is due to that fact that the impact of global warming is much larger than the modulation by PDO in a future climate with a 4 K warming from the pre-industrial level.
4.2 Anticyclonic anomaly in the westerly jet over western Japan
Why do both PDO and global warming induce similar anticyclonic circulation anomalies over western Japan? First of all, El Niño and global warming are both characterized by warming in the tropical upper troposphere, but the latitudinal changes of the Hadley cell edge and mid-latitudes eddy-driven jet are opposite in sign (Lu et al. 2008; Sun et al. 2013). This means that a negative PDO and global warming have one thing in common in that they cause tropical expansion. As shown in Fig. 5a, the westerly jet shifts equatorward (poleward) during a PDO positive (negative) phase, which has SST patterns similar to El Niño (La Niña). When looking at geopotential height anomalies at 200 hPa (m) regressed on the annual mean PDO index (Fig. 5b), we can see a similar pattern shown in Figs. 1a and 6, but with an opposite sign. Thus, the positive anomalies in the geopotential height fields are associated with the poleward shift of the westerly jet.
With regard to global warming, various previous studies have shown that it causes the tropics to expand and the westerlies to move poleward (e.g., Barnes and Polvani 2013; Lucas et al. 2014; Tan et al. 2019). However, the poleward shift of the westerly jet is not uniform in the longitudinal direction (Simpson et al. 2014), and depending on the season and region, it may shift equatorward (Hirahara et al. 2012). It remains to be seen why the anticyclonic anomaly in the westerly jet is so pronounced over western Japan in September, and we will investigate this in a future study with numerical simulations with/without land effects. Of particular interest is summertime land-sea thermal contrast over East Asia, which has become large in a historical period and is expected to become larger in a future warmer climate (Kamae et al. 2014a, b). According to Kamae et al. (2014a, b), such a land-sea thermal contrast induces anticyclonic anomalies over western Japan and thus modulates atmospheric circulation over Eastern Asia.
4.3 Various SST warming patters in the future
For the future projections, six different SST warming patterns obtained from the Coupled Model Intercomparison Project (CMIP5) climate models are used (Mizuta et al. 2017). Thus, we can estimate the strength of the steering flows in the future for each SST pattern. The CMIP5 models used for obtaining SST changes are the Community Climate System Model, version 4 (CCSM4), the Geophysical Fluid Dynamics Laboratory Climate Model, version 3 (GFDL-CM3), the Hadley Centre Global Environment Model, version 2 - Atmosphere and Ocean (HadGEM2-AO), the Model for Interdisciplinary Research on Climate, version 5 (MIROC5), the Max Planck Institute Earth System Model, medium resolution (MPI-ESM-MR), the Meteorological Research Institute Coupled Atmosphere-Ocean General Circulation Model, version 3 (MRI-CGCM3). Table 2 shows the strength of the steering flows in the future for each SST pattern. It is defined as the magnitude of the mean wind vector at 500 hPa over 25–35°N and 120–140°E (see the dashed red box in Fig. 1c) as used in Figs. 4, 7, and 9.

The slowdown of the steering flows is more apparently seen in GFDL-CM3 and MIROC5. On the other hand, it is mitigated in CCSM4. Figure 11 shows the SST anomalies among the six different models. Figure 12 shows the SST anomalies regressed onto the steering flow slowdown anomalies among the six different models. As the figures show, the steering flows tend to be faster (slower) when the SST around and the east of Japan is colder (warmer). However, further investigations are needed whether the colder (warmer) SST is the cause or the result of the faster (slower) steering flows, which are associated with the latitudinal shift of the westerly jet. Another feature is that the slowdown of the steering flows is more clearly seen in the PDO negative phase than in the PDO positive phase as expected in Results.
5. Summary
In this study, we investigated whether the translation speed of TCs has slowed in the WNP basin during a post-geostationary satellite era from 1980–2019. Analyses of observational data and atmospheric reanalysis products revealed that the TC translation speed has significantly diminished over Japan, the East China Sea, and their surrounding areas in September over the last 40 years. This slowdown has been caused by weakening of the steering flows of TCs; in particular, the anticyclonic anomaly in the westerly jet over western Japan plays a significant role. Moreover, we investigated the relationship between PDO and changes in the synoptic environment and analyze historical model simulations with and without observational global warming trends. We found that the reduction in steering flows has been largely attributable to the PDO but has also been affected by global warming over the 40 years. Additionally, considering the effect of global warming from the pre-industrial level rather than only the past 40 years verified in this study, global warming appears to play a significant role in the observed reduction in steering flows. Furthermore, model simulations for a future warmer climate assuming a 4 K warming of the surface from the pre-industrial level indicate further reductions in steering flows, leading to TCs that translate more slowly during the autumn season in the future.
One important message ascertained from the results of this study is that both the natural climate decadal variabilities and global warming make the TC translation speed slower, but the effects are not uniform in time and space. This is an important message to disaster preparedness communities. Also the findings of this study imply that, with the synergistic effects of increase in the rain rate associated with TCs and decrease in TC translation speeds, the accumulated precipitation at a given location will significantly increase in autumn in the future.
To the best of authors' knowledge, no similar studies have been found in terms of investigating the changes in the TC translation speed in fine detail over time and space and quantitatively evaluating their causes from both global warming and internal climate variability perspectives using model simulations. Meanwhile, it is true that this study is a result of model simulations by one numerical model only. It is of great importance to assess the robustness of the outcomes of this research using data from other model simulation results such as CIMIP6 in the future.
Acknowledgments
The Earth Simulator supercomputer was used in this study as a “Strategic Project with Special Support” of JAMSTEC. The study was also supported by the Integrated Research Program for Advancing Climate Models (TOUGOU) and Data Integration and Analysis System (DIAS), both of which are sponsored by the Ministry of Education, Culture, Sports, Science and Technology of Japan (JPMXD0717935457, JPMXD 0717935561).
Footnotes
The PDO index is retrieved from the Tokyo Climate Center, WMO Regional Climate Center in RA II https://ds.data.jma.go.jp/tcc/tcc/products/elnino/decadal/pdo.html.
References
- Altman, J., J. Doležal, T. Černý, and J.-S. Song, 2013: Forest response to increasing typhoon activity on the Korean Peninsula: Evidence from oak tree-rings. Global Change Biology, 19, 498-504.
- Barnes, E. A., and L. Polvani, 2013: Response of the mid-latitude jets, and of their variability, to increased greenhouse gases in the CMIP5 models. J. Climate, 26, 7117-7135.
- Camargo, S. J., 2013: Global and regional aspects of tropical cyclone activity in the CMIP5 models. J. Climate, 26, 9880-9902.
- Chan, J. C. L., 2015: Observed variations of western North Pacific tropical cyclone activity on decadal time scales and longer. Climate Change: Multidecadal and Beyond. Chang, C.-P., M. Ghil, M. Latif, and J. M. Wallace (eds.), World Scientific Series on Asia-Pacific Weather and Climate, vol. 6, World Scientific, 303-313.
- Chan, K. T. F., 2019: Are global tropical cyclones moving slower in a warming climate? Environ. Res. Lett., 14, 104015, doi:10.1088/1748-9326/ab4031.
- Emanuel, K., 2017: Assessing the present and future probability of Hurricane Harvey's rainfall. Proc. Natl Acad. Sci. U.S.A., 114, 12681-12684.
- Gutmann, E. D., R. M. Rasmussen, C. Liu, K. Ikeda, C. L. Bruyere, J. M. Done, L. Garrè, P. Friis-Hansen, and V. Veldore, 2018: Changes in hurricanes from a 13-yr convection-permitting pseudo-global warming simulation. J. Climate, 31, 3643-3657.
- Hirahara, S., H. Ohno, Y. Oikawa, and S. Maeda, 2012: Strengthening of the southern side of the jet stream and delayed withdrawal of Baiu season in future climate. J. Meteor. Soc. Japan, 90, 663-671.
- Hirahara, S., M. Ishii, and Y. Fukuda, 2014: Centennial-scale sea surface temperature analysis and its uncertainty. J. Climate, 27, 57-75.
- Imada, Y., S. Maeda, M. Watanabe, H. Shiogama, R. Mizuta, M. Ishii, and M. Kimoto, 2017: Recent enhanced seasonal temperature contrast in Japan from large ensemble high-resolution climate simulations. Atmosphere, 8, 57, doi:10.3390/atmos8030057.
- Kamae, Y., M. Watanabe, M. Kimoto, and H. Shiogama, 2014a: Summertime land-sea thermal contrast and atmospheric circulation over East Asia in a warming climate–Part I: Past changes and future projections. Climate Dyn., 43, 2553-2568.
- Kamae, Y., M. Watanabe, M. Kimoto, and H. Shiogama, 2014b: Summertime land-sea thermal contrast and atmospheric circulation over East Asia in a warming climate–Part II: Importance of CO2-induced continental warming. Climate Dyn., 43, 2569-2583.
- Kim, J.-H., C.-H. Ho, M.-H. Lee, J.-H. Jeong, and D. Chen, 2006: Large increase in heavy rainfall associated with tropical cyclone landfalls in Korea after the late 1970s. Geophys. Res. Lett., 33, L18706, doi:10.1029/2006GL027430.
- Kim, H.-S., G. A. Vecchi, T. R. Knutson, W. G. Anderson, T. L. Delworth, A. Rosati, F. Zeng, and M. Zhao, 2014: Tropical cyclone simulation and response to CO2 doubling in the GFDL CM2.5 high-resolution coupled climate model. J. Climate, 27, 8034-8054.
- Knutson, T. R., J. J. Sirutis, G. A. Vecchi, S. Garner, M. Zhao, H.-S. Kim, M. Bender, R. E. Tuleya, I. M. Held, and G. Villarin, 2013: Dynamical downscaling projections of late 21st century Atlantic hurricane activity: CMIP3 and CMIP5 model-based scenarios. J. Climate, 26, 6591-6617.
- Knutson, T., S. J. Camargo, J. C. L. Chan, K. Emanuel, C.-H. Ho, J. Kossin, M. Mohapatra, M. Satoh, M. Sugi, K. Walsh, and L. Wu 2019: Tropical cyclones and climate change assessment: Part I: Detection and attribution. Bull. Amer. Meteor. Soc., 100, 1987-2007.
- Knutson, T., S. J. Camargo, J. C. L. Chan, K. Emanuel, C.-H. Ho, J. Kossin, M. Mohapatra, M. Satoh, M. Sugi, K. Walsh, and L. Wu, 2020: Tropical cyclones and climate change assessment: Part II: Projected response to anthropogenic warming. Bull. Amer. Meteor. Soc., 101, E303-E322.
- Kobayashi, S., Y. Ota, Y. Harada, A. Ebita, M. Moriya, H. Onoda, K. Onogi, H. Kamahori, C. Kobayashi, H. Endo, K. Miyaoka, and K. Takahashi, 2015: The JRA-55 reanalysis: General specifications and basic characteristics. J. Meteor. Soc. Japan, 93, 5-48.
- Kossin, J. P., 2018a: A global slowdown of tropical-cyclone translation speed. Nature, 558, 104-107.
- Kossin, J. P., 2018b: Author correction: A global slowdown of tropical-cyclone translation speed. Nature, 564, E11-E16.
- Lanzante, J. R., 2019: Uncertainties in tropical-cyclone translation speed. Nature, 570, E6-E15.
- Li, R. C. Y., and W. Zhou, 2018: Revisiting the intraseasonal, interannual, and interdecadal variability of tropical cyclones in the western North Pacific. Atmos. Oceanic Sci. Lett., 11, 198-208.
- Liu, K. S., and J. C. L. Chan, 2008: Interdecadal variability of western North Pacific tropical cyclone tracks. J. Climate, 21, 4464-4476.
- Liu, C., W. Zhang, X. Geng, M. F. Stuecker, and F.-F. Jin, 2019: Modulation of tropical cyclones in the southeastern part of western North Pacific by tropical Pacific decadal variability. Climate Dyn., 53, 4475-4488.
- Lu, J., G. Chen, and D. M. W. Frierson, 2008: Response of the zonal mean atmospheric circulation to El Niño versus global warming. J. Climate, 21, 5835-5851.
- Lucas, C., B. Timbal, and H. Nguyen, 2014: The expanding tropics: A critical assessment of the observational and modeling studies. WIREs Climate Change, 5, 89-112.
- Mantua, N. J., S. R. Hare, Y. Zhang, J. M. Wallace, and R. C. Francis, 1997: A Pacific interdecadal climate oscillation with impacts on Salmon production. Bull. Amer. Meteor. Soc., 78, 1069-1080.
- Mizuta, R., H. Yoshimura, H. Murakami, M. Matsueda, H. Endo, T. Ose, K. Kamiguchi, M. Hosaka, M. Sugi, S. Yukimoto, S. Kusunoki, and A. Kitoh, 2012: Climate simulations using MRI-AGCM3.2 with 20-km grid. J. Meteor. Soc. Japan, 90A, 233-258.
- Mizuta, R., A. Murata, M. Ishii, H. Shiogama, K. Hibino, N. Mori, O. Arakawa, Y. Imada, K. Yoshida, T. Aoyagi, H. Kawase, M. Mori, Y. Okada, T. Shimura, T. Nagatomo, M. Ikeda, H. Endo, M. Nosaka, M. Arai, C. Takahashi, K. Tanaka, T. Takemi, Y. Tachikawa, K. Temur, Y. Kamae, M. Watanabe, H. Sasaki, A. Kitoh, I. Takayabu, E. Nakakita, and M. Kimoto, 2017: Over 5,000 years of ensemble future climate simulations by 60-km global and 20-km regional atmospheric models. Bull. Amer. Meteor. Soc., 98, 1383-1398.
- Moon, I.-J., S.-H. Kim, and J. C. L. Chan, 2019: Climate change and tropical cyclone trend. Nature, 570, E3-E5.
- Normile, D., 2019: Deadly typhoon forces Japan to face its vulnerability to increasingly powerful storms. Science, doi:10.1126/science.aaz9495.
- Simpson, I. R., T. A. Shaw, and R. Seager, 2014: A diagnosis of the seasonally and longitudinally varying midlatitude circulation response to global warming. J. Atmos. Sci., 71, 2489-2515.
- Schreck III, C. J., K. R. Knapp, and J. P. Kossin, 2014: The impact of best track discrepancies on global tropical cyclone climatologies using IBTrACS. Mon. Wea. Rev., 142, 3881-3899.
- Sun, L., G. Chen, and J. Lu, 2013: Sensitivities and mechanisms of the zonal mean atmospheric circulation response to tropical warming. J. Atmos. Sci., 70, 2487-2504.
- Tan, Z., O. Lachmy, and T. A. Shaw, 2019: The sensitivity of the jet stream response to climate change to radiative assumptions. J. Adv. Model. Earth Syst., 11, 934-956.
- Urabe, Y., and S. Maeda, 2014: The relationship between Japan's recent temperature and decadal variability. SOLA, 10, 176-179.
- van Oldenborgh, G. J., K. van der Wiel, A. Sebastian, R. Singh, J. Arrighi, F. Otto, K. Haustein, S. Li, G. Vecchi, and H. Cullen, 2017: Attribution of extreme rainfall from Hurricane Harvey, August 2017. Environ. Res. Lett., 12, 124009, doi:10.1088/1748-9326/aa9ef2.
- Yamaguchi, M., and S. Maeda, 2020: Increase in the number of tropical cyclones approaching Tokyo since 1980. J. Meteor. Soc. Japan, 98, 775-786.
- Yamaguchi, M., J. C. L. Chan, I.-J. Moon, K. Yoshida, and R. Mizuta, 2020: Global warming changes tropical cyclone translation speed. Nat. Commun., 11, 47, doi:10.1038/s41467-019-13902-y.
- Yoshida, K., M. Sugi, R. Mizuta, H. Murakami, and M. Ishii, 2017: Future changes in tropical cyclone activity in high-resolution large-ensemble simulations. Geophys. Res. Lett., 44, 9910-9917.
- Zhang, D., H. Zhang, J. Zheng, X. Cheng, D. Tian, and D. Chen, 2020: Changes in tropical-cyclone translation speed over the western North Pacific. Atmosphere, 11, 93, doi:10.3390/atmos11010093.
- Zhang, G., H. Murakami, T. R. Knutson, R. Mizuta, and K. Yoshida, 2020: Tropical cyclone motion in a changing climate. Sci. Adv., 6, eaaz7610, doi:10.1126/sciadv.aaz7610.


