Articles
Impacts of an Upper-Level Easterly Wave on the Sudden Track Change of Typhoon Megi (2010)
2020 Volume 98 Issue 6 Pages 1335-1352

Details
2020 Volume 98 Issue 6 Pages 1335-1352
In this study, the Advanced Weather Research and Forecasting (WRF-ARW) model is used to investigate possible influences of a predominantly upper-level easterly wave (EW) on Typhoon Megi's (2010) sharp northward turn on 20 October, 2010 after passing over the Philippines. Observational analysis indicates that an upper-level EW with a cold-cored structure was located to the east of Megi. This EW moved westward along with Megi and modified the large-scale environmental flow around the typhoon, thus affecting its movement. In a control experiment, the sharp northward turn that was observed was captured well by a simulation. The retreat of the subtropical high contributed directly to the poleward steering flow for Megi. Sensitivity experiments were conducted by filtering out the synoptic-scale (3–8-day) signals associated with EWs. In the absence of the upper-level EW, the simulation showed that Megi would not have made a sharp northward turn. Two mechanisms are proposed regarding the impact of the easterly wave on Megi. First, an upper-level EW may have impacted the environmental flows, allowing Megi to move at a slower westward speed so that it entered the eastern semicircle of the nearby monsoon gyre where an enhanced southerly steering flow then led to the typhoon making a sharp northward turn. Second, the diabatic heating and associated cyclonic vorticity induced by the middle-level (around 400 hPa) convergence may have eroded the western flank of the subtropical high in the western North Pacific, causing an eastward retreat of the high-pressure system. The present modeling approach provides a reasonable assessment of the contribution of upper-level wave disturbances to sudden changes in tropical cyclones.
Tropical cyclone (TC) tracks are largely determined by interactions between the environmental flow and storm-scale circulations and correspond well with the steering flow (Kasahara 1957; Chan and Gray 1982; Holland 1983; Chan 1985; Harr and Elsberry 1991). The forecasting of TC tracks has made substantial progress in the last few decades (DeMaria and Gross 2003) due to improvements in numerical prediction models, advances in satellite retrievals, and new data-assimilation strategies. Nevertheless, numerical models occasionally have very large forecast track errors, especially in complex environmental flows. A good example is Typhoon Megi, the most powerful and long-lived TC over the western North Pacific (WNP) in 2010. After crossing Luzon Island and moving into the South China Sea, Megi experienced a sharp northward turn. Studies have suggested that Megi's sharp turn was to some extent a consequence of its earlier movement and also that this turn was affected by the typhoon's size and structure (Qian et al. 2013), related to the strength and extent of the western Pacific subtropical high (Sun et al. 2015a), or influenced by an approaching eastward-moving mid-latitude trough (Kieu et al. 2012; Shi et al. 2014).
It has been well recongnized that TCs can experience sudden track changes resulting from interactions with a nearby monsoon gyre (MG) (Carr and Elsberry 1995; Liang et al. 2011; Yan et al. 2017; Lander 1994; Harr et al. 1996; Bi et al. 2015; Molinari and Vollaro 2017). It has been proposed that, during the coalescence of a TC and the MG, Rossby wave energy dispersion enhances the southwesterly winds in the southeast quadrant of the TC. This enhanced southwesterly flow acts as an additional steering flow for the cyclone, leading to a sharp northward turn. The sharp turn of Megi has been ascribed to the multi-timescale interactions between the TC, a low-frequency MG, and synoptic-scale motion (Bi et al. 2015; Liang and Wu 2015; Ge et al. 2018).
The studies cited above examined the influence of middle to low-level low-frequency systems and mid-latitude circulations on Megi's sudden track change. Interactions between TCs and other upper-level tropical systems, such as the tropical upper tropospheric trough (TUTT; Patla et al. 2009), also cannot be ruled out. Misrepresentation of these upper-level atmospheric features (i.e., the TUTT cells) near TCs accounts for a considerable portion of TC track forecast errors (Carr and Elsberry 2000a, b; Kehoe et al. 2007).
The study by Ma (2018) indicated that during the lifetime of Megi, an upper-level westward-propagating synoptic-scale wave (termed an easterly wave (EW) hereafter) with a pronounced cold-cored structure moved along the southern flank of the WNP subtropical high. This EW weakened the cyclonic circulation on the southern flank of Megi, resulting in the enhancement of the southerly wind on the southern flank of the typhoon. However, which mechanisms explain how the EW impacted the sudden poleward movement of Megi remains unclear—this is the focus of this study.
The structure of this paper is organized as follows. In Section 2, the overall evolution of Megi and the EW are presented. The model used for the simulation of Megi and the design of the sensitivity experiments are presented in Section 3. The simulated results are discussed in Section 4, and the possible mechanisms contributing to Megi's sharp turn are presented in Section 5. Finally, a summary and discussion are given in Section 6.
Megi (2010) formed on 0000 UTC 13 October, 2010 over the WNP as a tropical depression to the east of the Philippines. The storm strengthened as it moved northwestward over the next 3 days and became a super typhoon at 1200 UTC 16 October with a central minimum pressure of 941 hPa and maximum wind speed of 58 m s−1. The intensity gradually weakened as it crossed the northern Philippines and entered the South China Sea. At around 0000 UTC 20 October, Megi suddenly turned almost 90° to the right and headed due north (Fig. 1.
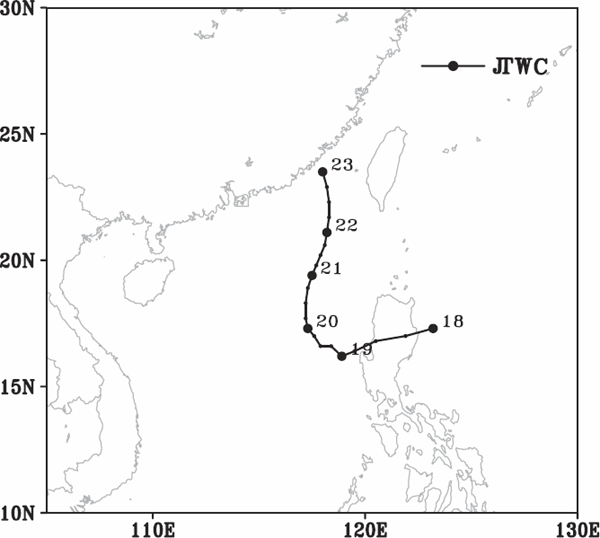
The JTWC best track for Typhoon Megi from 18 to 23 October 2010.
During the period from 18 to 23 October, there existed a significant synoptic-scale EW east of Megi in the upper troposphere. Figure 2 displays the time evolution of the 200-hPa wind and vorticity, as retrieved from the 6-hourly National Centers for Environmental Prediction Final Operational Global Analysis (NCEP FNL) reanalysis dataset which has a grid resolution of 1° × 1°. On 20 October, Megi was located east of the Philippine islands. To its east side, there existed a wave-like pattern with alternating anticyclonic and cyclonic circulation. A large outflow over the center of Megi could be identified. The wave moved faster than Megi, and the distance between the cyclonic center of the wave and Megi reduced with time. Figure 3 is vertical cross-section across the center of the storm, showing the evolution of the EW and Megi. The maximum EW wind occurred at 200 hPa, and Megi also vertically extended to 200 hPa. Figure 4a shows a vertical–longitude cross-section of the meridional wind component along the EW on 18 October. The cross-section indicates that the EW had a deeper vertical structure that penetrated vertically downward to about 700 hPa. The storm had a clear, cold-cored structure with the minimum temperature anomaly centered at around 400 hPa, which agrees well with Estoque and Lin (1977). To further demonstrate the evolution of the EW, Fig. 4b displays a time-longitude cross-section of the meridional wind component along 18°N at 200 hPa. The EW moved westward with a zonal speed of about −5.3 m s−1, which is faster than Megi's zonal propagation speed, as will be shown later. It is speculated that a potential interaction existed between Megi and the EW as they became closer. This study focused on investigating this possibility and the mechanisms behind it.
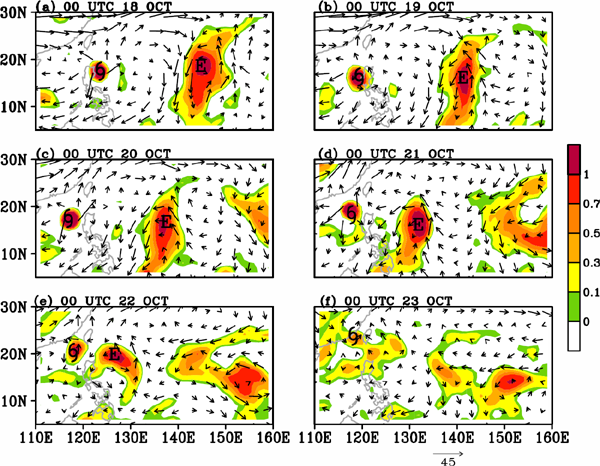
The time evolution of the 200-hPa circulation (vectors) and relative vorticity (shaded; units: 1 × 10⁻⁶ s−1). The hurricane symbol represents the position of Megi near the surface, and “E” represents the cyclonic vortex center of the easterly wave at 200 hPa.
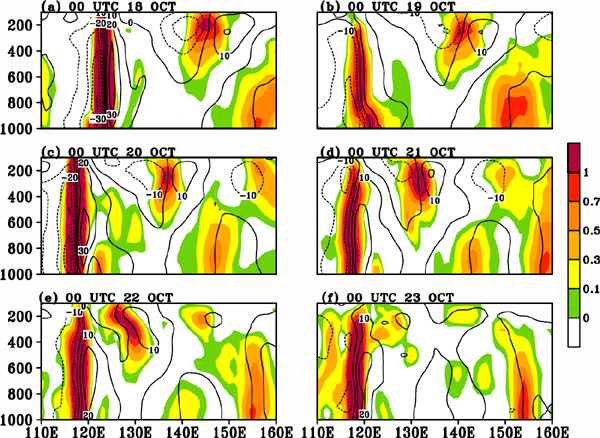
The time evolution of the vertical cross-section of the meridional wind (contours in m s−1) and relative vorticity (shaded; units:1 × 10⁻⁶ s−1) across the center of Megi.
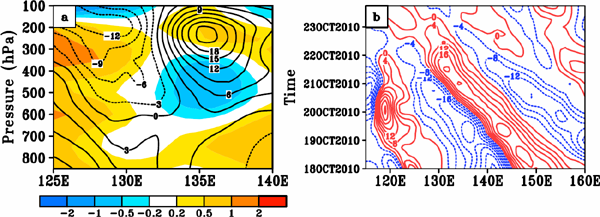
(a) The vertical-longitude cross-section of the meridional wind of the easterly vortex (black contours in m s−1) and the temperature anomaly (shaded; units: K) on 18 October; (b) the time-longitude cross-section of the meridional wind component (m s−1) at 200 hPa from 18 to 23 October 2010 along 18°N.
The Advanced Research Weather Research and Forecasting (WRF-ARW) model version 3.9.1 (Davis et al. 2008) was used to conduct numerical simulations. A single domain with a horizontal resolution of 18 km was configured. The domain covered the region 90–155°E and 5°S–40°N. The model physics included a microphysics scheme (Lin et al. 1983) and a Kain–Fritsch convective scheme (Kain and Fritsch 1993). For the radiation process, Dudhia shortwave radiation (Dudhia 1989) and a Rapid Radiation Transfer Model (RRTM) longwave radiation parameterization scheme (Mlawer et al. 1997) were used. The initial and boundary conditions were obtained from the NCEP FNL reanalysis dataset. The initial time was 0000 UTC 18 October 2010. The model integration lasted for five days. To investigate the impacts of horizontal resolution on the TC track prediction, a pair of experiments with finer resolution were conducted. Specifically, triply-nested domains with horizontal resolutions of 18, 6, and 2 km were used. The simulated track changes were identical to those for the coarse resolution (not shown), indicating that the results were not sensitive to the horizontal resolution used in the model.
In the control experiment (CTL), we simulated the sharp northward turn of Megi. Three additional sensitivity experiments were conducted to examine the possible impacts of the upper-level synoptic-scale signal on Megi; as shown in Fig. 2, this signal was dominated by the EW. This is different to the experiment by Bi et al. (2015) in which the focus was on the influences of the 10–60-day low-frequency components. The NCEP FNL dataset was used for the extraction of the 3–8-day high-frequency components using the Lanczos filtering technique (Duchon 1979). In the sensitivity experiments, the initial and updated boundary fields were modified. More specifically, the 3–8-day components of the dynamic variables (horizontal winds) and thermodynamic variables (air temperature, geopotential height, specific humidity, and surface pressure field) were removed. In the first sensitivity experiment, the high-frequency components at all vertical levels in the region east of 125°E were removed so that the overall impacts of all of these variables could be examined (ALL). In the second sensitivity experiment (UP), the 3–8-day signals were removed for levels above 500 hPa only (see Fig. 3a). The purpose of this sensitivity experiment was to isolate the impacts of the upper tropospheric easterly wave (the dominant synoptic-scale component east of the storm). In the third sensitivity experiment (DOWN), the 3–8-day signals were removed below 500 hPa and the upper-level EWs retained. The modification of the flow was confined to east of 125°E to eliminate the westward-propagating signals only and keep the other weather systems (i.e., the TC and mid-latitude westerly trough) intact. In our experiments, it was necessary to make sure that the time filtering was capable of preserving a consistent set of kinetic and thermodynamic fields for selected waves. This was done by comparing the filtered wind fields with those calculated from the filtered geopotential height based on the geostrophic balance equation. The difference was small, indicating that the time filtering mostly preserved the balance relation. The designs of the experiments are shown in Table 1.
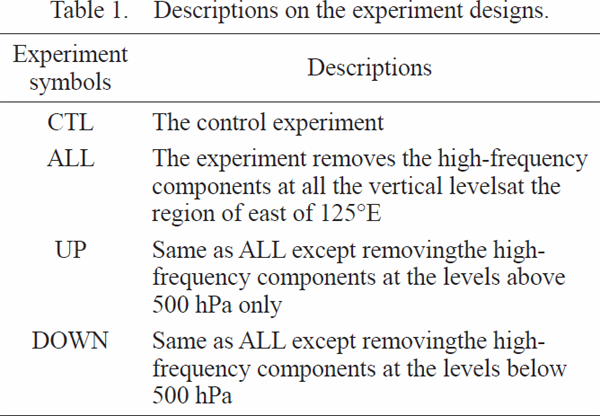
Figure 5 shows the simulated tracks and intensities for Megi obtained from all the experiments along with the observations. The TC center was determined by the location of the minimum sea-level pressure. The CTL experiment captured the overall movement of Megi reasonably well, especially the sharp northward turn that occurred around 20 October, although the experiment produced a slightly faster speed than was observed prior to landfall. Among the sensitivity experiments, the largest track difference was produced by ALL, which was when the 3–8-day signals at all levels were removed. In this case, the TC vortex exhibited a gradual northwestward propagation without a sharp turn. The track produced by UP was closer to that for ALL, which reflects the dominant role of the upper tropospheric features in influencing the movement of Megi. In DOWN, the storm track was only slightly different from that in CTL, indicating that the lower-level part of the easterly waves played a minor role in influencing Megi. In terms of the intensity, prior to the sharp northward turn, the TC intensities were similar for both CTL and ALL. This indicates that the track was not very sensitive to the intensity. After the turn, the simulated storm in CTL was stronger than the storm in ALL.
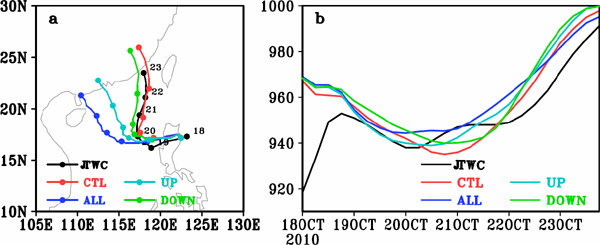
(a) The observed and simulated tracks and (b) the intensity of Megi from 18 to 23 October 2010.
Overall, the differences between CTL and the sensitivity experiments indicate a substantial influence of the upper-level EW on the movement of Megi. Namely, in CTL, the EW penetrated vertically downward to about 700 hPa (Fig. 4a), indicating a deeper vertical structure. However, when the EW was removed in ALL and UP, the TC did not experience a sharp turn. In the following, the diagnostics are focused on CTL and ALL, which exhibited the largest deviation from CTL. Bi et al. (2015) emphasized the important role of the low-frequency MG. In their experiments, Megi did not exhibit a sharp turn in the absence of MG. How the upper-level EW affected the track of Megi is described in the following.
During the first 48 hours of integration, there were marked differences in the zonal speeds between CTL and ALL (Fig. 6a). Specifically, the zonal speed, Cx, in CTL was initially negative (westward) and became positive (eastward) around the time of the sharp northward turn, consistent with the best track from the JTWC. In contrast, the zonal speed was negative during the whole period in ALL, indicating a persistent westward movement of the simulated Megi without a northward turn. The meridional moving speed, Cy, in CTL shows an acceleration before 20 October (Fig. 6b), indicating a sudden northward movement (Fig. 5a). Conversely, Cy in ALL was much smaller, corresponding to a slow northward propagation. Given the reasonably good model simulation in CTL, we used the outputs from CTL as a proxy for the atmosphere in subsequent analyses.
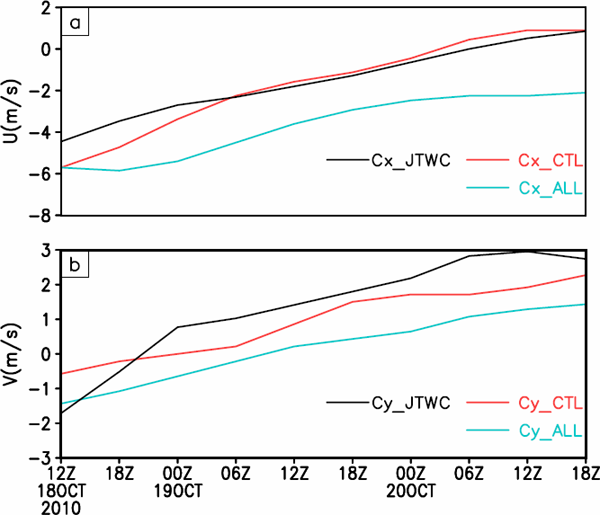
The (a) zonal and (b) meridional speeds (units: m s−1) from 18 to 20 October in CTL and ALL, together with the observed values.
It has been suggested that a sharp northward turn of a TC can be ascribed to its interaction with the nearby low-frequency MG in some cases (Bi et al. 2015; Liang and Wu 2015; Ge et al. 2018). As illustrated in Bi et al. (2015), a so-called special Fujiwhara effect (Fujiwhara 1921) may exist between the MG and TC in the same way that the traditional Fujiwhara effect can exist between two TCs (Yang et al. 2008). In the studies mentioned above, the tracks were displayed as the relative positions of the TC and the MG center. With the MG removed, Megi did not show a sharp northward turn. However, as long as a TC is moving within the eastern semicircle of the MG, it has the potential to experience a sudden northward turn (Liang and Wu 2015). To this end, we first extracted the center of the MG. A spatial filtering technique (Ge et al. 2018) was used to separate the MG and TC-scale circulation. To achieve this, the MG circulation was considered to be the component with a wavelength greater than 500 km, and the remaining component (wavelength shorter than 500 km) was the TC-scale circulation. Thereafter, the MG center was defined by the location of the maximum value of the relative vorticity in the filtered field. It is worth mentioning that this result did not depend on the method used (i.e., using the minimum sea-level pressure center). The left-hand panels of Fig. 7 display the positions of the TC and MG.
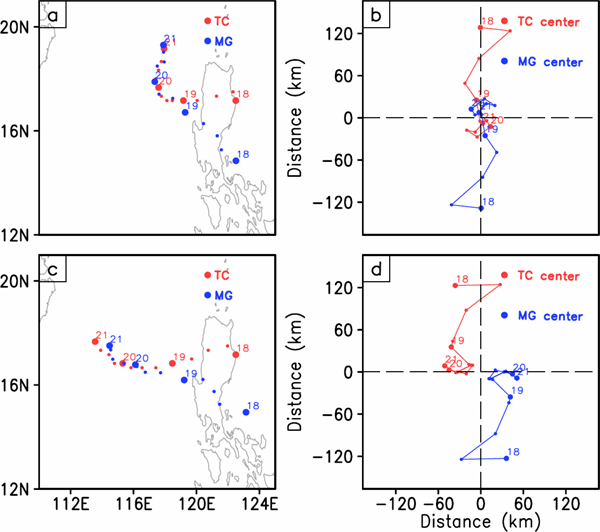
Left-hand panels: time evolution of the center positions (km) of both TC and MG from 18 to 21 October in (a) CTL and (c) ALL. The right-hand panels display the relative motion between TC and MG from 18 to 20 October in (b) CTL and (d) ALL.
Initially, Megi was located to the west of the MG center. With time, both the TC and MG propagated westward but with different zonal speeds. Both the TC and MG were located further to the east in CTL compared with ALL, indicating a slower speed in the latter; this is in agreement with the smaller Cx shown in Fig. 6a. Of particular interest is that, at the time of the sudden change (i.e., 20 October), the distance between the TC and the MG center in CTL was smaller than it was in ALL. In CTL, Megi was located to the east of the MG center, whereas was is located to the west of the MG center in ALL. In other words, Megi had a faster westward propagation speed in ALL and had moved into the western flank of the MG by 20 October. Consequently, the prevailing steering northerly wind for Megi in the MG environment did not support a sharp northward turn in ALL. On the other hand, when Megi moved with a slower speed relative to the MG, it was located in the eastern semicircle of the MG, where a southerly wind prevailed and supported northward motion. The results therefore agree well with those of previous studies (Liang and Wu 2015).
The markedly different results from these two simulations can also be seen from the relative positions of the TC and MG (Figs. 7b, d). The origin (0, 0) in these reference frames was defined as the midpoint between the centers of the two entities. Initially, the centers of the MG and TC were far apart, with the TC situated around the western flank of the MG. Thereafter, the TC moved cyclonically and approached the MG center. The two centers gradually attracted each other gradually and nearly coincided by the time of the sharp turn. These features are consistent with previous idealized simulations (Ge et al. 2018; Liang and Wu 2014) and the study of Megi by Bi et al (2015). Notice that these two systems rotate around and approach each other while remaining separated.
In short, the sensitivity experiments indicated the possibility that the Fujiwhara effect existed between Megi and the MG. The different effects can likely be ascribed to the different relative locations of Megi and MG, which are related to their speeds of movement. Namely, in CTL, Megi moved at a slower westward speed, and thus was situated on the eastern flank of the MG. As a result, Megi experienced a sudden sharp turn, which is consistent with previous idealized simulations (Ge et al. 2018; Liang and Wu 2014).
5.2 Potential vorticity tendencyGenerally, a TC moves in the direction of the maximum vorticity or potential vorticity (PV) tendency (Wu and Wang 2000). It is speculated that a different PV tendency will be produced when the location of the TC with respect to the MG is different. To this end, Fig. 8 depicts snapshots of the movement of the TC and the wavenumber-1 component of the PV tendency of the simulated TC in the CTL simulation from 19 to 20 October. Specifically, the maximum tendency was oriented toward the west at 0600 UTC 19 October and then turned northward at 1800 UTC 19 October. The direction of the TC movement corresponded well with the change in the maximum wavenumber-1 PV tendency. This differs from ALL, in which the maximum tendency was persistently oriented toward the northwest (not shown). Previous studies (Ge at al. 2018) have indicated that TC tracks are sensitive to the intensity and vertical structure of the nearby MG. As shown in Fig. 5b, the TC intensity was somehow stronger in CTL than in ALL at the time of the sharp turn. Furthermore, the MG generally had a slightly larger size and deeper vertical structure (not shown), which is in agreement with Ge et al. (2018). These results suggest that the asymmetric wavenumber-1 component of the PV tendency in the inner core of Megi differed for the four experiments and that this can reasonably account for the different track changes.
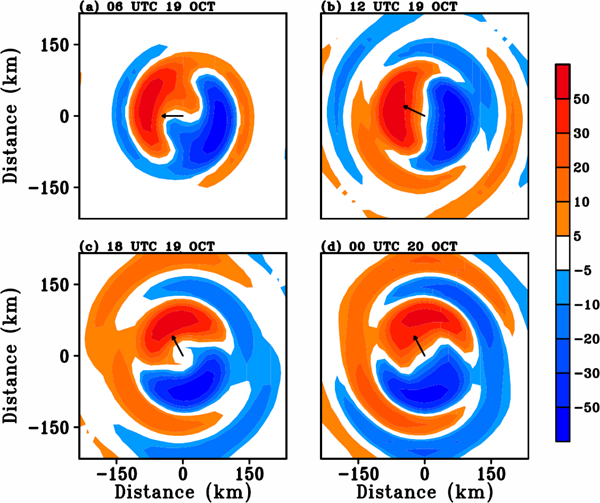
Time evolution of the simulated direction of movement of the TC and the wavenumber-1 component of the PV tendency (shaded) in CTL from 19 to 20 October, shown at 6-hourly intervals.
TC movement is largely determined by the environmental steering flows (George and Gray 1976, 1977; Chan and Gray 1982; Chan 1985). Some studies have indicated that the relationship between the actual TC movement and the vertically averaged steering flow from 850 hPa to 200 hPa is better than that in indivdual layers (Sanders et al. 1980; Dong and Neumann 1986). With this in mind, the vertical distributions of the steering flows in our four experiments were compared. The atmospheric flow with a wavelength greater than 500 km was considered to be the background, and the steering flow was obtained by taking the average of this within a radius of 500 km around the storm center in each layer (Fig. 9). In CTL (Fig. 9a), the environmental steering flows initially showed a consistent easterly at all vertical levels, indicating a westward propagation for Megi. The vertically averaged steering and the actual storm movement also indicated a westward propagation and they were fairly consistent with each other. Around 1200 UTC 19 October, the steering flows diminished significantly and then turned southwesterly by 0000 UTC 20 October, especially below 300 hPa. Thereafter, a dominant southerly wind appeared and the vertically averaged steering and the actual TC movement both indicated a northward propagation, which can reasonably explain the sudden track change at that time. In ALL (Fig. 9b), although initially there was stronger easterly steering, no significant westerly flow appeared during the period of 20–21 October. As a result, a sharp northward turn did not take place. Around 2000 UTC 20 October, the vertically averaged steering still indicated a westward propagation. The evolution feature in UP (Fig. 9c), where only the upper-level synoptic-scale flows had been removed, bore many similarities to the same feature in ALL. The evolution feature in DOWN (Fig. 9d), where only the low-level synoptic-scale flows had been removed, bore many similarities to the one in CTL, indicating that the low-level part of the EW had little impact on Megi's movement.
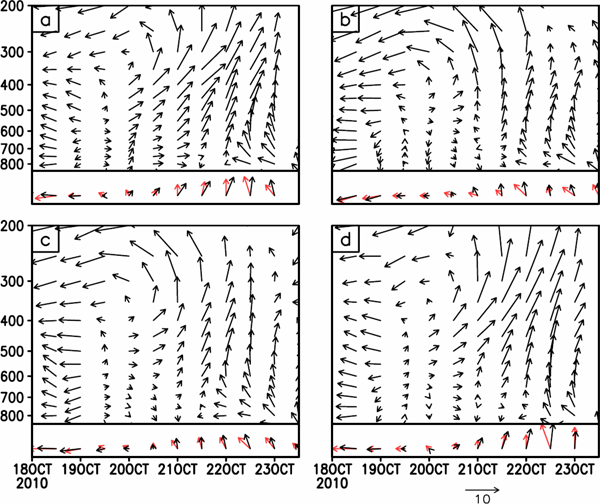
The time evolution of the vertical profiles of the steering flows (m s−1) (top of each panel) together with the vertically averaged steering (black vectors) and the actual TC movement (red vectors) (bottom of each panel) from 18 to 23 October in (a) CTL, (b) ALL, (c) UP, and (d) DOWN.
To account for the difference in the environmental flows with and without the EW, we computed the averaged vertical–longitude background zonal wind between 10°N and 20°N during the period 19–20 October (Fig. 10). For simplicity, we only focused on the comparison between CTL and ALL. Note that a prevailing easterly (westerly) wind appeared at the upper (lower) level with a transition layer at about 350 hPa in both simulations. In CTL, there was a strong westerly wind at lower levels and a much lighter wind in ALL. The difference was about 3 m s−1, which is approximately the Cx difference between the two experiments (Fig. 6). Accordingly, a strong westerly wind favors a slower westward motion of the TC.
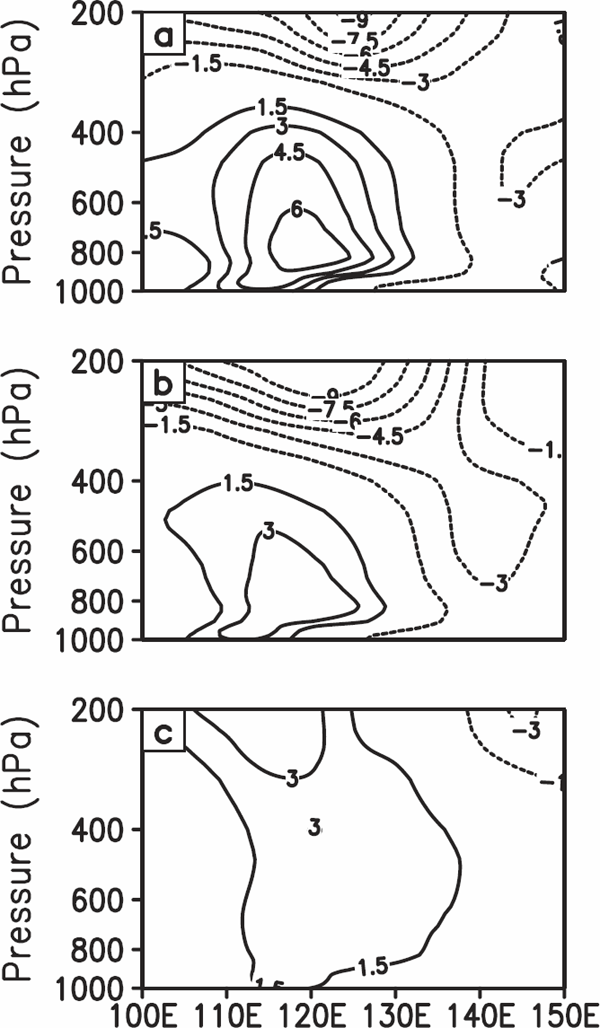
The averaged vertical–longitude background zonal wind from 10°N to 20°N during the period 19–20 October (m s−1): (a) CTL, (b) ALL, and (c) the difference between CTL and ALL.
Figure 11 displays the upper-level 200-hPa circulations at the initial time for the four experiments. The pattern in DOWN was almost the same as that in CTL, and the pattern in UP was very similar to that in ALL, indicating the vertical structure of the EW and the effect of removing the EW in different experiments. Figure 12 compares the same circulations in the four experiments on 20 October, two days into the integration. Both CTL and DOWN display a pronounced wave-like pattern. The EW was weaker in ALL and UP as we filtered out the 3–8-day synoptic time-scale component that dominated at the upper levels at the initial time (Fig. 11). However, in contrast to the initial states, the EWs reformed with a tilted orientation in these two experiments. This suggests that the mechanism behind the formation of the EWs was still there and that the titling may have been related to the existence of Megi through the amplification of the anticyclonic circulation by the outflow from Megi when the initial cyclonic circulation associated with the EW was removed.
The 200-hPa circulation (shown as vectors with wind speeds shown as red contours) and relative vorticity (shaded; units: 1 × 10⁻⁶ s−1) at the initial time on 18 October for the four simulated experiments: (a) CTL, (b) ALL, (c) UP, and (d) DOWN.
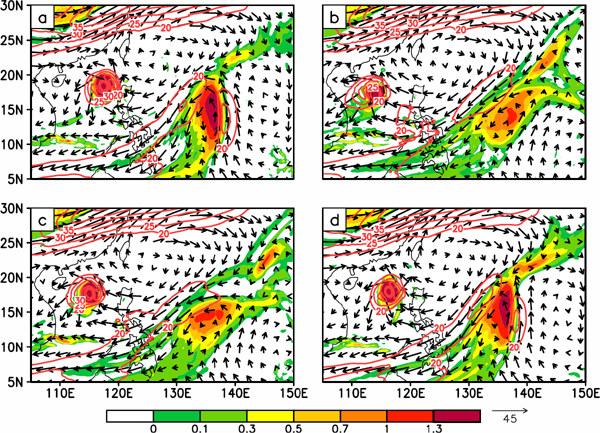
The 200-hPa circulation (shown as vectors with wind speeds shown as red contours) and relative vorticity (shaded; units: 1 × 10⁻⁶ s−1) on 20 October for the four simulated experiments: (a) CTL, (b) ALL, (c) UP, and (d) DOWN.
Figure 13a presents the vertical–longitude cross-section of the meridional wind along 15°N for 0000 UTC 20 October, showing the vertical structure of the EW and Megi in the CTL experiment. The maximum wind is at 200 hPa, with the speed exceeding 15 m s−1. The meridional wind speed decreases as the height decreases but extends vertically downward to middle levels (i.e., around 600 hPa). To satisfy the thermal wind balance, there is a cold core area with a minimum temperature at a height of 400 hPa (not shown). This pattern bears many similarities to a TUTT cell (Li et al. 2012). The maximum wind speed in the EW was lower in ALL (Fig. 13b).
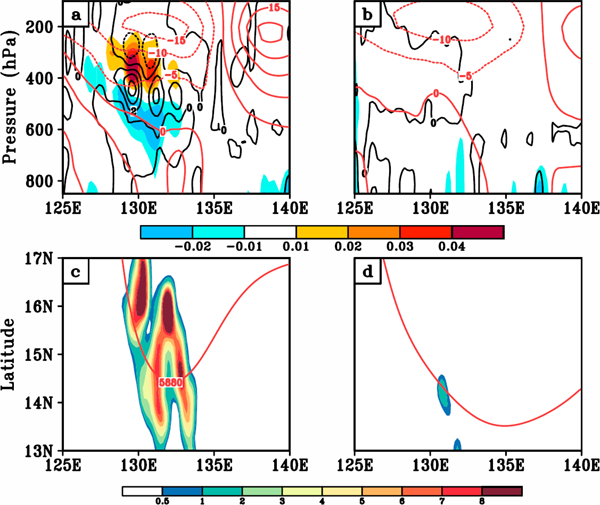
Upper panels: vertical-longitude cross-section of meridional wind of the easterly vortex (red contours; m s−1) and the diabatic heating rate, Q (shaded; units: 1 × 10⁻³ K s−1) along 15°N, centered on the easterly vortex on 20 October. The black contours are the relative vorticity tendency calculated using Eq. (1) for (a) CTL and (b) ALL. Lower panels: horizontal plot of the relative vorticity tendency at 500 hPa (shaded) and the spatial pattern of the WPSH highlighted using the 5880-gpm contour (in red) on 20 October for (c) CTL and (d) ALL.
Previous studies (Yao et al. 2009) suggested that the distribution and intensity of the diabatic heating of an EW can induce a short-term eastward retreat of the WNP subtropical high (WPSH). As a consequence of this, the environmental flows are modified and TC tracks can be affected. We postulate that, in the case that we examined, the EW may have caused erosion of the southwestern extent of the WPSH and subsequently affected the sharp northward turn of Megi. Also shown in Fig. 13a is the vertical–longitude cross-section of the diabatic heating rate (Q) along 15°N centered at the easterly vortex. Clearly, diabatic heating occurs above 600 hPa with a maximum centered on 400 hPa, whereas weak cooling occurs in the lower troposphere. In general, this vertical thermal distribution exhibits a “warmer in the upper layer and colder in the lower layer” pattern, which agrees well with Yao et al. (2009). In contrast to the vertical profile shown in Fig. 3c, the strong diabatic heating and vorticity generation are located to the west of the EW maximum where the horizontal shear is largest. Meanwhile, little diabatic heating and vorticity were generated in ALL (Figs. 13b, d).
Vorticity can be generated by the vertical distribution of diabatic heating according to the formula (Liu and Wu 1999)
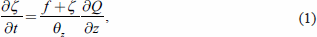 |
The horizontal convergence at 400 hPa is shown in Fig. 14. Note that a strong convergence existed between the TC and EW as the EW moved westward at 400 hPa on 20 October (Fig. 14b). The convergence was strongest around 132°E at 400 hPa and this produced the greatest diabatic heating in CTL (Fig. 13a); however, this heating was very much weaker in ALL (Fig. 14d). The convergence at the middle levels here may be associated with the outflow from Megi at the upper levels. It can be speculated that the diabatic heating and convergence at 400 hPa were caused by the confluence of the upper-level anticyclonic flow of the TC and the cyclonic flow of the EW.
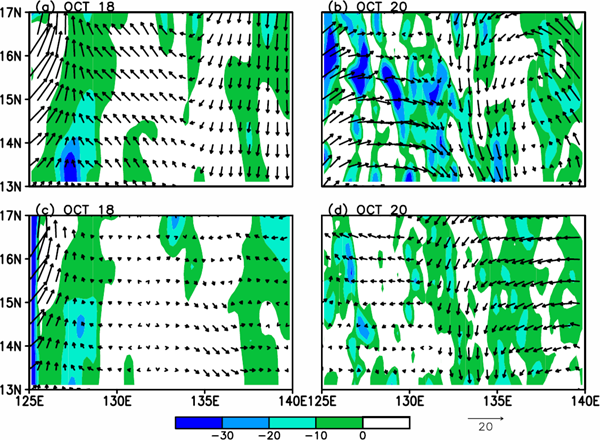
The convergence field (shaded) and the circulations (vectors) at 400 hPa at the initial time on 18 October and also on 20 October (units: 1 × 10⁻⁶) for (a and b) CTL and (c and d) ALL.
In the WNP summertime, the TC activity is largely controlled by the large-scale WPSH. Synoptic-scale systems such as TCs can also influence the variations in the WPSH. Wang et al. (2019) indicated that TCs can affect the WPSH's meridional movement by stimulating abnormal perturbations that disperse and propagate outward. For this reason, we examined the evolutionary characteristics of the WPSH. Figure 15 compares the spatial pattern of the WPSH in the four simulations for the initial time on 18 October and for 20 October two days later. The spatial features are highlighted by the 5880-gpm contour. The WPSH retreats farther east in CTL compared with its counterparts in the three sensitivity experiments. This result is also in agreement with Qian et al. (2013), in which it was suggested that the eastward retreat of the SH was responsible for the sharp northward turn of Megi. Physically, an eastward retreat of the WPSH will promote southerly winds on its western flank, which could likely act as a steering flow to trigger a northward turn of a TC.
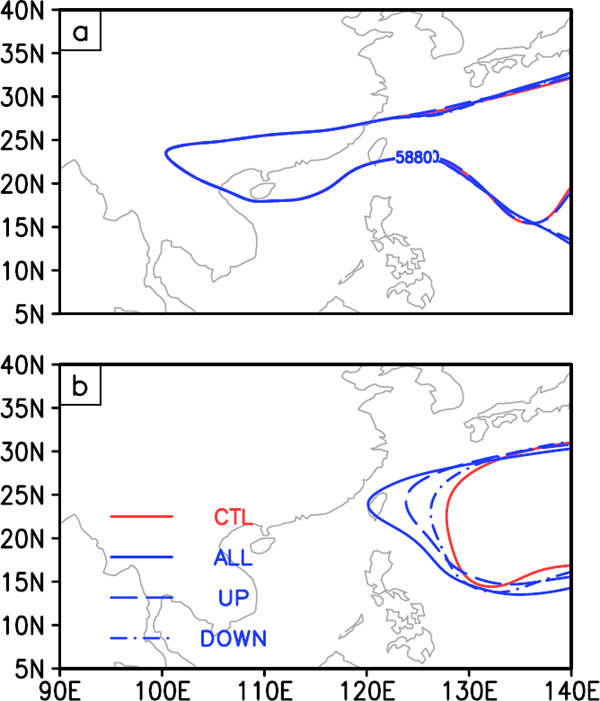
The spatial pattern of the WPSH in the four experiments highlighted using the 5880-gpm contour: (a) at the initial time on 18 October and (b) on 20 October after two days integration.
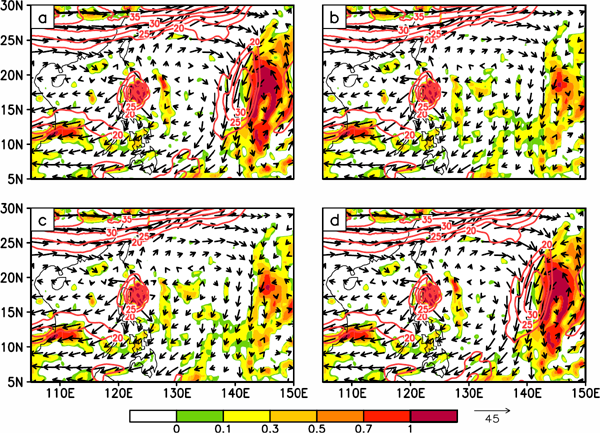
In both CTL and DOWN, a strong easterly vortex existed as part of the EW. As this entity moved westward and approached the TC, the combination of the northerly flow on its western flank and the outflow from Megi probably resulted in a stronger upper jet stream. It can be considered that this equatorward outflowing jet structure influenced the convection (Ge et al. 2010). To examine this possibility, Fig. 16 presents the 200-hPa circulations and the accumulated rainfall amount in CTL and ALL. When the TC is embedded in a giant MG system, the dispersion of the Rossby wave energy that is induced by the beta effect may induce a strong southwesterly flow in the southeast quadrant. As such, an outer spiral rainband will be generated by enhanced surface fluxes and converge with the southeasterly wind on the southwestern flank of the SH. As anticipated, another spiral rain-band exists in both CTL and ALL, but the associated convection is much more pronounced in CTL than in ALL. In CTL, the upper outflow jet core has a maximum wind speed exceeding 30 m s−1, which is much stronger than that in ALL. A strong outflow jet reflects a larger upper divergence (not shown), which enhances the vertical motion and thus the rainfall. This is the reason that the accumulated rainfall is larger in CTL, and there is a very large amount of convection in this case. Of particular interest is that the location of the maximum rainfall almost coincides with the right entrance region of the upper jet stream, which is a situation analogous to mid-latitude jet stream dynamics (Shi et al. 1990; Ge et al. 2010): namely, an intense upper outflow jet may force a secondary circulation in the entrance or exit region of the jet streak. As such, the forced vertical circulation will probably modify the upward motion and thus the accumulated rainfall within a certain area. In this study, the main precipitation was located to the right of the jet entrance region and coincided with the ascending motion. In contrast, these features were much weaker in ALL, implying the possible existence of processes associated with the jet dynamics. Recall that the TC was located further east in CTL than in ALL. As such, the associated diabatic heating was much closer to the WPSH in CTL. These combinations imply that there was strong diabatic heating on the western flank of the WPSH, which favored an abnormally eastward retreat of this system as well. Thus this may partially account for the observed eastward retreat of the WPSH.
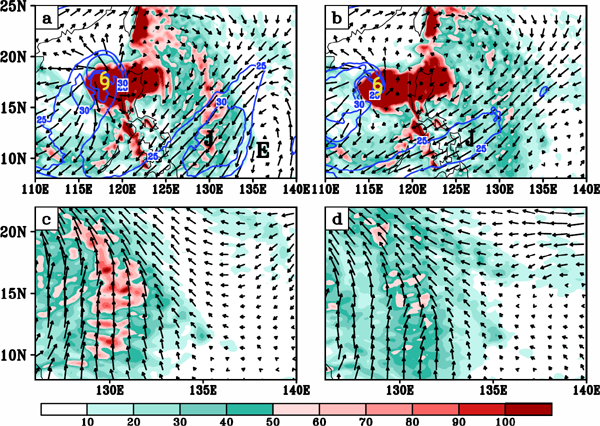
Top panels: the 200-hPa circulations (shown as vectors with wind speeds shown as blue contours; units: m s−1) and the accumulated rainfall (shaded; units: mm) on 20 October for (a) CTL and (b) ALL. The hurricane symbol represents the position of Megi near the surface, “E” represents the cyclonic vortex center of the easterly wave, and “J” represents the outflow jet core. Bottom panels: the-850 hPa circulation (vectors) and the accumulated rainfall distribution (mm) around the jet core region for (c) CTL and (d) ALL.
Typhoon Megi was the most powerful and long-lived TCs over the WNP in 2010. After crossing Luzon Island and moving into the South China Sea, Megi performed a sudden northward turn around 20 October. Observational analyses indicate that an upper-level EW with a cold-cored structure existed to the east of Megi; this moved westward and approached the storm before the critical time of the storm's turn. In this study, the influence of this upper EW on Typhoon Megi's sharp northward turn was examined by numerical simulations using the WRF-ARW model. In the control experiment, the simulation produced the sudden track change of Megi reasonably well. Sensitivity experiments were conducted by removing either different vertical layers or all of the synoptic-scale (3–8-day) signals that the EW dominated at the upper levels. In the absence of the upper-level EW, the simulated tracks did not produce the observed sharp northward turn. Previous studies have indicated that a nearby MG played an important role in Megi's sudden northward movement (Bi et al. 2015; Liang and Wu 2015; Ge et al. 2018). Here, we investigated how the upper-level EW may have impacted Megi through its influence on the MG. Two mechanisms were proposed regarding the role of the EW. First, the upper-level EW may have had an effect on the zonal speeds of Megi and thus on the relative motion between the TC and MG. The stronger low-level westerly wind would then have led to a slower westward motion of Megi and a slower westward propagation relative to the movement of the MG. Initially, the centers of the MG and TC were far apart. Gradually, the two centers attracted each other and nearly coincided, with Megi being located within the eastern semicircle of the MG. The enhanced southerly steering flow associated with the MG to its right favored the sharp northward turn of Megi. This is consistent with previous studies on the influence of the MG on Megi that were discussed in the Introduction (Bi et al. 2015). The sensitivity experiments showed that without the presence of the upper-level EW, Megi moved too fast and remained within the western semicircle of the MG and under the influence of the northerly flow of the MG circulation. The PV tendency analysis clearly accounts for the track changes, reflecting the impacts of different TC locations relative to the MG.
The second mechanism consisted of the upper-level EW modifying the spatial pattern and intensity of the SH over the WNP. Analyses of the model simulation indicated that the interaction between Megi and the EW led to a strong upper-level outflow jet. This enhanced upper-level outflow jet induced convective activity and diabatic heating between Megi and the cyclonic center of the EW, corresponding to the upward branch of a secondary circulation. The diabatic heating associated with this Megi-EW interaction generated further cyclonic vorticity on the western flank of the WPSH, thus eroding the western periphery of the WPSH and resulting in its eastward retreat. The retreat of the SH modified the large-scale flow that was steering Megi and contributed directly to the poleward steering through its western peripheral flow.
Abrupt TCs track changes remain a great challenge for operational and numerical predictions. While many studies have been devoted to Megi's abrupt northward movement, this study has further demonstrated the complex, multiscale interactions that impacted this movement. For successful TCs prediction, it is imperative that a numerical prediction system that has accurate initial conditions and that properly represents the multiscale dynamics and thermodynamics is implemented.
This work was jointly sponsored by the Science and Technology Innovation Project of Ningbo (Grant No. 2019B10025), the National Key R & D Program of China (2017YFC1502000), the National Science Foundation of China (Grant Nos. 41575056, 41730961, and 41775058), and the Priority Academic Program Development of Jiangsu Higher Education Institutions (PAPD). The numerical calculations in this paper have been done on the supercomputing system in the Supercomputing Center of Nanjing University of Information Science & Technology.