Article
Predictability of Enhanced Monsoon Trough Related to the Meandered Asian Jet and Consequent Rossby Wave Breaking in Late August 2016

2021 Volume 99 Issue 2 Pages 339-356

Details
2021 Volume 99 Issue 2 Pages 339-356
This study examines the predictability of an enhanced monsoon trough, which is accompanied by a largescale cyclone in the lower troposphere, south of Japan seen in late August 2016. The monsoon trough is found to be enhanced by a meandering of the Asian jet and a consequent southwestward intrusion of upper-level high potential vorticity associated with a Rossby wave breaking east of Japan. Japan Meteorological Agency's operational one-month ensemble prediction during the forecast period of a week underestimates the intensity of the Rossby wave breaking and fails to predict the enhanced monsoon trough. A simple sensitivity analysis based on ensemble singular vectors indicates that initial perturbations over the Bering Sea and near the Asian jet entrance region can efficiently grow and propagate toward the region to the south of Japan, contributing to maximize the perturbations of the enhanced monsoon trough. The time evolution of the perturbations propagating toward the region to the south of Japan is consistent with that of the ensemble spread during the forecast period. Perturbed hindcast experiments were conducted with the initial perturbations obtained from the simple sensitivity analysis. The monsoon trough to the south of Japan in the perturbed experiment is significantly more enhanced than the unperturbed experiment, supporting the simple sensitivity analysis. These results indicate a crucial contribution of the initial perturbations associated with the Rossby wave breaking and near the Asian jet entrance region to the limited predictability of the enhanced monsoon trough in late August 2016.
In Northern Hemispheric summer, the monsoon trough is climatologically enhanced from the South China Sea to the east of the Philippines (e.g., Lander 1996), accompanied by a strong convergence due to the monsoon westerlies and trade winds in the lower troposphere (e.g., Chan and Evans 2002; Tomita et al. 2004) and the resultant active convection over the region. The monsoon trough is thus one of the most essential features of the summer Asian monsoon circulation. A large-scale low-pressure system is occasionally seen over the subtropical western North Pacific (WNP) associated with the enhanced monsoon trough, which is called a “monsoon gyre” (e.g., Ge and Shi 2019; Jinno et al. 2019). Molinari and Vollaro (2013) and Wu et al. (2012, 2013) showed a close relationship between the enhanced monsoon trough and formation of tropical cyclones, indicating its large impacts on the summer climate over East Asia.
The active cumulus convection over the subtropical WNP associated with the enhanced monsoon trough is well known to be closely related to the anomalous anticyclonic circulation near Japan in the lower troposphere (e.g., Nitta 1987; Wang and Wu 1997; Lu and Dong 2001). This atmospheric teleconnection is referred to as the Pacific–Japan (PJ) pattern (Nitta 1987; Kosaka and Nakamura 2006). The anomalous anticyclonic circulation near Japan corresponds to the northwestward extension of the North Pacific subtropical high (NPSH), frequently causing anomalous hot summer climate (e.g., Wakabayashi and Kawamura 2004) and occasionally bringing heavy precipitation over Japan along the periphery of the NPSH. Molinari and Vollaro (2017) showed a close relationship between the monsoon gyre and the PJ pattern from their composite analysis of the monsoon gyre cases, indicating the impacts of the monsoon gyre on the abnormal summer climate over Japan.
The monsoon trough is associated not only with the tropical large-scale atmospheric and oceanographic variability such as the Madden–Julian Oscillation (MJO) and El Niño Southern Oscillation (ENSO) (Molinari and Vollaro 2017) but also with Rossby wave breakings (RWB) near the Asian jet exit region. Takemura et al. (2017) performed a case study on the event in August 2016 and showed that an equatorward intrusion of high potential vorticity (PV) airmass resulting from the RWB east of Japan can promote the enhanced convection over the subtropical WNP through dynamically induced ascent. The influence of the upper-level trough on the enhanced monsoon trough with a synoptic timescale is also indicated by Molinari and Vollaro (2012) and Geng et al. (2014). From the results of the lag composite analysis of 44 RWB cases, Takemura and Mukougawa (2020) (TM20) further revealed a process linking the quasistationary Rossby wave propagation along the Asian jet (Lu et al. 2002; Enomoto et al. 2003) and the PJ pattern through the “inverse-S” shaped RWB east of Japan. These results imply the impacts of atmospheric variability in the mid-latitude on the enhanced monsoon trough.
In August 2016, the persistent monsoon gyre associated with the enhanced monsoon trough was clearly seen over the subtropical WNP, accompanied by the formation of six tropical cyclones during the month (Takemura et al. 2017; Jinno et al. 2019). In the upper troposphere, the persistent Rossby wave propagation along the Asian jet and consequent frequent RWB east of Japan were clearly seen, contributing to the persistent monsoon trough (Takemura et al. 2017). The northern parts of Japan experienced a serious damage resulting from the sequent landfalls of typhoons associated with the monsoon gyre to the south. Hence, although the improved medium-range numerical prediction of the enhanced monsoon trough is expected to reduce the socio-economic damages due to the abnormal summer climate over East Asia, a related assessment of operational forecasts was not sufficiently performed in previous studies. According to the process indicated by TM20, it is expected that the limited predictability of the meandered Asian jet (e.g., Kosaka et al. 2012) and consequent RWB east of Japan can cause that of the monsoon trough. This study examines possible factors contributing to the predictability of the enhanced monsoon trough in the first half of late August 2016, which is one of the cases extracted in TM20, using an operational one-month ensemble forecast dataset.
The paper is arranged as follows. Section 2 describes the dataset used and analysis methods. Section 3 describes the atmospheric circulation from Eurasia to the WNP during the period from middle to late August 2016 and its ensemble forecast using a reanalysis dataset and Japan Meteorological Agency (JMA)'s one-month ensemble forecast dataset. In Section 4, we perform a simple sensitivity analysis based on ensemble singular vectors (SVs) to identify factors contributing to the limited predictability of the monsoon trough over the subtropical WNP. In Section 5, we conduct perturbed hindcast experiments given by the initial perturbations, which are obtained from the simple sensitivity analysis, to validate the result of the simple sensitivity analysis. Section 6 provides the main findings and discussion of the results in this study.
The data used in this study were the 6-hourly and daily mean datasets of the Japanese 55-year reanalysis (JRA-55) for August 2016 and during the 30-year period from 1981 to 2010 with a horizontal resolution of 1.25° and 37 pressure levels (Kobayashi et al. 2015). To infer convective activities, interpolated outgoing longwave radiation (OLR) (Liebmann and Smith 1996) provided by the National Oceanic and Atmospheric Administration was utilized. We also used operational one-month ensemble forecast dataset during 34-day forecast period from 12 UTC 16 August 2016, which is provided once a week by the JMA, with a horizontal resolution of 2.5° and 22 pressure levels. The forecast dataset had 25 ensemble members with 24 perturbed and 1 unperturbed (i.e., control run) initial conditions. The initial perturbations were obtained using the Breeding of Growing Mode method (Toth and Kalnay 1993). Here anomalies are defined as a departure from the climatology, which is obtained as the 60-day low-pass-filtered 30-year daily averages of JRA-55 from 1981 to 2010 using Lanczos filter (Duchon 1979). To extract low-frequency components, including quasi-stationary Rossby waves, a 5-day running mean was applied to the daily data. To represent transient disturbances along the meandered Asian jet, high-frequency components were defined by subtracting the 5-day running mean from the daily data.
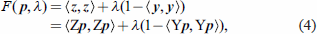
The propagation of Rossby wave packet was analyzed using the wave activity flux (WAF) defined by Takaya and Nakamura (2001). The horizontal component of WAF is defined as follows:
 |
To identify initial perturbations that can linearly evolve with the largest growth rate and contribute to the limited predictability of the monsoon trough over the subtropical WNP, we performed a simple sensitivity analysis based on ensemble SVs introduced by Enomoto et al. (2015). The analysis method is briefly described as follows. Assuming linear time evolution of initial perturbations denoted by y, perturbations at a verification time denoted by z can be represented as
 |
 |
 |
 |
 |
 |
 |

Five-day running mean (left) 200-hPa stream function (contour; unit: 106 m2 s−1) and the anomalies (shading), (middle) 360-K potential vorticity (shading; unit: PVU), and negative OLR anomalies (purple contour) at intervals of 15 W m−2, and (right) 850-hPa stream function (contour) and the anomalies (shading). The WAF (unit: m2 s−2) is indicated by vectors on the left and right panels. Black shadings in the right panels indicate regions with altitudes exceeding 1,600 m. Red triangles in the right panels denote central positions of typhoons at 12 UTC in each day based on JMA's best track data. (a, b, c) 18 August, (d, e, f) 20 August, (g, h, i) 22 August, and (j, k, l) 23 August 2016.
To assess the validity of the aforementioned assumption on the linear perturbation growth, perturbed hindcast experiments with the initial perturbations, which were obtained from the simple sensitivity analysis, were conducted using JMA's Global Spectrum Model (GSM) version 1705, which is newer than that used to produce JRA-55 (version 0808). The GSM has a horizontal resolution of TL319 and 60 vertical levels, which is the same as the JRA-55 system (Kobayashi et al. 2015), to avoid the interpolation of initial conditions derived from the JRA-55 dataset. Global objective analysis data (GANAL) in JMA, which have a higher horizontal resolution than the JRA-55 system, were used to give the initial conditions in the operational ensemble forecast. On the other hand, we used JRA-55 as the initial conditions according to the available period and resolution of the GANAL. During the 10-day integration period with a time step of 450 s, the GSM is forced at the lower boundary by the global daily sea surface temperatures (MGDSST: Merged satellite and in situ data Global Daily Sea Surface Temperatures in the global ocean; Kurihara et al. 2006) and climatological sea ice, which are provided by JMA.
Figure 1 shows the upper- and lower-tropospheric stream function anomalies, 360-K isentropic PV in the reanalysis, and OLR anomalies during the period from 18 to 23 August 2016. In the upper troposphere, the quasi-stationary Rossby wave propagation, accompanied by the meandered Asian jet, is clearly seen from Eurasia to the east of Japan during the period (Figs. 1a, d, g, j). The persistent propagation of wave packets contributes to a persistent ridge east of Japan, associated with the occurrence of an anticyclonic RWB with an “inverse-S” shaped overturning of the upper-level PV after 20 August (Figs. 1e, h, k). The consequent southwestward intrusion of the upper-level high-PV airmass toward the region to the southeast of Japan contributes to enhanced convection southeast of Japan (purple contour in Figs. 1h, k) through dynamically induced ascent as indicated by TM20. The southwestward intruding upper-level high-PV originates from a trough south of Alaska (Figs. 1a, b), which is downstream of the persistent ridge east of Japan. In the lower troposphere, an anomalous cyclonic circulation south of Japan is clearly seen on 18 August (Fig. 1c), which is associated with a prior RWB event in the first half of August (not shown). The lower-level anomalous cyclonic circulation, which once weakens on 20 August (Fig. 1f), is enhanced again after 22 August, indicating the persistent monsoon trough (Figs. 1i, l). The enhanced anomalous cyclonic circulation in late August 2016 is closely associated with the enhanced convection southeast of Japan (Figs. 1h, k). Their relationship is consistent with that of Takemura et al. (2017), who performed a numerical experiment using the linear baroclinic model (LBM; Watanabe and Kimoto 2000, 2001) with monthly-mean diabatic heat sources in August 2016. Their results of the LBM experiment show that the lower-level anomalous cyclonic circulation is a Rossby wave response to the heat sources associated with the enhanced convection over the subtropical WNP. The enhanced convection immediately south of Japan is associated with the lower-level enhanced cyclone including the typhoons (red triangles of Figs. 1i, l) over the region, which is associated with the southwestward intruding high-PV airmass (Figs. 1h, k). Meanwhile, a persistent anomalous anticyclonic circulation is clearly seen east of Japan (Figs. 1c, f, i, l), indicating southwest–northeast-oriented dipole anomalies with the anomalous cyclonic circulation south of Japan, which is like the northeastward shifted PJ pattern. The relationship between the RWB east of Japan and PJ-like pattern is consistent with the linking mechanism indicated by TM20.
Figure 2 shows the upper- and lower-tropospheric stream function anomalies, the 360-K isentropic PV, and precipitation anomalies predicted by the JMA's one-month ensemble mean forecast from 12 UTC 16 August 2016 until lead time of +7 day (23 August). Although the zonal phase of the quasi-stationary Rossby wave in the upper troposphere is well predicted, the amplitude of the wave is underestimated (Figs. 2a, d, g, j) compared to that in the reanalysis (Fig. 1). The RWB east of Japan and consequent southwestward intrusion of high-PV airmass toward the region to the southeast of Japan are also underestimated (Figs. 2e, h, k), associated with the weaker meandering of the Asian jet. The enhanced convection, which is shown by anomalous positive precipitation (purple contour in Figs. 2e, h, k), is seen in the narrow region over the subtropical WNP because of the underpredicted intrusion of the upper-level high-PV airmass. The enhancement of the monsoon trough in late August 2016 is not predicted at all (Figs. 2i, l), associated with the aforementioned underestimated process in the upper troposphere. The control forecast also underestimates the amplified Rossby wave in the upper troposphere and fails to predict the enhanced monsoon trough (not shown), as with the ensemble mean.

Same as Fig. 1 but for the JMA's operational one-month ensemble mean forecast from 12 UTC 16 August 2016. The purple contours denote positive precipitation anomalies at intervals of 3 mm day−1.
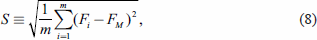
To assess the predictability of the enhanced monsoon trough south of Japan, the ensemble spread of the geopotential height between the ensemble members, which is defined by
 |

Five-day running mean geopotential height (contour; unit: m) and its spread normalized by the zonal mean (shading) at (a) 200 hPa and (b) 850 hPa in lead time of +7 day (23 August 2016). (c) shows a Hovmöller diagram of the normalized spread of 200-hPa geopotential height (shading) and 200-hPa meridional wind anomalies (contour; unit: m s−1) averaged between 35°N and 70°N from the initial time to the lead time of +8 day (24 August 2016). Black shading in (b) indicates the region with altitudes exceeding 1,600 m. The red closed curve in (b) denotes the verification area [15–30°N, 125–150°E]. Dots in (a) denote the region where the ensemble spread is larger than the climatological standard deviation of the height field derived from JRA-55. Black bold dashed line in (c) shows a longitude line of 135°E near Japan. Red and blue arrows in (c) mark the eastward propagating and migrating spread maxima, respectively.
Figure 3c further shows a Hovmöller diagram of the normalized ensemble spread of 200-hPa height averaged between 35°N and 70°N from the initial time to the lead time of +8 day (24 August), showing the variability of the ensemble spread along the Asian jet. The ensemble spread maxima in the upper troposphere propagate eastward from 30°E to the east of Japan (bold dashed line in Fig. 3c) during the period from the initial time to the lead time of +4 day (red arrow in Fig. 3c), contributing to the limited predictability of the RWB east of Japan afterward. The wave train structure of the ensemble spread maxima corresponds to the Rossby wave propagation along the Asian jet during the period (Figs. 2a, d). The ensemble spread maxima also move eastward (blue arrows in Fig. 3c), indicating the contribution of the transient disturbances along the meandered Asian jet. To examine the activities of the transient disturbances, the high-frequency components of 200-hPa height from the lead time of +2 day to that of +4 day are shown in Fig. 4. Both the reanalysis (left panels in Fig. 4) and ensemble mean forecast (right panels in Fig. 4) show the eastward migrating transient disturbances along the meandered Asian jet (striped gray shading in Fig. 4), particularly from central Eurasia to the Bering Sea, corresponding to the eastward migrating ensemble spread maxima (Fig. 3c). These results suggest that the ensemble spread near the Asian jet entrance region in the initial time propagates and migrates eastward resulting from the Rossby wave propagation and the active transient disturbances, contributing to the large ensemble spread around the RWB east of Japan. Further impact of the ensemble spread over Eurasia on the predictability of the monsoon trough will be discussed later.

High-frequency component of 200-hPa height (contour) at intervals of 30 m and 5-day running mean 200-hPa height (striped gray shading) at intervals of 100 m from 12,000 m to 12,500 m in (left) the reanalysis and (right) ensemble mean forecast. Red solid and blue dashed contours denote the positive and negative high-frequency components of height, respectively. (a, d) 18 August, (b, e) 19 August, and (c, f) 20 August 2016.
To assess the predictability and forecast error of the monsoon trough, daily time series of areal average of 850-hPa relative vorticity over the verification area from the initial time to the lead time of +9 day is shown in Fig. 5a. Here, the verification area is defined as the region [15–30°N, 125–150°E] (red closed curve in Fig. 3b), where the large ensemble spread of 850-hPa height is seen in the lead time of +7 day (Fig. 3b). In the reanalysis (black line in Fig. 5a), the positive vorticity over the verification area clearly increases after the lead time of +5 day, consistent with the enhanced monsoon trough (Figs. 1i, l). The lower-level relative vorticity in all ensemble members (gray thin lines) and ensemble mean (black dashed line), by contrast, fail to predict the enhanced monsoon trough after the lead time of +5 day, accompanied by the increasing ensemble spread (error bars). The difference in the relative vorticity between the ensemble mean (black dashed line) and reanalysis (black line) also greatly increases after the lead time of +5 day, resulting in large forecast errors.

(a) Daily time series of 850-hPa relative vorticity (unit: 10−6 s−1) averaged over the verification area [15–30°N, 125–150°E] in the reanalysis (black line), control run (green dashed line), all ensemble members (gray thin line), and the ensemble mean (black dashed line) from the initial time to the lead time of +9 day (25 August 2016). Error bars denote the ensemble spread represented by 1 standard deviation. Red triangles, blue squares, and green circles connected by lines indicate the results of the SV1-, SV2-, and CTL-experiments, respectively. (b) Same as (a) but the differences from the control run for the ensemble members (gray thin line) and those from the CTL-experiment for the SV1-experiment (red line) and SV2-experiment (blue line), respectively.
To identify the initial perturbation fields that can contribute to maximize the perturbation of the monsoon trough south of Japan, the simple sensitivity analysis (Enomoto et al. 2015) described in Section 2 was performed. Here, the norm of perturbation at the verification time (i.e., the norm of z) was calculated from the 5-day running mean perturbations over the verification area between pressure levels from 1000 to 500 hPa in the lead time of +7 day (23 August). The sensitive regions obtained from the first and second components of SVs, and their sum (hereafter referred to as SV1, SV2, and SV1+2), which explains about 33, 22, and 55 % of the total variance, respectively, are shown in Fig. 6. The SV1+2 shown in Fig. 6a indicates the two major sensitive regions from northern Europe to Central Asia and over the Bering Sea. The sensitive region over the Bering Sea is clearly detected as SV1 (Fig. 6b), corresponding to the trough south of Alaska in the upper troposphere, which is one of the origins of the southwestward intruding upper-level high-PV airmass toward the region to the southeast of Japan. Meanwhile, the sensitive region from northern Europe to Central Asia is identified as SV2 (Fig. 6c), corresponding to the wave train near the Asian jet entrance region. Although these sensitive regions are shown by the vertically integrated (from 1000 hPa to 100 hPa) MTE, they are centered in the upper troposphere above 500 hPa (not shown). It also indicates their close relationships with the upper-level atmospheric variability.

Sensitive regions of (a) SV1+2, (b) SV1, and (c) SV2, represented by MTE (shading; unit: J kg−1) derived from a linear combination of initial perturbations in all perturbed ensemble members. The variances of the SVs (unit: %) are denoted above the panels. Contours indicate 200-hPa geopotential height (unit: m) at the initial time. Dashed black closed curves denote the verification area [15–30°N, 125–150°E].
To examine the time evolution of the identified sensitive regions until the verification time, daily MTE derived from the regressed perturbations onto SV1 and SV2 during the forecast period is shown in Fig. 7. The large MTE in SV1 over the Bering Sea at the initial time (Fig. 6b) extends and intrudes southwestward (Figs. 7a–c), which is accompanied by the trough extending southward in the upper troposphere (contours in the figures). The time evolution of the perturbations in SV1 thus corresponds to the southwestward intrusion of the upper-level high-PV airmass associated with the RWB east of Japan (middle panels in Figs. 1, 2), contributing to the large perturbation over and around the verification area (Figs. 7c, d). The MTE in SV2 near the Asian jet entrance region (Fig. 6c) expands eastward in the lead time of +2 day (Fig. 7e), also contributing to the large perturbation over the WNP, including the verification area afterward (Figs. 7f–h). To further assess the downstream influence of the sensitive region in SV2, a Hovmöller diagram of the MTE normalized by the zonal mean averaged between 35°N and 70°N from the initial time to the lead time of +8 day (24 August) is shown in Fig. 8. The large MTE propagates eastward from 30°E to the east of Japan (bold dashed line in Fig. 8) during the period from the initial time to the lead time of +4 day, clearly showing its influence on the large perturbation east of Japan afterward. It is consistent with the eastward propagation of the ensemble spread described in Fig. 3c and is presumed to be associated with the Rossby wave propagation (left panel in Fig. 2) and the eastward migrating transient disturbances (right panel of Fig. 4) over Eurasia.

Same as Fig. 6 but for the MTE derived from the regressed perturbations onto (left) SV1 and (right) SV2 in the lead time of (a, e) +2 day, (b, f) +4 day, (c, g) +6 day, and (d, h) +7 day. The MTE and geopotential height in (d) and (h) are derived from the 5-day running mean.

Hovmöller diagram of vertically integrated (from 1000 hPa to 100 hPa) MTE derived from the regressed perturbations onto SV2 normalized by the zonal mean (shading) and 200-hPa meridional wind anomalies predicted by the ensemble mean (contour; unit: m s−1) averaged between 35°N and 70°N from the initial time to the lead time of +8 day (24 August 2016). Black bold dashed line shows a longitude line of 135°E near Japan.
These results indicate that the initial perturbation near the Asian jet entrance region and over the Bering Sea can contribute to the limited predictability of the enhanced monsoon trough through the meandered Asian jet and consequent southwestward intrusion of the upper-level high-PV airmass associated with the RWB east of Japan.
The aforementioned simple sensitivity analysis indicates that the initial perturbations over the sensitive regions linearly grow and can contribute to the maximized perturbation south of Japan in the lead time of +7 day (23 August). To assess the validity of the assumption on the linear perturbation growth, perturbed hindcast experiments given by the initial perturbations in SV1 and SV2 (hereafter referred to as SV1- and SV2-experiments), with their norms of the MTE shown in Figs. 6b and 6c, were conducted using a nonlinear atmospheric general circulation model (JMA's GSM). To focus on the impacts of the perturbations in the upper troposphere on those in the lower troposphere, the initial conditions were perturbed above a pressure level of 500 hPa. Figure 9 shows the difference in 850-hPa stream function between the SV1- and SV2-experiments and unperturbed experiment (CTL-experiment) in the lead time of +7 day. Both experiments show negative (cyclonic) perturbations over the subtropical WNP in the lower troposphere (Figs. 9a, b), indicating that the initial perturbations in SV1 and SV2 can contribute to the intensity of the monsoon trough. The cyclonic perturbations over the subtropical WNP are consistent with the results of the simple sensitivity analysis, indicating the valid assumption on the linear perturbation growth. Note that the centers of the cyclonic perturbations slightly shift eastward from the verification area (dashed red closed curve in Fig. 9), suggesting a possible contribution of the nonlinear perturbation growth that cannot be represented in the simple sensitivity analysis. The predicted central positions of the lowerlevel cyclones at 12 UTC in the lead time of +7 day (green triangles in Fig. 9) are largely different between the SV1- and SV2-experiments, and the cyclone in the CTL-experiment cannot be detected to the south of Japan. These large differences in the predicted cyclone may contribute to the eastward shifted lower-level cyclonic perturbations. Positive (anticyclonic) perturbations, by contrast, are seen west of the dateline in both SV1- and SV2-experiments, indicating the extended NPSH toward the region. These perturbations show the southwest–northeast-oriented dipole structure, with the cyclonic perturbation over the subtropical WNP and the anticyclonic one west of the dateline, which is like the northeastward shifted PJ pattern and is consistent with the anomalous circulation on 23 August (right panels in Figs. 1, 2).

Five-day running averages of the difference in 850-hPa stream function from the CTL-experiment for the (a) SV1-experiment and (b) SV2-experiment (shading; unit: 106 m2 s−1) in the lead time of +7 day. Contours denote the 850-hPa stream function in the (a) SV1- and (b) SV2-experiments at intervals of 2 × 10⁶ m2 s−1. Green triangles denote predicted central positions of cyclones south of Japan at 12 UTC in the lead time of +7 day for the (a) SV1- and (b) SV2-experiments. Black shadings indicate a region with altitudes exceeding 1,600 m.
To examine the influence of the upper-level initial perturbation over the Bering Sea in SV1 on the lower-level cyclonic perturbation over the subtropical WNP at the lead time of +7 day, differences in 200-hPa stream function between the SV1-experiment and CTL-experiment are shown in Fig. 10. A negative (cyclonic) perturbation over the Bering Sea at the initial time (Fig. 10a) intrudes southwestward toward the region to the southeast of Japan (Figs. 10b–d) in the upper troposphere. The time evolution of the perturbations in the SV1-experiment corresponds to the southwestward intrusion of the upper-level high-PV airmass associated with the RWB east of Japan. It is consistent with the time evolution of MTE derived from the regressed perturbations onto SV1 (left panel of Fig. 7), also indicating the impact on the large perturbation of the monsoon trough at the verification time (Fig. 9a).

Difference in 200-hPa stream function between the SV1-experiment and CTL-experiment (shading; unit: 106 m2 s−1) in the lead time of (a) 0 day (i.e., initial day), (b) +2 day, (c) +4 day, and (d) +5 day. Contours denote the 200-hPa stream function in the SV1-experiment at intervals of 5 × 10⁶ m2 s−1. The stream function in (d) is derived from the 5-day running mean.
The influence of the upper-level initial perturbation in SV2 on the perturbations over the WNP is also clearly seen in their longitude-time cross section. Figure 11 shows a Hovmöller diagram of the MTE, which is derived from the perturbations of the SV2-experiment from the CTL-experiment, normalized by the zonal mean averaged between 35°N and 70°N from the initial time to the lead time of +8 day (24 August). As with the result of the simple sensitivity analysis (Fig. 8), the large perturbations propagate eastward from 30°E to near the dateline through the region near Japan (bold dashed line in Fig. 11) during the period from the initial time to the lead time of +4 day, indicating the impacts on the large perturbation east of Japan afterward. Meridional wind perturbation in the upper troposphere (contours in Fig. 11) further exhibits both the quasi-stationary and eastward migrating wave train structures until the lead time of +4 day, indicating that the eastward propagation of the initial perturbations is associated with the Rossby wave propagation and eastward migrating transient disturbances over Eurasia. The eastward propagation of the perturbations from the Asian jet entrance region to the region near the dateline is also clearly seen even in the experiment in which the initial perturbations obtained from SV2 are limited over Eurasia alone (not shown). This result further confirms an essential contribution of the initial perturbations near the Asian jet entrance region to the enhanced monsoon trough at the verification time.

Hovmöller diagram of vertically integrated (from 1000 hPa to 100 hPa) MTE normalized by the zonal mean (shading) and differences in 200-hPa meridional wind between the SV2-experiment and CTL-experiment (contour; unit: m s−1) averaged between 35°N and 70°N from the initial time to the lead time of +8 day (24 August 2016). The MTE is derived from the perturbations of the SV2-experiment from the CTL-experiment. Black bold dashed line shows a longitude line of 135°E near Japan.
Daily time series of the areal average of 850-hPa relative vorticity over the verification area in the SV1-, SV2-, and CTL-experiments are shown in Fig. 5a. The relative vorticities in the SV1-experiment (red triangles) and SV2-experiment (blue squares) increase after the lead time of +5 day and reproduce the enhanced monsoon trough compared to the ensemble forecasts (gray thin and black dashed lines) that fail to predict that. The intensities of the cyclonic circulations in the SV1- and SV2-experiments are prominent and strongest between all ensemble members in the lead time of +7 day, in contrast to that in the CTL-experiment (green circles), which is within the range predicted by the ensemble members. The differences in the lower-level cyclone intensity of the SV1-experiment (red line in Fig. 5b) and SV2-experiment (blue line in Fig. 5b) from the CTL-experiment are almost the same as or larger than those of the ensemble member with the highest vorticity from the control run (gray line in Fig. 5b) in the lead time of +7 to +8 days. The large positive differences in the lower-level vorticity for the SV1- and SV2-experiments from the CTL-experiment are consistent with the maximized perturbation to the south of Japan. The lower-level vorticity time series in the SV1+2-experiment is almost the same as those in the SV1- and SV2-experiments, and the monsoon trough is stronger than the CTL-experiment (not shown). The cyclonic circulations shown in the SV1- and SV2-experiments further show the reduced forecast errors of the monsoon trough compared to the ensemble predictions, although the intensity is still largely underestimated compared to the reanalysis (black line). The underpredicted positive vorticity from the lead time of +2 day to +4 day in the perturbed hindcast experiments compared to the operational ensemble forecast may be due to the difference in the dataset to give the initial conditions between JRA-55 and the GANAL, as described in Section 2. A detailed comparison with the perturbed hindcast experiment using the GANAL will provide us with further understanding of the differences in the predicted lower-level vorticities between the operational forecast and hindcast experiment in this study.
These results from the perturbed hindcast experiments also indicate that the initial perturbation near the Asian jet entrance region and over the Bering Sea can contribute to the predictability of the enhanced monsoon trough, supporting the results of the simple sensitivity analysis in the valid assumption on the linear perturbation growth.
This study investigated the predictability of the enhanced monsoon trough south of Japan in late August 2016 using the JRA-55 reanalysis dataset and JMA's operational one-month ensemble forecast dataset.
The enhanced monsoon trough in late August 2016 was caused by the propagation of amplified Rossby waves along the Asian jet and consequent southwestward intrusion of the upper-level high-PV airmass toward the region to the southeast of Japan associated with the RWB east of Japan. The influence of the amplified Rossby waves along the Asian jet on the enhanced monsoon trough was consistent with the linking process indicated by TM20. The ensemble prediction during the forecast period of a week underestimated the intensity of the Rossby wave propagation and the RWB east of Japan and failed to predict the enhanced monsoon trough. In the upper troposphere, the ensemble spread maxima extended from south of Alaska to the subtropical WNP during the forecast period, indicating the contribution of the limited predictability of the southwestward intruding high-PV airmass associated with the RWB to that of the enhanced monsoon trough. The upper-tropospheric ensemble spread maxima near the Asian jet entrance region also propagated eastward along the Asian jet until the lead time of +4 day, associated with the Rossby wave propagation and the eastward migrating transient disturbances, contributing to the limited predictability of the RWB east of Japan. The existence of eastward migrating transient disturbances along the meandered Asian jet described in Fig. 4 is one of the remarkable features, even though baroclinicity in mid-latitudes in summer is climatologically smallest in the year (e.g., Nakamura 1992). It motivates us to further examine the influences of the active transient disturbances on the maintenance of the RWB east of Japan as indicated by Yamazaki and Itoh (2013a, b).
The simple sensitivity analysis based on ensemble SVs with the verification area south of Japan showed the sensitive regions over the Bering Sea and near the Asian jet entrance region as SV1 and SV2, respectively. The result of the sensitivity analysis indicated that the initial perturbations over the regions can efficiently grow and propagate toward the region to the south of Japan, contributing to the limited predictability of the enhanced monsoon trough, consistent with the variation of the ensemble spread during the forecast period. The contribution rate of the initial perturbation over the Bering Sea and near the Asian jet entrance region can be approximately estimated as 33 % and 22 % from the variance of SV1 and SV2, indicating the primary and secondary factors causing the limited predictability of the enhanced monsoon trough, respectively. The sensitive region for the weighted average from SV3 to SV10 is seen over tropics, particularly over the central to eastern tropical North Pacific, although each SV mode has a small variance (not shown). This result suggests a relatively insignificant contribution of tropical variability such as convective activities over the intertropical convergence zone to the predictability of the monsoon trough in late August 2016.
The perturbed hindcast experiments with the initial perturbations in both SV1 and SV2 reproduced the enhanced monsoon trough south of Japan, in contrast to the operational ensemble forecast that failed to predict that. The results of the perturbed hindcast experiments supported the result of the simple sensitivity analysis and showed the validity in the assumption on linear perturbation growth. These results indicate the crucial contributions of the initial perturbations around the RWB and along the meandered Asian jet to the limited predictability of the persistent monsoon trough in late August 2016.
The results shown in this case study suggest that the precise prediction of the enhanced monsoon trough due to the variability in mid-latitudes during the forecast period of one week still remains a challenging task as described in Fig. 5a. To further assess the causal relationship from the underestimated RWB east of Japan to the failed prediction of the enhanced monsoon trough in the operational ensemble forecast, we are planning to perform an impact experiment using the JMA's GSM, which nudges the forecast over the region of the RWB toward the reanalysis during the time integration. The result of the impact experiment will be presented in our future paper.
The authors are very grateful to Dr. Hiroshi G. Takahashi and two anonymous reviewers for their constructive and helpful comments. The one-month ensemble forecast dataset and part of initial condition for the perturbed hindcast experiments was provided by way of “Meteorological Research Consortium”, which is a framework for research cooperation of JMA and the Meteorological Society of Japan. The GSM to conduct the perturbed hindcast experiments was provided by JMA, with a framework of “Research and Development Platform of Numerical Prediction”. The Generic Mapping Tools were used to create the graphics. This study was partly supported by the JSPS KAKENHI Grant (18H01280, 18K03734).