Abstract
A stationary line-shaped precipitation system (SLPS), which is one type of mesoscale convective systems, is a typical heavy rain-producing weather system formed during warm seasons in Japan. Although the Kinki district, western Japan, is known as a frequent occurrence region for SLPSs, their formation mechanisms in the region have not been sufficiently elucidated yet because of their complex formation processes. Using observational data and high-resolution numerical experiments, in this study, we investigated a SLPS event that occurred on 1 September 2015. We also conducted numerical sensitivity experiments regarding the orography and initial time.
The observational data showed that the relative humidity at lower levels was high during the SLPS event. The southwesterly was dominant at middle levels over the Kinki district during the formation of the SLPS. The formation of the SLPS was associated with neither a mesoscale low-pressure system nor a synoptic-scale cold front, demonstrating that these were not necessary conditions for the formation of the SLPS.
In the numerical experiments, we found that the SLPS was formed in a low-level convergence zone of the westerly with the warm and moist south-southwesterly from the Kii Channel. New convective cells formed over the north of Awaji Island and are propagated northeastward by the middle-level southwesterly. This cell formation process was repeated and resulted in the formation of the SLPS. The sensitivity experiments for the orography around the occurrence area of the SLPS indicated that the orography was not a significant factor for the formation of the SLPS in this event. The orography can modify the location of the SLPS.
1. Introduction
During warm seasons in Japan, heavy rainfall events are occasionally caused by various meteorological phenomena such as typhoons, extratropical cyclones, and mesoscale convective systems (MCSs). Among these, MCSs frequently cause heavy rainfall events over Japan. Although they develop in several different forms, line-shaped precipitation systems caused most heavy rain events during warm seasons in cases without typhoons (Ogura 1991; Tsuguti and Kato 2014). When a line-shaped precipitation system stagnates at almost the same place, a large amount of rainfall is brought there. In this study, we refer to this type of precipitation system as a stationary line-shaped precipitation system (SLPS). Kato (2020) defined that SLPSs comprise several convective cells or clusters aligned linearly with a width of 20–50 km and a length of approximately 50–300 km. These systems occasionally remain stationary for several hours. SLPSs formed in environments of various weather systems such as the Baiu front (also known as the Changma front in Korea and the Meiyu front in China and Taiwan), a convergence line in the lower troposphere, and a cold front (Kato 2020). As SLPSs frequently cause disasters in Japan, improving their forecast accuracy is necessary for disaster reduction (Tsuguti 2016). Toward this goal, the formation mechanism of SLPSs must be elucidated, and their conceptual model should be established.
Previous studies have classified the patterns of line-shaped MCSs, including those of SLPSs. Bluestein and Jain (1985) studied the squall line formation mechanism over Oklahoma, USA, during spring seasons. They classified the formation patterns of linear MCSs into four types, namely, broken line (BL), back building (BB), broken areal, and embedded areal types. They found that line-shaped MCSs formed under unstable environmental conditions with large convective available potential energy (CAPE). Using weather radar observations, Parker and Johnson (2000) proposed three conceptual models of line-shaped MCSs with the stratiform precipitation occurring in the United States: trailing stratiform, leading stratiform, and parallel stratiform. They also found that each type of these line-shaped MCSs formed in different environments and that these environments affected the travel speed and duration of the MCSs. Schumacher and Johnson (2005) studied the organization and environmental properties of SLPSs in the area east of the Rocky Mountains, USA, by using radar data and a numerical model. They proposed a training line/adjoining stratiform as a new type of line-shaped MCS in addition to the BB type. They reported that BB-type MCSs depend on small-scale processes such as the storm-scale (2–20 km) or meso-scale (20 km to several hundred kilometers) processes rather than the large-scale ones and that elucidating their environmental conditions is more difficult than that for other linear MCSs. Using the classifications of the above studies, Gallus et al. (2008) classified convective storms that occurred over the central United States in the warm season of 2002. They found that linear-type MCSs had a higher threat of causing severe weather events such as hail, flooding, and tornados than isolated cells or convective clusters.
In Japan, previous studies considered that low- and middle-level winds were related to the formation mechanism of SLPSs. Seko and Nakamura (2003) proposed a back-and-side building (BSB) type for the SLPS formation, besides the BB type. From numerical experiments, they confirmed that the type of SLPSs was determined by wind directions at low and middle levels. Under the condition in which the low and middle-level wind directions are almost parallel, BB-type MCSs are formed by the successive formation of convective cells and their leeward movements. By contrast, BSB-type MCSs produce a carrot-shaped precipitation area, and the low-level inflow comes from the right-hand side of the middle-level flow. Seko and Nakamura (2003) also conducted sensitivity experiments on middle-level humidity and found that the SLPS type was not affected by middle-level humidity. By contrast, Kato (2006) studied the structure of an SLPS that occurred over northern Kyushu, western Japan, in 1999 and found that the moist southwesterly at low levels and the dry westerly at middle levels enhanced convective instability. He also found that the top height of cumulonimbus clouds was controlled by the inflow amounts of dry air at middle levels that suppressed the further development of cumulonimbus clouds. A large intrusion of middle-level dry air into convective cells decreased their buoyancy owing to evaporative cooling. Kurihara et al. (2009) studied an SLPS and environmental airflow over Hiroshima, western Japan, by conducting numerical experiments. They found that the SLPS was formed by the convergence of the low-level warm and moist southerly with the southeasterly on a warm front of a low-pressure system. They indicated that the middle-level dry inflow and orography over western Japan were essential factors in the SLPS formation. In the SLPS formation, the increase of the low-level convergence by the orography (Takasaki et al. 2019) and near-surface advection of warm air (Kato and Goda 2001) have been also suggested as important factors. According to Kato (2020), the formation mechanism of SLPSs is categorized into two types: BL and BB. He proposed six favorable occurrence conditions for SLPSs: large water vapor flux amounts (FLWV) at low levels, short distances to the level of free convection (dLFC), high relative humidity (RH) at middle levels, large storm-relative environmental helicity (SREH) estimated due to the large vertical wind shear, upward motion of synoptic-scale environment, and the exclusion of warm air advection frequently appearing at 700–800 hPa and inhibiting the development of convection. As described above, SLPSs form under complex conditions.
The Kinki district (see lower panel in Fig. 1, except Shikoku Island), western Japan, is a region where SLPSs are frequently observed. Higashi et al. (2010) studied the SLPS formation mechanisms in the Kinki district during the post-Baiu season in August and September. They proposed that several mesoscale factors facilitated the formation of SLPSs. Among them, the orographic effect on the windward side of Awaji Island was found to play a key role in triggering the formation of convection cells.
Ishihara and Takara (2018) showed a new formation mechanism of SLPSs in the Kinki district, which was not related to a cold front. They highlighted the importance of the warm and humid southerly inflow through the Kii Channel in the lower layers and the orography of Mount Rokko. The study suggested that the SLPSs observed in the Kinki district are caused by several factors under complex mechanisms at various horizontal scales. However, the effect of individual orography surrounding Osaka Bay has not yet been elucidated. Therefore, the formation mechanisms of SLPSs in the Kinki district during warm seasons should be investigated, and the influence of various factors such as synoptic conditions, the local convergence, and the orography should be explored.
In another study, a mesoscale low-pressure system and the horizontal shear associated with the Baiu front were found to be important for the formation of SLPSs (Meteorological Research Institute 2010). The study found the convergence of the southerly through the Kii Channel with the westerly over Osaka Bay, although the formation mechanism of the westerly was not understood in detail.
In this study, we focused on the SLPS formation mechanisms over the Kinki district during warm seasons and performed a detailed analysis of an SLPS event observed on 1 September 2015. First, we examined observational data including radar observations, upper air soundings, and surface weather data to elucidate the environmental conditions and characteristics of the SLPS. Second, we conducted high-resolution numerical experiments using the Cloud Resolving Storm Simulator (CReSS) (Tsuboki and Sakakibara 2002) to study the SLPS formation mechanisms. Third, we conducted sensitivity experiments to explore the effects of the orography surrounding Osaka Bay.
In Section 2, we described the data and methods in this study. In Section 3, observational aspects of the SLPS event on 1 September 2015 were summarized. The results of the control experiment and sensitivity experiments using CReSS are shown in Sections 4 and 5. In Section 6, we discuss essential factors of the SLPS formation mechanism on 1 September 2015. Finally, we summarized this study in Section 7.
2. Data and method
2.1 Data
The observational data used in this study were the weather radar data, surface data of automated meteorological data acquisition systems (AMeDAS), and upper air sounding data, provided by the Japan Meteorological Agency (JMA), on 1 September 2015. The JMA radar (C-band Doppler, 5.3 GHz) network covering the Japanese islands observes the precipitation intensity every 5 min. In this study, a constant altitude plan position indicator (CAPPI) at an altitude of 2 km was used to examine the temporal change of the target SLPS. The AMeDAS data include wind speed and direction, rainfall amount, and sunshine duration. We used the hourly accumulated precipitation data at the Nose (34.948°N, 135.455°E, Fig. 1), which is the nearest AMeDAS station to the point with the maximum accumulated precipitation amount in the SLPS observed by the JMA radar from 1000 UTC to 1200 UTC on 1 September 2015. The upper air sounding data at the Shionomisaki (33.45167°N, 135.7617°E) at 1200 UTC on 1 September 2015 were used to examine the atmospheric conditions in the occurrence of the SLPS, such as CAPE, convective inhibition (CIN), and total precipitable water.

To understand the synoptic conditions when the SLPS formed, we used the JMA weather charts at the surface and upper levels (850 hPa and 500 hPa) at 1200 UTC on 1 September 2015.
2.2 Numerical model
The cloud resolving model, CReSS was used to simulate the structure and time evolution of the SLPS with a high resolution. CReSS is a non-hydrostatic three-dimensional numerical model with a bulk-type cold rain scheme. The prognostic variables were three-dimensional velocity components, pressure perturbation, potential temperature perturbation, water vapor mixing ratio, sub-grid scale turbulent kinetic energy, number densities of solid hydrometers (cloud ice, snow, and graupel), and mixing ratios of hydrometeors (cloud water, rain, ice, snow, and graupel). A more detailed description of CReSS is given by Tsuboki and Sakakibara (2002, 2007).
To simulate the SLPS event on 1 September 2015, we conducted several numerical experiments. Figure 2 shows the computational (solid box) and analysis (dashed box) domains. The horizontal grid spacing is 1 km, and 60 stretched layers with the model top of 26.6 km were set in a vertical direction. Seven layers are included below 1 km: 25, 95, 204, 346.3, 521, 726, and 958 m. The time step of all experiments is 0.5 s. The initial and boundary conditions are provided by the JMA mesoscale analysis (JMA-MA, Japan Meteorological Society 2013), and the land use data are provided by the United States Geological Survey (USGS) 30 s data. The JMA-MA is produced eight times daily at 0000, 0300, 0600, 0900, 1200, 1500, 1800, and 2100 UTC by using a four-dimensional validation technique in which observation data from various systems such as weather radar, satellites, and a ground-based global navigation satellite system are assimilated. The horizontal grid system of the JMA-MA is the Lambert projection with a horizontal resolution of 5 km at 30°N and 60°N with grid numbers of 721 × 577 (Table 1).

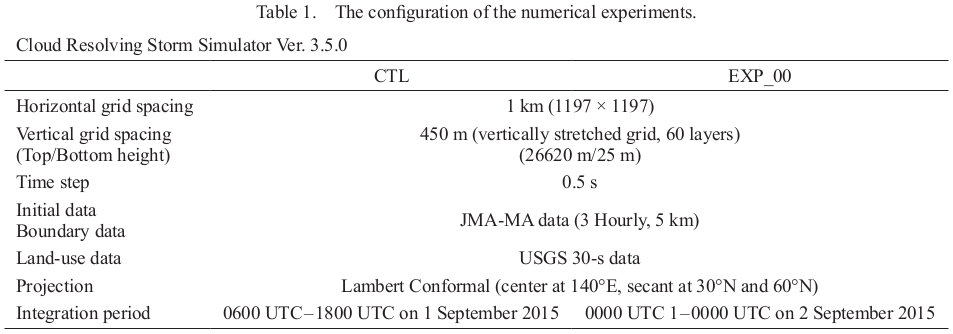
The control experiment (CTL) and sensitivity experiments for the orography were conducted for the period from 0600 UTC to 1800 UTC on 1 September 2015. Another sensitivity experiment for the environmental conditions was initiated from 0000 UTC on 1 September 2015 (EXP_00). To examine the effects of orography and land use in the Kinki district, we conducted sensitivity experiments in which the land elevation and land use were changed. In the experiment of ROKKO_100M, the terrain heights of Mount Rokko higher than 100 m were reduced to 100 m. In the experiments of AWAJI_0M and AWAJI_NONE, the terrain heights of Awaji Island were reduced to 0 m and Awaji Island was replaced by sea, respectively. Furthermore, to examine the effect of Shikoku Island, in the experiments of SHIKOKU_NONE and SHIKOKU_0M, the terrain heights of Shikoku Island was also reduced to 0 m and Shikoku Island was replaced by sea, respectively. We conducted all of the sensitivity experiments on the orography with the same experimental settings as those in CTL.
3. Observation of the SLPS event on 1 September 2015
Figure 3 shows accumulated precipitation amounts (mm) and precipitation intensity (mm h−1) of CAPPIs at a height of 2 km, observed by the JMA radar network on 1 September 2015 over the Kinki district. From 0940 UTC to 1200 UTC, the accumulated precipitation amounts were distributed in a linear shape from Osaka Bay to Lake Biwa, and the maximum amounts exceeded 50 mm (Fig. 3a). According to Unuma and Takemi (2016), the orientation of the SLPS in this event was frequently observed during warm seasons in Japan. The convective cell C1 appeared over Osaka Bay at 0940 UTC and developed with traveling northeastward (Fig. 3b). New cells (C2 and C3) formed on the upstream (i.e., southwestern) side of the cell C1 and also developed with traveling northeastward. This successive formation process of convective cells is repeated until 1200 UTC (C4, C5, and C6). Consequently, the SLPS formed to extend from the west-southwest to the east-northeast. All of the convective cells formed near the coastline. The formation process of the SLPS was similar to that of the BB type (Bluestein and Jain 1985; Schumacher and Johnson 2005; Gallus et al. 2008). The observed total precipitation amount at the Nose station was 59.5 mm during the period from 1000 UTC to 1200 UTC.

The JMA weather chart at 1200 UTC on 1 September 2015 (Fig. 4) shows that an extratropical cyclone with a central pressure of 1006 hPa and a North Pacific high-pressure system sandwiched the Kinki district. Another extratropical cyclone with a central pressure of 1008 hPa was located over the Shandong Peninsula (approximately 36°N, 120°E). The Kinki district was influenced by the southwesterly on the west side of the North Pacific high-pressure system and the westerly on the south side of the extratropical cyclone. This surface pressure pattern was similar to those in the SLPS events studied previously (Seko et al. 2006; Higashi et al. 2010; Meteorological Research Institute 2010). However, the cold front associated with the extratropical cyclone was located to the further west of the Kinki district during the formation of the SLPS. When the SLPS had already dissipated at 1800 UTC, the cold front reached the Kinki district (not shown). Therefore, the SLPS formed and dissipated in the warm sector between the cold and warm fronts of the extratropical cyclone. Moreover, when the SLPS formed, there were no abrupt changes in the temperature and wind direction at the AMeDAS observation points in the Osaka Plain (not shown). According to Kato (2020), the present case was categorized as the case of low pressure among the five types of synoptic fields in which SLPSs form. He also showed that the ratio of this type corresponds to 12 % of all SLPS cases analyzed in Japan from 1989 to 2015 warm seasons (April–November).

Figure 5 shows the upper weather charts at 850 hPa and 500 hPa. The pattern of isohypse lines at 850 hPa was similar to the surface pressure pattern. The Kinki district lays in a moist area along dense isohypse lines. A wind stronger than 20 knots was observed at 850 hPa at Shionomisaki. This strong wind crossed an 18°C temperature line at 850 hPa, which resulted in the inflow of warm air to the Kinki district that was shown in Fig. 5 by a low dew point depression area. Highly humid air was present over the Kinki district in this case. In the 500 hPa upper weather chart, a trough was present over the Shandong Peninsula, whereas a low-pressure system located to the north of Japan was not clearly found. In front of the low-pressure trough, the southwesterly with a wind speed of approximately 40 knots was present over western Japan.

Figure 6 shows the skew T-log P upper air diagram at the Shionomisaki station at 1200 UTC on 1 September 2015. The lower layer below 846 hPa (1565 m height) was very humid (RH over 80 %) and the wind direction was south-southwesterly. The lifting condensation level and level of free convection (LFC) in an air parcel averaged from the surface to 500 m height being lifted adiabatically were extremely low levels of 965.3 hPa (approximately 420 m height) and 928.6 hPa (approximately 760 m height), respectively. The CAPE and CIN estimated by lifting a parcel from a 500 m height were 2382.3 J kg−1 and 0.1 J kg−1, respectively. The total precipitable water was 56 mm. These values indicate that the atmosphere was conditionally unstable, and the occurrence possibility of thunderstorms was high (Schultz et al. 2000). Under the conditions with a large CAPE and an extremely low LFC, convective clouds can easily form by weak forcing at low levels.

These observational data indicate that the atmosphere on the low-level upstream side of the Kinki district was highly conditionally unstable and that weak forcing could easily initiate convective cells. This unstable atmosphere was caused by the low-level inflow of the strong south-southwesterly from the moist air mass over the Pacific Ocean. Conversely, the SLPS extended to the east-northeast by the south-westerly in the middle troposphere. However, only these observational data are insufficient to explain the atmosphere condition in the present case.
4. Control experiment
To verify the results in CTL, we compared the simulated distribution of accumulated 2 h precipitation amounts with that observed by the JMA radar network. Figure 7 shows the accumulated precipitation amounts and precipitation intensity in CTL from 1000 UTC to 1200 UTC. Compared with radar observations (Fig. 3), the SLPS location and the generation points of convective cells in CTL were slightly shifted to the north (Fig. 7a), and the linear shape of the SLPS was wider than the observation. The formation of convective cells (Cs1, Cs2, and Cs3 in Fig. 7b) that organized the SLPS was delayed by approximately 50 min from the radar observations (CTL: 1030 UTC, observations: 0940 UTC). Compared with the radar observations, the precipitation intensity of the convective cells was slightly overestimated. New convective cells (Cs3, Cs4, Cs5, and Cs6) formed on the upstream side of Cs1, Cs2, and Cs3. Although there are some discrepancies between CTL and the observations, the SLPS was well-reproduced, particularly the orientation of the SLPS and the cell movements from the west-southwest to the east-northeast. Therefore, the results in CTL were useful in studying the SLPS formation mechanisms.

Figure 8 shows the moisture flux convergence (MFC) and horizontal wind vectors over the Kinki district at a height of 521 m from 1000 UTC to 1200 UTC. In this study, we used the horizontal MFC defined by Banacos and Schultz (2005),
where
u and
υ are wind components and
q is the specific humidity. A large convergence zone (> 3 × 10
−6 g kg
−1 s
−1) was continuously simulated to extend from the northeast part of Shikoku Island to around Mount Rokko through the west coast of Awaji Island from 1000 UTC to 1200 UTC at a height of 521 m. This region corresponded to a horizontal wind shear zone of the westerly and the south-southwesterly. Similar to
Meteorological Research Institute (2010), in
Fig. 8e, the westerly was found on the western side of the shear zone, conversely, the south-southwesterly was found on the eastern side.
Figure 9 shows that the westerly (shaded region) developed in the lower layer to the west of Awaji Island (
Figs. 9a–c dotted circle), associated with the extratropical cyclone that traveled northeastward. Although the low-level convergence zone moved eastward associated with the development of the westerly, the south-southwesterly was maintained to the south of the Kinki district. In the vertical velocity field at a height of 958 m (
Fig. 10), weak updrafts were maintained over the west of Awaji Island and the south of Mount Rokko.


To examine the characteristics of the south-southwesterly and westerly that formed the low-level convergence zone, Fig. 11 shows the equivalent potential temperature (EPT) distribution with wind vectors at a height of 521 m and two cross-sections along the low-level wind directions. High EPT (higher than 350 K) was found on the east side of Awaji Island and above the Kii Channel (Fig. 11a). This indicates that warm and humid air is advected by the south-southwesterly along the western part of the Pacific high-pressure system. The south-southwesterly with high EPT along the east side of Awaji Island formed large MFC with the westerly (Fig. 8). In the vertical cross-section on the lines AO and BO in Fig. 11a (Figs. 11b, c), high EPT air reached the Kinki district below a height of 1 km. This indicates that the south-southwesterly brought warm and humid air to the Kinki district and caused the convergence zone with the westerly.

Figure 12 shows the vertical projections of the maximum values of total hydrometeor mixing ratios (cloud water, rain, ice, snow, and graupel) in a northwest–southeast direction in the dotted box in Fig. 7a during the formation of the SLPS from 1000 UTC to 1200 UTC. New convective cells (from Cs1 to Cs6 in Fig. 12) formed successively on the upwind side of pre-existing cells and rapidly developed over a 12 km height and traveled northeastward by the southwesterly above a height of 1 km (see Fig. 7). The continuous inflow of warm and moist air promoted the formation of new cells (Houze 1993; Kato and Goda 2001). The new cells organized the SLPS with pre-existing cells, which result in long-duration precipitation in almost the same area. The wind also veering from the lower to upper layers was a condition under which SLPSs favorably occur (not shown, Kato 2020).
5. Sensitivity experiments
We conducted sensitivity experiments with respect to environmental conditions and orography to elucidate the essential factors of the SLPS formation.
First, EXP_00 was performed with an initial condition at 0000 UTC on 1 September 2015 to understand the effects of environmental conditions. Figure 13 shows the result of EXP_00 and the difference of EPT at a height of 521 m from CTL at 1200 UTC. In EXP_00, no SLPS formed over the Kinki district (Fig. 13a). Moreover, the convergence zone found in CTL weakened, the southwesterly was dominant and the westerly was not present over the Kinki district (Fig. 13b). The differences in EPT at a height of 521 m between CTL and EXP_00 were negative in all areas of the Kinki district; especially, there were large negative values (over 9 K) from the Kii Channel to the Osaka Plain. This indicates that the inflow to the Kinki district in EXP_00 was less warm and less humid than that in CTL, which did not make the atmosphere unstable over the Kinki district. Consequently, the formation of convective cells was suppressed in EXP_00.

Previous studies have shown that the formation of SLPSs in the Kinki district was caused by orography effects such as Mount Rokko or Awaji Island (Higashi et al. 2010; Ishihara and Takara 2018). We conducted several sensitivity experiments for the orography to investigate the role of the orography surrounding Osaka Bay. Figure 14 shows the differences in accumulated 2 h precipitation amounts from 1000 UTC to 1200 UTC between CTL and the sensitivity experiments. The area with the maximum precipitation amount in all of the sensitivity experiments shifted from that in CTL. The ROKKO_100M (Fig. 14d) showed weak precipitation amounts of 5–10 mm over Mount Rokko. Particularly, the precipitation amounts on the leeward side (dashed circle) of Mount Rokko were higher than those in CTL. In AWAJI_NONE and AWAJI_0M (Figs. 14b, c), the SLPS shifted slightly to the west; however, the shape of the SLPS was similar to that in CTL. By contrast, in SHIKOKU_NONE and SHIKOKU_0M (Figs. 14e, f) the SLPS shifted to the southeast relative to CTL, and the total precipitation amounts became larger.

The MFC and horizontal wind vectors at a height of 521 m in the sensitivity experiments at 1000 UTC on 1 September 2015 are compared with those in CTL (Fig. 15). The shape and intensity of convergence zones along the west of Awaji Island in AWAJI_NONE, AWAJI_0M, and ROKKO_100M (Figs. 15b–d, respectively) were similar to those in CTL (Fig. 15a). In AWAJI_NONE (Fig. 15b), the MFC in the convergence zone became slightly smoother, and the linear shape was clearer in comparison with CTL. In AWAJI_0M (Fig. 15c), the MFC became weaker in the north of Awaji Island and over Awaji Island. In SHIKOKU_NONE and SHIKOKU_0M (Figs. 15e, f) a large convergence area found on the northwest side of Awaji Island in the other experiments shifted to the southwest of Awaji Island, and the horizontal velocity field was also different in the Kinki district. These results indicate that Shikoku Island altered the low-level wind field to determine the location of the SLPS formation.

Table 2 summarizes the results in CTL and the sensitivity experiments. Note that the EPT and MFC values were averaged within the dashed square in Fig. 15a at a height of 521 m. Accumulated 2 h precipitation amounts from 1000 UTC to 1200 UTC on 1 September 2015 were also averaged within the dashed square in Fig. 14a. All of the experiments except EXP_00 reproduced the SLPS, in which the EPT at a height of 521 m (EPT521m) exceeded 352 K. In EXP_00, the MFC at a height of 521 m (MFC521m) was significantly smaller than the other experiment, which was one of the reasons why the SLPS was not reproduced. In SHIKOKU_NONE and SHIKOKU_0M (Figs. 15e, f), the MFC521m became higher than that in CTL. It indicates that if Shikoku Island was removed, more water vapor would flow into the Osaka Bay, which could result in large precipitation amounts. Consequently, the large precipitation would generate strong convergence than that in CTL. The MFC in ROKKO_100M was similar to that in CTL, whereas in AWAJI_0M and AWAJI_NONE, the MFC was slightly weaker over Awaji Island. These results indicate that Awaji Island slightly affected the intensity of the convergence zone; however, it did not largely change the precipitation amounts.

These sensitivity experiments indicate that the orography surrounding Osaka Bay, particularly Mount Rokko (931 m height) and Awaji Island (608 m height), can modify the low-level convergence, as well as the orography in Shikoku Islands. Particularly, the location of the convergence zone shifted depending on the roughness of Awaji Island. AWAJI_0M and AWAJI_NONE showed that the difference in roughness due to land use changes influences the MFC more than the orography, as presented by Tsuguti and Kato (2014).
As mentioned above, the orography surrounding Osaka Bay slightly altered the location and precipitation amounts of the SLPS, although it was not the essential formation factor of the SLPS over the Kinki district on 1 September 2015. However, Shikoku Island altered the winds in the lower layer and the convergence zone caused by the westerly and south-southwesterly.
6. Discussion
On the basis of CTL and the sensitivity experiments, we investigated the formation mechanisms of the SLPS that occurred on 1 September 2015 in the Kinki district. In the SLPS formation mechanisms, previous studies often considered the following two essential factors for the development of convective cells; the orographic effect and large-scale forcing. This event could be caused by different formation factors from those two factors.
First, the orographic effect, which lifts low-level air (Ishihara and Takara 2018) or forms a low-level convergence zone (Kurihara et al. 2009; Takasaki et al. 2019), has been considered to be one of the essential factors in the formation of SLPSs. As shown in Fig. 1, the average heights of Mount Rokko and Awaji Island were lower than the LFC (958 m in height) of the air parcel lifted from a height of 521 m. This LFC was higher than that in the SLPS event studied by Ishihara and Takara (2018) (approximately 470 m in height). Moreover, Awaji Island did not trigger the SLPS formation in this event. According to these results, the orography surrounding Osaka Bay was not an essential factor for the SLPS formation in this event. However, SHIKOKU_NONE and SHKOKU_0M altered the pattern of low-level winds, i.e., the shape and location of the convergence zone. These results indicate that Shikoku Island blocks the low-level southwesterly.
Second, other previous studies have suggested that large-scale forcing, such as a cold front, was an essential factor for generating a convergence zone (Kato and Goda 2001; Kato 2006, 2020; Seko et al. 2006; Higashi et al. 2010; Meteorological Research Institute 2010). However, no large-scale forcings were found in the observation data and numerical experiments in this study. Figure 16 shows the EPT and horizontal wind vectors at a height of 958 m in CTL at 1030 UTC and 1130 UTC. The horizontal shear zone between the extratropical cyclone with relatively low EPT and the Pacific high-pressure system with high EPT was stagnant to the north of the Kinki district (Fig. 16a, dotted circle). It indicates that the large-scale shear was not essential for the SLPS formation mechanism in this case.

In this event, the low-level convergence between the westerly and south-southwesterly played the role of the weak forcing that led to the generation of convective cells, as in the case studied by Meteorological Research Institute (2010). To understand the essential factors of the SLPS formation in this event, we further investigated the characteristics of the south-southwesterly and westerly at low levels.
The Pacific high-pressure system located to the south of the Kinki district caused the warm and humid inflow to the Kinki district through the Kii Channel, which made the atmosphere conditionally unstable in the Kinki district. The water vapor mixing ratio in Osaka Bay below a 203 m height (34.5°N, 135.2°E) was larger than 20 g kg−1 (not shown). Under such a highly humid condition in the lower layer, weak forcing can trigger the formation of convective cells. The weak forcing maintained an average of 0.2 m s−1 in vertical velocity at a height of 958 m within the dashed square in Fig. 15a over the convergence zone from 1000 UTC to 1200 UTC.
To investigate the relationship between the westerly region associated with the extratropical cyclone and the warm and humid south-southwesterly in the Kinki district, we compared the pressure and winds at a height of 521 m in CTL between 1000 UTC and 1200 UTC on 1 September 2015 (Fig. 9) with those in EXP_00 (Fig. 17). In EXP_00, the northeast movement of the extratropical cyclone center (blue and orange points) was slower than that in CTL (red marks). Additionally, the eastward extension of the westerly region associated with the extratropical cyclone was delayed in comparison with that in CTL (Figs. 17a–c dotted circle). After 4 h (1600 UTC), a convergence zone also formed on the east coast of Awaji Island in EXP_00 when the westerly region reached Awaji Island, but the EPT521m in the south-southwesterly inflow was lower than that in CTL (around 345 K, not shown). Consequently, the atmosphere was conditionally stable, the SLPS did not form even at that time (not shown). This result indicates that not only large MFC but also high EPT521m was important for the SLPS formation.

To evaluate the environmental conditions for the SLPS formation, we used six favorable occurrence conditions proposed by Kato (2020) and examined them in all of the numerical experiments (Table 3). The parameters for the six conditions are the water vapor flux amount at a 521 m height (FLWV), distances to the LFC from the originating level of lifted air (dLFC), relative humidity at 500 hPa and 700 hPa (RH500 and RH700), SREH, synoptic-scale upward velocity (400 km mean field at 700 hPa, W700), and equilibrium level (EL) estimated from 521 m height data. Detailed descriptions of the six conditions are given in Kato (2020). This study used a 521 m vertical layer of numerical experiments, instead of a height of 500 m used in Kato (2020). In Fig. 15a, the average values of these conditions were evaluated within the square of 50 km × 50 km.

All of the conditions were satisfied for the SLPS formation at 1200 UTC on 1 September 2015 in the numerical experiments, except for EXP_00. Conversely, the SLPS could not be reproduced in EXP_00 because the conditions related to FLWV, dLFC, RH500, RH700, and EL were not satisfied. This ascertains that the water vapor at low and middle levels was more important than other factors in the present case.
7. Summary
We conducted observational data analysis and numerical experiments to study the formation mechanisms of the SLPS observed on 1 September 2015 in the Kinki district.
The upper air sounding observed low-level upstream of the SLPS occurrence area showed that CAPE and LFC were respectively large and extremely low, which means that the SLPS formed in an unstable atmosphere. The wind direction at middle levels almost corresponded with the SLPS orientation. High- and low-pressure systems were located south and north of the Kinki district, respectively. Consequently, the strong southwesterly was present in the middle layer over the Kinki district. Unlike previous studies, a large-scale frontal system, such as a cold front or a stationary front, was not observed in the Kinki district.
From the numerical experiments, we found that the SLPS was formed by the low-level convergence of the westerly with the warm and moist south-southwesterly in the Kinki district. New cells successively formed over the north of Awaji Island traveled by the middle-level southwesterly, and consequently, the SLPS formed in the Kinki district. The sensitivity experiments for the orography showed that Mount Rokko and Awaji Island were not essential for the SLPS formation, although they modulated the location of the SLPS. From the sensitivity experiments for the initial time, we found that one of the essential factors for the SLPS formation was the abundant supply of water vapor transported by the south-southwesterly through the Kii Channel. This south-southwesterly reached Osaka Bay, and converged with the westerly associated with the extratropical cyclone. Additionally, the sensitivity experiment for Shikoku Island showed that the topography of Shikoku Island dammed the south-southwesterly, and consequently, the location and precipitation amounts of the SLPS were modulated.
The SLPS formation mechanisms on 1 September 2015 were summarized as follows. First, a low-level convergence zone formed between the westerly and the warm and humid south-southwesterly in the Kinki district. The south-southwesterly flowed along the edge of the Pacific high-pressure system through the Kii Channel. Conversely, the westerly region was found associated with an extratropical cyclone located in the north of Japan. Second, convective cells successively formed in the convergence zone where the atmosphere was conditionally unstable because of the inflow of the low-level warm and moist south-southwesterly. Third, the successively formed convective cells traveled downstream (northeast) by the middle-level southwesterly. The second and third processes were repeated, and consequently, the SLPS was formed in the Kinki district.
In this study, we investigated one case of SLPSs in the Kinki district. For a more comprehensive understanding of the formation mechanisms of SLPSs in the Kinki district, analyses and simulations of other SLPS events are necessary. While focusing on the mechanisms of the SLPS formation in this study, it is necessary to further study the detailed effect of the surrounding orography, such as Awaji Island or Mount Rokko, on the distribution and intensity of the precipitation. These are our future issues.
Acknowledgment
The authors thank Prof. T. Kato of the Meteorological College/Japan Meteorological Agency and two anonymous reviewers for their invaluable comments to improve the manuscript. All the computations of the numerical simulations and experiments were performed on the supercomputer of the Information Technology Center, Nagoya University. The observational data and initial condition data of the numerical experiments were provided by the Japan Meteorological Agency. The skew T-log P in the study is the data from Wyoming University (http://weather.uwyo. edu/upperair/sounding.html). This work was jointly supported by KAKENHI Grants 15H05765 and 16H06311 and the Virtual Laboratory for the Earth's Climate Diagnostics program.
References
- Banacos, P. C., and D. M. Schultz,, 2005: The use of moisture flux convergence in forecasting convective initiation: Historical and operational perspectives. Wea. Forecasting, 20, 351-366.
- Bluestein, H. B., and M. H. Jain, 1985: Formation of mesoscale lines of precipitation: Severe squall lines in Oklahoma during the spring. J. Atmos. Sci., 42, 1711-1732.
- Gallus, W. A., Jr., N. A. Snook, and E. V. Johnson, 2008: Spring and summer severe weather reports over the Midwest as a function of convective mode: A preliminary study. Wea. Forecasting, 23, 101-113.
- Higashi, K., Y. Kiyohara, M. D. Yamanaka, Y. Shibagaki, M. Kusuda, and T. Fujii, 2010: Multiscale features of line-shaped precipitation system generation in central Japan during late baiu season. J. Meteor. Soc. Japan, 88, 909-930.
- Houze, R. A., Jr., 1993: Cloud Dynamics. International Geophysics Series, No. 53, Academic Press, 573 pp.
- Ishihara, M., and K. Takara, 2018: The rainstorm generated around Uji, Kyoto on 13–14 August 2012 Part I: Mesoscale analysis of the convective line systems causing heavy rainfall. Tenki, 65, 5-23 (in Japanese).
- Japan Meteorological Agency, 2013: Outline of the operational numerical weather prediction at the Japan Meteorological Agency. 201 pp. [Available at https://www.jma.go.jp/jma/jma-eng/jma-center/nwp/outline2013-nwp/index.htm.]
- Kato, T., 2006: Structure of the band-shaped precipitation system inducing the heavy rainfall observed over northern Kyushu, Japan on 29 June 1999. J. Meteor. Soc. Japan, 84, 129-153.
- Kato, T., 2020: Quasi-stationary band-shaped precipitation systems, named as “senjo-kousuitai”, causing localized heavy rainfall in Japan. J. Meteor. Soc. Japan, 98, 485-509.
- Kato, T., and H. Goda, 2001: Formation and maintenance processes of a stationary band-shaped heavy rainfall observed in Niigata on 4 August 1998. J. Meteor. Soc. Japan, 79, 899-924.
- Kurihara, K., T. Kanamori, and H. Seko, 2009: Band-shaped precipitation system observed in Hiroshima on 18 July 2003―Airflow structure and the effects of terrain and middle-level dry air analyzed by JMANHM―. Tenki, 56, 613-626 (in Japanese).
- Meteorological Research Institute, 2010: Studies on formation process of line-shaped rainfall systems and predictability of rainfall intensity and moving speed. Technical Report of the Meteorological Research Institute, 159 pp (in Japanese).
- Ogura, Y., 1991: Analyses and mechanism of intense precipitation. Tenki, 38, 276-288 (in Japanese).
- Parker, M. D., and R. H. Johnson, 2000: Organizational modes of midlatitude mesoscale convective systems. Mon. Wea. Rev., 128, 3413-3436.
- Schultz, D. M., P. N. Schumacher, and C. A. Doswell III, 2000: The intricacies of instabilities. Mon. Wea. Rev., 128, 4143-4148.
- Schumacher, R. S., and R. H. Johnson, 2005: Organization and environmental properties of extreme-rain-producing mesoscale convective systems. Mon. Wea. Rev., 133, 961-976.
- Seko, H., and H. Nakamura, 2003: Numerical study of the shapes and maintenance mechanisms of meso-β scale line-shaped precipitation system in the middle-latitudes. CAS/JSC WGNE Res. Activ. Atmos. Oceanic Modell., 33, 05-30-05-31.
- Seko, H., Y. Kumahara, and K. Saito, 2006: Line-shaped convective band developed over the Osaka plain. CAS/JSC WGNE Res. Activ. Atmos. Oceanic Modell., 36, 5.53-5.54.
- Takasaki, Y., M. Yoshizaki, A. Suzuki-Parker, and Y. Watarai, 2019: Sensitivity of quasi-stationary band-shaped precipitation system to topography: A case study for 28 August 2008 Okazaki heavy rainfall event. J. Meteor. Soc. Japan, 97, 453-466.
- Tsuboki, K., and A. Sakakibara, 2002: Large-scale parallel computing of cloud resolving storm simulator. High Performance Computing. Zima, H. P., K. Joe, M. Sato, Y. Seo, and M. Shimasaki (eds.), Springer, Berlin, Heidelberg, 243-259.
- Tsuboki, K., and A. Sakakibara, 2007: Numerical prediction of high-impact weather systems. The Textbook for Seventeenth IHP Training Course in 2007. The Hydrospheric Atmospheric Research Center (HyARC), Nagoya University, and United Nations Educational Scientific and Cultural Organization (UNESCO), 292 pp. [Available at http://www.hyarc.nagoya-u.ac.jp/japanese/02activity/ihp/textbook/17th-Numerical_Prediction_for_High_Impact_Weather_Systems.pdf.]
- Tsuguti, H., 2016: Line-shaped precipitation system. Tenki, 63, 727-729 (in Japanese).
- Tsuguti, H., and T. Kato, 2014: Objective extraction of heavy rainfall events and statistical analysis on their characteristic features. Tenki, 61, 455-469 (in Japanese).
- Unuma, T., and T. Takemi, 2016: A role of environmental shear on the organization mode of quasi-stationary convective clusters during the warm season in Japan. SOLA, 12, 111-115.


