Article
Relaxation Experiments for Predictability Assessment of Enhanced Monsoon Trough in Late August 2016

2021 Volume 99 Issue 2 Pages 459-472

Details
2021 Volume 99 Issue 2 Pages 459-472
This study assesses the predictability of an enhanced monsoon trough south of Japan in late August 2016, which is accompanied by Rossby wave propagation over Eurasia and a consequent anticyclonic Rossby wave breaking east of Japan, with a relaxation technique using an atmospheric general circulation model. Three types of the relaxation experiments are conducted, with nudging the model forecast in the upper troposphere toward reanalysis, for regions of the Rossby wave breaking east of Japan, the Rossby wave propagation over Eurasia, and both the regions from Eurasia to the east of Japan. All types of the relaxation experiments show improved reproducibility of the enhanced monsoon trough, which the operational one-month ensemble prediction in Japan Meteorological Agency failed to predict. Compared with a result of a control experiment, the relaxation experiments show the more amplified Rossby wave propagation over Eurasia and Rossby wave breaking east of Japan, as seen in the reanalysis. The upper-level wave amplification contributes to the improved reproducibility of the enhanced monsoon trough, through that of southwestward intrusion of upper-level high potential vorticity airmass toward the southeast of Japan. The results of relaxation experiments indicate primary and secondary contributions from corrected forecast errors of the Rossby wave breaking east of Japan and the Rossby wave propagation over Eurasia to the predictability of the monsoon trough, respectively. Their relative contributions to the enhanced monsoon trough are consistent with a result of ensemble-based simple sensitivity analysis shown in a related previous study.
The monsoon trough from the South China Sea to the east of the Philippines is climatologically enhanced in summer in association with strong convergence in the lower troposphere due to monsoon westerlies and trade winds (e.g., Chan and Evans 2002; Tomita et al. 2004). An enhancement of the monsoon trough is frequently accompanied by typhoon formations over the tropical western North Pacific (WNP) (e.g., Takemura et al. 2017; Jinno et al. 2019) and has large impacts on summer climate over East Asia (e.g., Molinari and Vollaro 2013; Wu et al. 2012, 2013).
The enhancement of the monsoon trough is associated not only with tropical large-scale atmospheric and oceanographic variabilities such as the Madden–Julian Oscillation (MJO), the El Niño Southern Oscillation (Molinari and Vollaro 2017) but also with Rossby wave breaking (RWB) near the Asian jet exit region. Takemura et al. (2017) showed by a case study on the RWB case in August 2016 that an equatorward intrusion of high potential vorticity (PV) airmass due to the RWB east of Japan can promote an enhanced convection over the subtropical WNP through dynamically induced ascent. Takemura and Mukougawa (2020) showed a process from their lag composite analysis that Rossby wave propagation along the Asian jet (Lu et al. 2002; Enomoto et al. 2003) induces the RWB east of Japan and the consequent southwestward intrusion of high PV airmass toward the subtropical WNP. They further showed that the high PV intrusion and the consequent enhanced convection over the region can excite the Pacific–Japan (PJ) pattern (Nitta 1987; Kosaka and Nakamura 2006) based on the mechanism suggested by Takemura et al. (2017). The PJ pattern is accompanied by lower-level cyclonic (anticyclonic) circulation anomalies near the Philippines (Japan), which is accompanied by the enhanced monsoon trough to the south of Japan. These results indicate that atmospheric variability in mid-latitude also can affect the enhanced convection over the subtropical WNP and the consequent enhancement of the monsoon trough.
Although a precise prediction of the monsoon trough by medium- to long-range operational forecasts in boreal summer will largely contribute to reducing the socioeconomic impacts of anomalous weather conditions, it remains a challenging task after considerably improving the quality of numerical forecast with high-resolution models. Takemura et al. (2020) examined the predictability of the enhanced monsoon trough south of Japan in late August 2016 and showed that operational one-month ensemble forecasts in Japan Meteorological Agency (JMA) during middle August failed to predict the enhanced monsoon trough. They also performed an ensemble-based simple sensitivity analysis (Enomoto et al. 2015), indicating that initial perturbations over sensitive regions of the Bering sea and near the Asian jet entrance region can contribute to the improvement of the predictability of the enhanced monsoon trough in late August 2016. They further conducted the associated hind-cast experiments with the initial perturbations over the sensitive regions, revealing impacts of efficient growth and downstream propagation of perturbations on the enhanced monsoon trough. Although their hindcast experiments showed reduced forecast errors of the enhanced monsoon trough, the intensity of the monsoon trough in the experiments remained largely underestimated compared with that in the reanalysis. It is highly expected from these results that a reproducibility of the enhanced monsoon trough can be greatly improved by reduced forecast errors of the Rossby wave propagation over Eurasia and the RWB east of Japan during the time integration period in the experiments.
One of the valid methods to assess the impacts of the reduced upstream forecast errors is a relaxation technique (e.g., Magnusson 2017). This technique is to nudge the model forecast over a certain region toward the “truth” such as a reanalysis during the time integration period and assess downstream impacts. Jung et al. (2010a, b) and Jung et al. (2014) performed relaxation experiments using medium- to long-range forecast models to examine the impact of atmospheric circulations in tropics and high latitudes on mid-latitude circulations due to the teleconnection patterns. For a shorter timescale, Lamberson et al. (2016) also applied the relaxation technique to investigate the predictability of a rapidly enhanced extra-tropical cyclone over western Europe, which the medium-range forecast failed to predict. A simpler method to assess the impacts of the forecast errors could be done by comparing ensemble members with large and small forecast errors (Magnusson 2017). This ensemble-based method, by contrast, will provide us a quite limited understanding of the origins of the forecast errors, because all ensemble members failed to predict the enhanced monsoon trough in the case of late August 2016 (Takemura et al. 2020).
Based on the abovementioned studies, this study conducts the relaxation experiments using the JMA's Global Spectrum Model (GSM) to assess a causal relationship of the forecast errors of the Rossby wave propagation over Eurasia and the RWB east of Japan with the failed prediction of the enhanced monsoon trough in late August 2016. This line of approach will be important to increase our knowledge of the origins of forecast errors in mid-latitudes and their influences on the tropical atmospheric circulation.
The paper is arranged as follows. The reanalysis dataset, models used, and analysis methods are described in Section 2. In Section 3, we revisit the atmospheric circulation from Eurasia to the WNP during the period from middle to late August 2016 using the reanalysis dataset, according to Takemura et al. (2020). In Section 4, to assess the impacts of the corrected forecast errors from Eurasia to the east of Japan in the upper troposphere on the reproducibility of the enhanced monsoon trough, we show the results of the relaxation experiments using the JMA's GSM. In Section 5, we quantitatively assess the reproducibility of atmospheric circulation over the WNP in the lower troposphere, including the enhanced monsoon trough. The main findings in this study are summarized in Section 6.
The data used in this study are the 6 hourly and daily mean datasets of the Japanese 55 year reanalysis (JRA-55) for August 2016 and during the 30 year period from 1981 to 2010, with a horizontal resolution of 1.25° and 37 pressure levels (Kobayashi et al. 2015). To infer convective activities, interpolated outgoing longwave radiation (OLR) (Liebmann and Smith 1996) provided by the National Oceanic and Atmospheric Administration is used. Here, anomalies are defined as a departure from the climatology, which is obtained as the 60 day low-pass filtered 30 year daily averages from 1981 to 2010 using the Lanczos filter (Duchon 1979).
The propagation of Rossby wave packet is analyzed using the wave activity flux (WAF) defined by Takaya and Nakamura (2001). The horizontal component of WAF is defined as follows:
 |
To assess impacts of corrected forecast errors from Eurasia to the east of Japan in the upper troposphere on the reproducibility of the enhanced monsoon trough, relaxation experiments with 25 ensemble members are conducted using the JMA's GSM version 1705. The relaxation technique is a method to nudge the model forecast over specific areas (hereafter referred to as “nudging areas”) toward the 6 hourly reanalysis (i.e., the JRA-55) interpolated linearly with time during the time integration period (e.g., Ding et al. 2015; Magnusson 2017), as briefly introduced in Section 1. The forecast error of the enhanced monsoon trough will be improved by the nudging if it originates in the nudging areas and the errors over the nudging areas propagate toward the south of Japan during the time integration period. To nudge the model forecast toward the reanalysis, the following extra term is added to the model equations:
 |
To extract low-frequency components including quasi-stationary Rossby waves, the 5 day running mean is applied to the daily data of the reanalysis and the results of the relaxation experiments.
Based on Takemura et al. (2020), the upper- and lower-tropospheric stream function anomalies, 360 K isentropic PV in the reanalysis, and OLR anomalies during the period from 18 to 23 August 2016 are briefly revisited in Fig. 1. In the upper troposphere, the Rossby wave propagation accompanied by the meandered Asian jet is persistently seen over the area from Eurasia to the east of Japan during the period (Figs. 1a, d, g, j). The upper-level strong wave propagation contributes to the persistent ridge east of Japan and the enhanced trough south of Alaska, accompanied by an anticyclonic RWB occurrence with a meridional overturning of the upper-level PV after 20 August (Figs. 1e, h, k). The consequent southwestward intrusion of the upper-level high PV airmass from south of Alaska toward the southeast of Japan contributes to enhanced convection southeast of Japan (purple contour in Figs. 1h, k) through dynamically induced ascent (Takemura et al. 2017).

Five-day running mean (left) 200 hPa stream function (contour; unit: 106 m2 s−1) and the anomalies (shading), (middle) 360 K potential vorticity (shading; unit: PVU) and negative OLR anomalies (purple contour) at intervals of 15 W m−2, and (right) 850 hPa stream function (contour) and the anomalies (shading). The WAF (unit: m2 s−2) is indicated by vectors on the left and right panels. Black shadings in the right panels indicate regions with altitudes exceeding 1,600 m. (a, b, c) 18 August, (d, e, f) 20 August, (g, h, i) 22 August, and (j, k, l) 23 August 2016. From Takemura et al. (2020).
In the lower troposphere, the enhanced anomalous cyclonic circulation south of Japan in middle August (Fig. 1c) once weakens on 20 August (Fig. 1f) and then amplifies again after 22 August (Figs. 1i, l), indicating the persistent monsoon trough. The enhanced anomalous cyclonic circulation can be explained as a Rossby wave response to heat sources associated with the enhanced convection southeast of Japan (Figs. 1h, k) (Takemura et al. 2017). Meanwhile, a persistent anomalous anticyclonic circulation is clearly seen east of Japan (Figs. 1c, f, i, l), corresponding to an extended North Pacific subtropical high toward the east of Japan. These anomalous circulations in the lower troposphere indicate southwest–northeast-oriented dipole anomalies over the WNP, which corresponds to a northeastward shifted PJ-like pattern.
The JMA's operational ensemble prediction with an initial time of 16 August 2016 underestimated the intensity of the Rossby wave propagation and the RWB east of Japan and consequently failed to predict the enhanced monsoon trough in late August 2016 (Takemura et al. 2020). Hereafter, a lead time of +7 day (23 August 2016), which is a verification time defined by Takemura et al. (2020) in their ensemble-based simple sensitivity analysis (Enomoto et al. 2015), is mainly focused to assess the predictability of the enhanced monsoon trough.
To assess the causal relationship between the forecast errors from Eurasia to the east of Japan in the upper troposphere and the failed prediction of the enhanced monsoon trough in late August 2016, the relaxation technique is applied using an atmospheric general circulation model (JMA's GSM). Here, we performed the three types of relaxation experiments, with the nudging areas (Fig. 2) of the RWB east of Japan (150°E–160°W, 30–70°N; red line in Fig. 2; RWB-exp), the Rossby wave propagation over Eurasia (30–150°E, 30–70°N; blue line in Fig. 2; EWP-exp), and both the regions from Eurasia to the east of Japan (30°E–160°W, 30–70°N; green line in Fig. 2; BTH-exp), above a pressure level of 500 hPa. The nudging areas in the RWB-exp and EWP-exp include the sensitive regions, which is obtained from the simple sensitivity analysis performed in Takemura et al. (2020). According to the nudging technique described in (2), the RWB-exp still includes forecast errors over the nudging areas of the RWB during the time integration period. The forecast errors over the RWB are expected to be further reduced by the decreased forecast errors of the Rossby wave propagation along the Asian jet (i.e., the EWP-exp). The BTH-exp thus represents an accumulated effect of the reduced forecast errors for the Rossby wave propagation along the Asian jet and the RWB east of Japan. Differences in the ensemble mean between the relaxation experiment and a non-relaxation (i.e., control) experiment (CTL-exp) can be identified as atmospheric responses to the nudgings, which are simply referred to as “response”. The significance of the ensemble mean response is estimated via Welch's t-test.

Nudging areas in relaxation experiments (solid lines) and target areas to assess the reproducibility of atmospheric circulation in the lower troposphere (dashed lines). Areas surrounded by red, blue, and green solid lines denote the nudging areas in RWB-exp, EWP-exp, and BTH-exp, respectively. Areas surrounded by orange bold and pink thin dashed lines labeled by “A” and “B” denote the areas to assess the reproducibility of monsoon trough and northeastward shifted PJ pattern, respectively.
To first examine the forecast errors of the monsoon trough in the CTL-exp in the lead time of +7 day (i.e., 23 August 2016), Fig. 3 shows the differences in 850 hPa stream function between the ensemble mean of the CTL-exp and the reanalysis. The lower-level stream function clearly shows its positive forecast errors south of Japan (shading in Fig. 3), corresponding to underestimated strength of the monsoon trough with the weaker eastward extension of cyclonic circulation along the latitudinal band of 20°N (contour in Fig. 3) compared with the reanalysis. The forecast error of the lower-level stream function, by contrast, shows its negative values east of Japan associated with underestimated extension of the North Pacific subtropical high toward the region. These forecast errors show a southwest–northeast-oriented dipole pattern, which has an opposite sign to the anomalies in the reanalysis (shading in Fig. 1l), indicating the underestimated PJ-like pattern.

Forecast error of the 5 day mean 850 hPa stream function in the lead time of +7 day (23 August 2016) in CTL-exp (shading; unit: 106 m2 s−1), which is defined as differences between the ensemble mean and reanalysis. Contours denote the ensemble mean of the 850 hPa stream function in the CTL-exp. Black shading indicates regions with altitudes exceeding 1,600 m.
Although the forecast error in the CTL-exp (Fig. 3) shows a similar pattern to that in the JMA's operational one-month ensemble forecast, the distribution is slightly different over a wide area of the WNP between them (not shown). It is presumed that the difference in the version of the model between the operational forecast and the CTL-exp in this study is one of the factors of this difference in the forecast errors. The difference in the dataset used for the initial conditions between the operational forecast (GANAL: Global objective analysis data) and the CTL-exp (i.e., the JRA-55) may also influence the difference of the forecast errors.
4.2 Results of RWB-expFigure 4 shows the responses of the upper- and lower-tropospheric stream function anomalies, 360 K isentropic PV, and precipitation in the RWB-exp from the initial time of 12 UTC 16 August until the lead time of +7 day (23 August). The stream function at 200 hPa in the nudging area (surrounded by green dashed lines in left panels) shows amplified responses with the lead time, with significant positive responses over the ridge east of Japan and significant negative ones over the trough south of Alaska (Figs. 4a, d, g, j). These responses indicate the corrected forecast errors of the RWB east of Japan, resulting from the nudging toward the reanalysis. The negative response of the stream function south of Alaska in the upper troposphere further shows southwestward extension toward the south of the ridge east of Japan from the lead times of +4 day to +6 day (Figs. 4d, g). The extension of the upper-level negative stream function response corresponds to the southwestward intrusion of upper-level high PV airmass toward the southeast of Japan (shadings in Figs. 4b, e, h, k). The upper-level high PV intrusion is associated with significant positive responses of precipitation (i.e., enhanced convection) southeast of Japan (purple contours in middle panels of Fig. 4), as with the reanalysis (middle panels of Fig. 1).

(left) Five-day running mean 200 hPa stream function (contour; unit: 106 m2 s−1) and the responses (shading), (middle) 360 K potential vorticity (shading; unit: PVU) and responses of positive daily precipitation (purple contour) with intervals of 5 mm, and (right) the 5 day running mean 850 hPa stream function (contour) and the responses (shading), for RWB-exp. Dots denote the significant responses of (left, right) stream function and (middle) positive precipitation with a confidence level of 99 %. The area surrounded by green dashed lines in the left panels denote the nudging area. Black shadings in the right panels indicate regions with altitudes exceeding 1,600 m. Each panel shows lead times of (a, b, c) +2 day (18 August), (d, e, f) +4 day (20 August), (g, h, i) +6 day (22 August), and (j, k, l) +7 day (23 August).
The 850 hPa stream function shows amplified significant negative responses from Japan to the south (shadings in Figs. 4c, f, i, l) in association with the Rossby wave response to the enhanced convection southeast of Japan. The eastward extended trough toward the dateline (contours in Figs. 4c, f, i, l) is also clearly seen in the lower troposphere associated with the enhanced convection along a latitudinal band of 20°N. These lower-level negative stream function responses indicate an improved forecast of the enhanced monsoon trough resulting from the nudging. The lower-level circulation further shows significantly amplified positive responses east of Japan, corresponding to the enhanced extension of the North Pacific subtropical high toward the east of Japan. These lowerlevel responses show the northeastward shifted PJ-like pattern, contributing to the cancelation of the lower-level forecast errors with the underestimated pattern (Fig. 3).
To assess the forecast error and the reproducibility of the monsoon trough, Fig. 5 shows the daily time series of areal-averaged 850 hPa relative vorticity over region “A” (surrounded by orange bold dashed lines in Fig. 2) from the initial time to the lead time of +9 day. In the reanalysis (black line in Fig. 5), the lower-level positive vorticity south of Japan clearly increases after the lead time of +5 day, consistent with the enhanced monsoon trough (Figs. 1i, l). The lower-level vorticity represented by the ensemble mean in the CTL-exp (blue dashed bold line) fails to reproduce the rapidly enhanced monsoon trough, particularly after the lead time of +6 day. The difference in the lower-level vorticity between the ensemble mean of the CTL-exp and the reanalysis consequently amplifies after the lead time of +6 day, resulting in the large forecast errors (Fig. 3). The RWB-exp (red dashed bold line), by contrast, shows the increasing lower-level vorticity associated with the more enhanced monsoon trough after the lead time of +5 day, compared with the CTL-exp. The smaller ensemble spread of the lower-level vorticity in the RWB-exp (red error bars) during the time integration period, compared with that in the CTL-exp (blue error bars), is due to the nudging toward the reanalysis to the east of Japan in the upper troposphere. This result indicates that the corrected forecast errors of the RWB east of Japan can contribute to the improved reproducibility of the enhanced monsoon trough in late August 2016, through the reproduced upper-level high PV intrusion caused by the RWB.
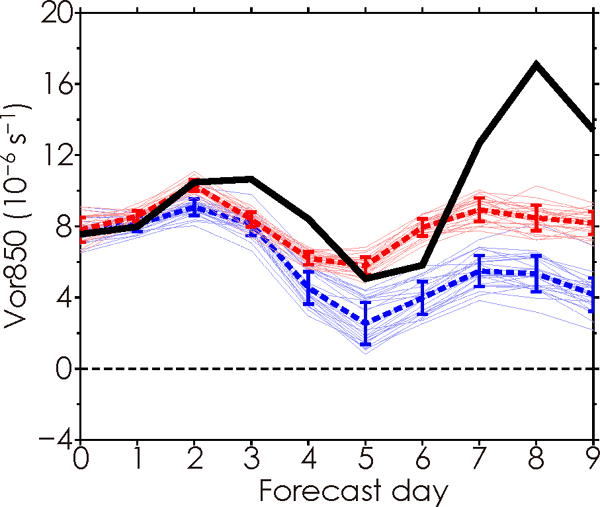
Daily time series of 850 hPa relative vorticity (unit: 10−6 s−1) averaged over the region of [15–30°N, 125–150°E] (region “A” in Fig. 2) in reanalysis (black bold line), all ensemble members (red thin lines) and the ensemble mean (red dashed bold line) for RWB-exp, and all ensemble members (blue thin lines) and the ensemble mean (blue dashed bold line) for CTL-exp from the initial time to the lead time of +9 day (25 August 2016). Error bars denote the ensemble spread represented by the standard deviation between the ensemble members.
Figure 6 shows the responses of the atmospheric circulations in the EWP-exp. The 200 hPa stream function from the nudging area (surrounded by green dashed lines in left panels) shows amplified responses with the lead time, with significant responses of wave train over Eurasia (Figs. 6a, d, g, j). A positive response of the upper-level stream function is also significantly amplified over the persistent ridge east of Japan, indicating a downstream influence of the corrected forecast errors from Eurasia on the RWB. These corrected forecast errors of the Rossby wave propagation over Eurasia and the RWB east of Japan can promote the strong southwestward intrusion of high PV airmass toward the southeast of Japan (shadings in Figs. 6b, e, h, k). The upper-level high PV intrusion is further associated with significantly enhanced convection southeast of Japan (middle panels of Fig. 6).

Same as in Fig. 4 but for the EWP-exp.
The 850 hPa stream function shows significantly amplified negative responses south of Japan (shadings in Figs. 6c, f, i, l) associated with the Rossby wave response to the enhanced convection southeast of Japan, indicating the improved reproducibility of the enhanced monsoon trough. The lower-level responses of the stream function from the south to the east of Japan also show the northeastward shifted PJ-like pattern, contributing to reducing the forecast errors in the lower troposphere over the region (Fig. 3).
Figure 7 shows the daily time series of an areal average of 850 hPa relative vorticity over region “A” until the lead time of +9 day in the EWP-exp. The lower-level vorticity in the EWP-exp (red dashed bold line) shows the rapidly increased and higher values from the lead times of +7 day to +8 day in association with the enhanced monsoon trough, compared with the CTL-exp (blue dashed bold line). The ensemble spread of the lower-level vorticity in the EWP-exp is quite small resulting from the nudging toward the reanalysis over Eurasia in the upper troposphere. These results indicate that the corrected forecast errors of the Rossby wave propagation over Eurasia also can contribute to the improved reproducibility of the enhanced monsoon trough in late August 2016, through the reproduced RWB and the consequent southwestward intrusion of the upper-level high PV airmass.

Same as in Fig. 5 but for the EWP-exp.
To examine the accumulated contribution of the Rossby wave propagation over Eurasia and the RWB east of Japan to the reproducibility of the enhanced monsoon trough, Fig. 8 further shows the responses of the atmospheric circulations in the BTH-exp. The 200 hPa stream function from the nudging area (surrounded by green dashed lines in the left panels) shows amplified responses with the lead time, with significant responses of wave train over Eurasia and the RWB east of Japan (Figs. 8a, d, g, j). These corrected forecast errors of the Rossby wave propagation over Eurasia and the RWB east of Japan can promote the strong southwestward intrusion of high PV airmass toward the southeast of Japan (shadings in Figs. 8b, e, h, k). The upper-level high PV intrusion is further associated with significantly enhanced convection southeast of Japan (middle panels of Fig. 8).

Same as in Fig. 4 but for the BTH-exp.
The amplified significant negative responses of the 850 hPa stream function south of Japan (shadings in Figs. 8c, f, i, l), which are resulting from the enhanced convection over the southeast of Japan, are more clearly seen compared with those in the RWB-exp and EWP-exp. The eastward extended trough toward the dateline (contours in Figs. 8c, f, i, l) is clearly seen along the latitudinal band of 20°N in the lower troposphere. These lower-level responses indicate greatly improved reproducibility of the enhanced monsoon trough. The lower-level responses from the south to the east of Japan also show the northeastward shifted PJ-like pattern, canceling the lower-level forecast errors (Fig. 3).
Figure 9 shows the daily time series of areal-averaged 850 hPa relative vorticity over region “A” until the lead time of +9 day in the BTH-exp. The lower-level vorticity south of Japan in the BTH-exp (red dashed bold line in Fig. 9) indicates the highest values among the three types of the relaxation experiments after the lead time of +7 day in association with the enhanced monsoon trough. The ensemble spread of the lower-level vorticity in the BTH-exp is quite small, as with the EWP-exp, resulting from the nudging toward the reanalysis from Eurasia to the east of Japan in the upper troposphere. These results indicate that the accumulated correction of forecast errors for the Rossby wave propagation over Eurasia and the RWB east of Japan can largely improve the reproducibility of the enhanced monsoon trough in late August 2016.

Same as in Fig. 5 but for the BTH-exp.
This section quantitatively compares the reproducibility of the lower-level atmospheric circulation, which includes the enhanced monsoon trough, between each type of the relaxation experiments. To assess the improved forecast errors of the lower-level circulation pattern from the south to the east of Japan, Table 1 shows the pattern correlations of the 850 hPa stream function between the responses (Figs. 4l, 6l, 8l) and the forecast error (Fig. 3) over region “B” (surrounded by pink thin dashed lines in Fig. 2) in the lead time of +7 day. The responses of the 850 hPa stream function in the RWB-exp, EWP-exp, and BTH-exp show large negative pattern correlations of −0.77, −0.78, and −0.90, respectively. The correlation coefficient in the BTH-exp is highest among the three types of relaxation experiments. This result quantitatively shows the greatly improved reproducibility of the northeastward shifted PJ pattern resulting from the corrected forecast error of the Rossby wave propagation over Eurasia and the RWB east of Japan, as described in Subsection 4.4. The pattern correlation coefficients of the responses with the anomaly of the reanalysis further show significantly large positive values, particularly in the highest for the BTH-exp (+0.92). The high pattern correlations indicate that the responses correspond to the lower-level anomalous circulation associated with the northeastward shifted PJ pattern in the reanalysis.

To further examine the impacts of the nudging on the improved reproducibility of the enhanced monsoon trough, Table 2 shows the relative errors of the 5 day running mean 850 hPa relative vorticity averaged over south of Japan (region “A” in Fig. 2) for the lead time of +7 day in the relaxation experiments and their degrees of improvement. The lead time of +7 day is based on the verification time defined by Takemura et al. (2020) as described at the end of Section 3. Here, the relative error is calculated based on the re-analysis (black lines in Figs. 5, 7, 9), and the degree of improvement is defined as a difference in the relative error between each relaxation experiment (red dashed bold lines in Figs. 5, 7, 9) and the CTL-exp (blue dashed bold lines in the figures). The relative error of the monsoon trough in the CTL-exp is −60.1 %, indicating the largely underestimated strength of the monsoon trough as described in Fig. 3. The RWB-exp, EWP-exp, and BTH-exp show reduced relative errors of −26.8, −34.5, and −12.5 % compared with the CTL-exp, respectively, although the strengths remain to be underestimated compared with the reanalysis. The reduced relative errors correspond to the improved reproducibility of the enhanced monsoon trough resulting from the nudging. The smallest negative relative error in the BTH-exp quantitatively indicates the accumulated contribution of the Rossby wave propagation over Eurasia and the RWB east of Japan to the largely improved reproducibility of the monsoon trough. The relative contributions from each nudging area to the improved reproducibility of the monsoon trough can be estimated from the degrees of improvement, which are higher in the order of the BTH-exp, RWB-exp, and EWP-exp. These results indicate primary and secondary contributions from the RWB east of Japan and the Rossby wave propagation over Eurasia, respectively. Their relative contributions are consistent with the result of the ensemble-based simple sensitivity analysis with the verification time of +7 day (23 August 2016) in Takemura et al. (2020), who indicated the primary and secondary contributions from initial perturbations near the RWB east of Japan and the Asian jet entrance region to the predictability of the enhanced monsoon trough, respectively.

This study examined the predictability of the enhanced monsoon trough south of Japan in late August 2016, which is accompanied by the Rossby wave propagation over Eurasia and the consequent anticyclonic RWB east of Japan, by the relaxation technique using the JMA's GSM. The three types of relaxation experiments were conducted, with nudging the model forecast above a pressure level of 500 hPa toward the reanalysis, for the nudging areas of the RWB east of Japan (RWB-exp), the Rossby wave propagation over Eurasia (EWP-exp), and both the regions from Eurasia to the east of Japan (BTH-exp).
The responses in the relaxation experiments, which are defined as the difference between each relaxation experiment and the non-relaxation (i.e., CTL-exp) experiment with the initial time of 12 UTC 16 August 2016, showed the amplified Rossby waves in the upper troposphere with the Rossby wave propagation over Eurasia and the RWB east of Japan, due to the nudging to the reanalysis. The upper-level amplified waves could subsequently promote the strong southwestward intrusion of upper-level high PV airmass toward the southeast of Japan and the resultant enhanced convection over the region. Consequently, all relaxation experiments showed the improved reproducibility of the enhanced monsoon trough after the lead time of +5 day, which JMA's operational one-month ensemble prediction failed to predict. The reproduced enhancement of the monsoon trough in both the RWB-exp and EWP-exp indicates that the enhanced monsoon trough is closely associated with not only the RWB east of Japan (RWB-exp) but also the upstream meandered Asian jet (EWP-exp). This result also indicates an essential contribution of the linking process between the Rossby wave propagation along the Asian jet and the enhanced convection over the subtropical WNP (Takemura et al. 2017; Takemura and Mukougawa 2020) to the predictability of the enhanced monsoon trough. The BTH-exp further showed the greatest reproducibility of the enhanced monsoon trough, indicating the accumulated contribution from the corrected forecast errors of the Rossby wave propagation over Eurasia and the RWB east of Japan to the predictability of the monsoon trough.
The pattern correlation of the responses with the forecast error as well as the anomaly of the reanalysis from the south to the east of Japan was examined to quantitatively assess the reproducibility of the lower-level atmospheric circulation in the RWB-exp, EWP-exp, and BTH-exp. The correlation coefficients for the three types of relaxation experiments were significantly high particularly in the BTH-exp, indicating the cancelation of the forecast error of the lower-level circulation pattern due to the nudging. The relative errors for the strength of the monsoon trough were also largely reduced in the order of the BTH-exp, RWB-exp, and EWP-exp, compared with the CTL-exp. The corrected forecast errors of the RWB east of Japan and the Rossby wave propagation over Eurasia indicated the primary and secondary contributions to the improved reproducibility of the monsoon trough, respectively. Their relative contributions were consistent with the role of primary and secondary singular vectors (SVs) obtained by the ensemble-based simple sensitivity analysis shown in Takemura et al. (2021).
This case study in late August 2016 suggests that the corrected forecast errors of the atmospheric variability in mid-latitudes can largely contribute to the reproducibility of the enhanced monsoon trough. The residual underestimation of the enhanced monsoon trough, which cannot be explained by the relaxation experiments in this study, may be caused by forecast errors in tropics. Although the contribution from the tropics will be lower than that from the mid-latitudes in this case, the investigation of the subordinate SV modes obtained from the ensemble-based sensitivity analysis (Takemura et al. 2021) and the related numerical experiments may provide us a further physical understanding of the predictability of the enhanced monsoon trough.
The authors are very grateful to an editor Dr. Hiroshi G. Takahashi and two anonymous reviewers for their constructive and helpful comments. The GSM to conduct the relaxation experiments was provided by JMA, with a framework of “Research and Development Platform of Numerical Prediction”. The initial perturbations to perform the ensemble experiments were also provided by JMA. The idea of relaxation experiments in this study is based on a profound suggestion from S. Maeda and Y. Kubo of JMA in KT's joint research with them (Takemura et al. 2017). The Generic Mapping Tools (GMT) were used to create the graphics. This study was partly supported by the JSPS KAKENHI Grant Numbers JP18H01280 and JP18K03734.