Abstract
Reliability information of satellite precipitation products is required for various applications. This study describes and evaluates a reliability flag of the Global Satellite Mapping of Precipitation Near-Real-Time precipitation product (GSMaP_NRT). This flag was developed to characterize the reliability of GSMaP_NRT data simply and qualitatively by considering its algorithm characteristics. The reliability at each pixel is represented by any one of ten levels (10 being the best and 1 the worst) by considering three major factors: 1) “surface type reliability”— which takes into account that estimation of rainfall using passive microwave sensors is better over the oceans than over land and coastal areas; 2) “low-temperature reliability”—which takes into account the lower reliability due to surface snow cover in low-temperature conditions; and 3) “Moving Vector with Kalman Filter (MVK) propagation reliability”—which means that the reliability gets worse with the increase in time since the last overpass of the passive microwave sensor.
To evaluate the utility of the reliability flag, statistical indices are calculated for each reliability level using gauge-calibrated ground radar data around Japan. It is found that the reliability flag represents the differences in GSMaP accuracy: the accuracy worsens as the reliability decreases. The GSMaP errors exhibit seasonal changes that are well represented by the ten levels of the reliability flag, indicating that the reliability flag can be used to catch seasonal variations in GSMaP accuracy due to changes in environmental factors.
This study also raises the possibility of improving the reliability flag by using information related to heavy orographic rainfall. It is shown how the error features of heavy orographic rainfall differ from those of the total rainfall, and it is suggested that heavy orographic rainfall information can be utilized to further improve the reliability flag.
1. Introduction
Satellite-based precipitation products are an effective tool for monitoring the global distribution of precipitation. Since precipitation needs to be monitored frequently because of its high spatiotemporal variability, multi-satellite precipitation products have been developed and are widely used. The Global Satellite Mapping of Precipitation (GSMaP) product was developed by the Japan Aerospace Exploration Agency (JAXA) as one of the Global Precipitation Measurement (GPM) products. The GSMaP provides an hourly global precipitation map with 0.1° × 0.1° latitude/longitude cells using data from passive microwave (PMW) sensors in low Earth orbit combined with infrared (IR) radiometers in geostationary orbit (Kubota et al. 2020, hereafter K2020). Since a near-real-time product with a four-hour latency—i.e., the GSMaP_NRT product—became available in November 2007, this product has found wide application in agricultural monitoring, public health, and education, as well as in weather monitoring and disaster prevention.
Many previous studies have validated the performance of the GSMaP in various regions and over different periods by comparing its results with groundbased precipitation data from gauges and radars (e.g., Kubota et al. 2009 (hereafter K2009), K2020; Ngo-Duc et al. 2013; Prakash et al. 2016; Beck et al. 2017; Nodzu et al. 2019; Trinh-Tuan et al. 2019; Palharini et al. 2020). The GSMaP algorithm mainly consists of an algorithm for retrieving precipitation from PMW sensors (the PMW algorithm) and an algorithm for estimating precipitation from both PMW sensors and IR radiometer data (the PMW–IR combined algorithm). Previous studies suggested that the rainfall amount (Masunaga et al. 2019) and area (Hirose et al. 2016) estimated by the PMW–IR combined algorithm caused the GSMaP algorithm to produce overestimates compared with those made by the PMW algorithm. These results can be attributed to the propagation method used by the Moving Vector with Kalman Filter (MVK) part of the combined algorithm (Ushio et al. 2009). It is known that retrieving rainfall data from PMW sensors works better over the oceans than over the land due to differences in the estimation techniques (Ebert et al. 2007; Aonashi et al. 2009; K2009). Some papers have focused on orographic rainfall in mountainous areas, where PMW estimates tend to be underestimates, and algorithms tailored specifically for orographic rainfall were developed in these studies (Shige et al. 2013, 2015; Taniguchi et al. 2013; Yamamoto and Shige 2015; Yamamoto et al. 2017, hereafter S2013, S2015, T2013, Y2015, and Y2017, respectively). In K2020, the algorithm used by the GSMaP to estimate snowfall was described. This snowfall algorithm was first implemented in GSMaP version 7, but there is room for further improvement during the cold season or in cold areas because surface snow causes false signals and lowers the accuracy of GSMaP estimates (K2009; K2020) as well as increasing the difficulty of estimating snowfall.
Recently, users have increasingly asked for information concerning the reliability of the GSMaP as the product has been used more and more in precipitation monitoring, hydrological applications, etc. To characterize the reliability of GSMaP data qualitatively and simply, JAXA began to provide a reliability flag for GSMaP_NRT in May 2017. This flag is calculated for each pixel and is represented as any one of ten levels (10 being the best and 1 the worst). The flag takes into account the characteristics of the GSMaP precipitation estimation algorithm. A similar product, the quality index for Integrated Multi-satellitE Retrievals for the GPM Mission (IMERG; Huffman et al. 2020), is also available (Huffman 2017). The IMERG quality index is basically determined by the presence or absence of microwave satellite overpasses and the correlation between precipitation estimated from PMW sensors and IR data, whereas the GSMaP reliability flag takes into account the sensor's observational characteristics and the time correlation between the PMW and IR observations. Thus, as well as GSMaP users, the global user community—including IMERG users—has expressed a strong desire for some measure of the reliability of GSMaP rainfall estimates.
This paper aims to describe the development of the algorithm used to produce the GSMaP_NRT reliability flag and evaluate the flag information by examining the consistency between the actual accuracy and the estimated reliability levels. The possibility of improving the reliability flag by including a flag for orographic rainfall is also considered.
Section 2 explains the algorithm that produces the GSMaP_NRT reliability flag. Section 3 describes the datasets and evaluation methodology used in this study. The results are summarized in Section 4, and Section 5 discusses how the reliability flag could be further improved by including a flag for orographic rainfall conditions. Section 6 provides the conclusions to the study and some issues to be addressed in the future.
2. Algorithm for the GSMaP_NRT reliability flag
In this study, hourly rainfall data from the GSMaP_NRT version 6 product (K2020) for 2006–2019 were used. This section provides a detailed description of the algorithm that is used to produce the GSMaP_NRT reliability flag.
The reliability flag for each pixel can take any one of ten levels, 10 being the best and 1 the worst. Figure 1 is a flowchart showing how the reliability flag for a particular pixel is determined. Three main factors are considered in classifying the overall reliability: the surface type reliability, low-temperature reliability, and MVK propagation reliability.

The first factor that is taken into account is that PMW sensors for estimating rainfall perform better over the oceans than over the land or coastal areas, noted using the surface type flag: this is shown as “surface type reliability” in Fig. 1. The surface type flag (land/ocean/coast) is derived from the land–sea database of the Tropical Rainfall Measuring Mission (TRMM) Science Data and Information System (TSDIS) toolkit, which has an original spatial resolution of 0.25° × 0.25°. Figure 2 shows a surface type classification for Japan derived from the TSDIS. The relatively large area classified as “coast” by the TSDIS is due to the maximum size of the PMW sensor footprints. Because of this, the GSMaP algorithm adopts the dynamic surface type classification of Mega and Shige (2016) to reduce the coastal area from that given in the TSDIS database. However, the dynamic classification method depends on the location of the footprint, so this dynamic classification is not used in the calculation of the reliability flag.

Secondly, cold regions are classified as providing less reliable information, which is represented as “low-temperature reliability” in Fig. 1. The version 6 algorithm does not have a method for estimating snowfall; however, surface snow often triggers a false detection by PMW sensors (K2009; K2020). In the algorithm, missing pixels due to sea ice and a low temperature are also handled as part of the low-temperature reliability and assigned a low reliability. The threshold for judging whether a temperature is low is decided by missing flags, and freezing-level information is taken from the look-up-table used by the GSMaP algorithm for the oceans based upon Kubota et al. (2007), Aonashi et al. (2009), and Shige et al. (2009). This table has a spatial resolution of 5° × 5°. If a pixel is missing due to sea ice or a low temperature, or if a pixel corresponds to a region where the freezing level is below 500 m over the ocean, the pixel is considered to represent a low-temperature area. Cold land areas are determined in the same way except that the threshold is a surface temperature of 2°C and a spatial resolution of 0.5° × 0.5° is used. These conditions for the determining the threshold are based upon results found by Liu (2008).
Finally, whether PMW sensor data exist for the area in question and how long it has been since the last overpass of a PMW sensor determine the “MVK propagation reliability.” Reliability is better where PMW observations are available and where the rainfall is estimated by the PMW algorithm. For a PMW sensor passing over the ocean, imagers are considered as having a slightly higher reliability than sounders—this is based on the results in K2009. Table S1 summarizes the sensors used to produce the GSMaP_NRT. In cases where there is no PMW observation and the rainfall is estimated by the PMW–IR combined algorithm, estimates of the reliability worsen with the amount of time elapsed since the last PMW sensor overpass. The observation time flag gives the observation time relative to the most recent PMW observations. Ushio et al. (2009) found that the correlation coefficient between the precipitation estimates by the PMW–IR combined algorithm and those by the PMW-only algorithm decreased to 0.3–0.4 once four or five hours had elapsed since the last PMW overpass. The reliability flag algorithm reduces the reliability flag by two when one hour has passed; subsequently, the reliability flag is reduced continuously until it reaches its lowest value when the time since the last overpass exceeds four hours.
The reliability flag is calculated by merging these three main factors—surface type reliability, low-temperature reliability, and MVK propagation reliability—as shown in the flowchart in Fig. 1. The maximum value of 10 occurs only for imager observations made over the oceans, except for low-temperature conditions. A flag value of 9 can be given for either a sounder observation over the ocean or a PMW sensor observation over land. If the low-temperature condition is met, the flag value becomes 1 over the ocean or 4 over land, based on empirical rules. If there are no PMW sensor observations available, the flag value is decremented by two for every hour that passes since the last PMW overpass: 8, 6, 4, 2 then 1 for ocean pixels; 7, 5, 3 then 1 for land pixels; 2 then 1 assigned for cold areas. Figure 3 shows an example of the spatial distribution of the reliability flag. The values are generally lower at high latitudes, and the same values occur along the observation swath of the sensor. When imager and sounder observations overlap, the pixel is treated as for an imager. Note that differences in the definition of low-temperature reliability for the ocean compared to the land/coast sometimes cause inconsistency in the reliability (e.g., around the Aleutian Islands in Fig. 3).

3. Evaluation methodology
The Japan Meteorological Agency makes gauge-calibrated ground radar data available through its Radar/rain gauge-Analyzed product (RA) (Makihara et al. 1996; Makihara 2000, 2007). The ground-truth data used in the evaluation of the reliability flag in this study were obtained from this product. Figure 2 shows the area of Japan that was analyzed along with a surface type classification. The domain was limited to within 150 km of radar observation sites. Note that RA data obtained over the ocean far from radar sites can include errors. The target period was set as 2006 to 2019 because the spatial resolution of RA data was upgraded from 2.5 km to 1 km in 2006 (Makihara 2007).
To verify the effectiveness of the reliability flag, statistical indices were calculated for each level of the flag (see below). Values of these indices were determined for each level of reliability during the target period, and the effectiveness of the reliability flag was then considered. In addition, the seasonal variations in the accuracy of the GSMaP were examined in relation to each reliability flag level to assess whether the flag is effective in capturing these seasonal differences.
Common statistical indices were used for evaluating both the rain/no-rain classification and the estimates of rainfall amounts. In this study, the possibility of detection [POD; Eq. (1)], threat score [TS; Eq. (2)], false alarm ratio [FAR; Eq. (3)], and missing ratio [MR; Eq. (4)] were used for evaluating rain/no-rain classifications:
Here,
a represents the number of pixels where the GSMaP correctly estimated the rainfall;
b represents the number of pixels where rainfall did not occur but the GSMaP estimated that there was some rainfall; and
c represents the number of pixels where rainfall did occur but the GSMaP did not detect it. The thresh-old for a rain/no-rain classification is 0.1 mm h
−1. Note that cases where rainfall did not occur and the GSMaP also determined that no rainfall occurred were not considered. All of these indices take values from 0 to 1. For POD and TS, the larger the value, the better the result; for FAR and MS, the opposite is true.
The spatial correlation coefficient [CC; Eq. (5)], root mean square error [RMSE; Eq. (6)], and normalized RMSE [NRMSE; Eq. (7)] were also used to evaluate estimates:
Here,
RGSMaPi and
RRAi are the hourly rainfall rates, and

and

are the mean rainfall rates (in mm h
−1) obtained from the GSMaP and RA, respectively.
N is the total number of samples, and the RMSE is given in units of mm h
−1. Pixels where no rain occurred were used in the calculation of these indices.
4. Results of evaluations
4.1 Sampling number of the reliability flag
Before any evaluations were made, the number of samples used for each reliability flag level within the region used for the analysis shown in Fig. 2 were first checked to review the algorithm development of the reliability flag described in Section 2. The total number of samples used for each pixel was determined, and the numbers of samples corresponding to the different levels of the reliability flag were compared with each other; the results were then used to determine which level of the reliability flag was based on the largest number of samples for Japan. The results of this are shown in Table 1. Over the land and in coastal areas, a flag value of 9—which corresponds to the there being PMW sensor observations—was found to be the largest number of samples. In particular, many flag values of 9 were found in the southern part of Japan due to the frequent observations made by the TRMM Microwave Imager (TMI); values of 9 were less frequent in the northern part of Japan due to the low-temperature reliability (not shown). The number of samples decreases as the reliability flag values decrease to 7, 5, and then 3. Over land, flag values of 4 are based on a relatively large number of samples: this value corresponds to the low-temperature criteria being met. A relatively large number of samples corresponding to this level were acquired in northern and highland parts of Japan in winter (not shown). The minimum reliability flag value of 1 is based on the third highest number of samples over land. This is a result of this being the sum of the number of cases where more than four hours elapsed since the previous PMW sensor overpass and those where more than two hours passed since the previous PMW observation when the low-temperature reliability condition was met.

Over the oceans, a reliability flag value of 8 has the largest number of samples; this corresponds to cases where no more than one hour passed since the last PMW observation. Note that a flag value of 9 based on sounder observations and a value of 10 based on imager observations are treated differently, so that the number of samples is largest if the numbers corresponding to flag values of 9 and 10 are added together. The number of samples decreases as the reliability flag values decrease from 6 to 4 to 2. A relatively large number of flags with values of 1 results when the conditions for the low-temperature reliability are met; this occurs especially over the oceans around Hokkaido and in the Tohoku region (not shown).
Hence, the number of samples is generally larger for higher values of the reliability flag, and the number of samples decreases as the length of time since the last PMW sensor overpass increases. In addition to this effect due to the MVK propagation reliability, a relatively large number of flags with values of 1 to 4 occurs when the conditions for the low- temperature reliability are met.
4.2 Statistical evaluation indices for each reliability flag
This subsection describes the statistical evaluation indices that were calculated for each reliability flag value in order to investigate the effectiveness of the reliability flag. Table 2 shows the values of all the indices (POD, TS, FAR, and MR) that were calculated to evaluate rain/no-rain classifications and those that were calculated for estimated rainfall amounts (CC, RMSE, and NRMSE). It can be seen that, overall, the reliability flag represents the differences in the accuracy of the GSMaP well.

The POD and TS values generally decrease as the reliability decreases, which means that the accuracy gets worse as the reliability becomes lower. The best values of POD and TS are 38.4 and 31.6, respectively, which occur when the reliability flag is 10; the worst values are 11.9 and 9.6, respectively, when the flag is 1. However, the POD and TS values do not decrease monotonically: both POD and TS have a higher (better) value for a reliability flag value of 8 than for a value of 9, for example. This means that the flag values can reflect the variation in the accuracy of the GSMaP for the same surface conditions but not the difference in accuracy that results from differences in the surface conditions. The differences in the number of samples that were shown in Table 1 can also cause differences in the results.
The trends in the values of FAR and MR are the same as for POD and TS: the accuracy gets worse (FAR and MR increase) as the reliability becomes lower. The best values of FAR and MR are 29.2 and 61.6, respectively, and correspond to the maximum value of the reliability; their worst values are 52.9 and 88.1, respectively, and correspond to the minimum value of the reliability. As with POD and TS, there is room for further improvement in the reliability flag in terms of its ability to take into account the differences between surface types.
CC decreases (the accuracy gets worse) as the reliability becomes lower. The best value of CC (0.493) occurs when the reliability flag is 10, and its worst value (0.134) occurs when the flag is 1. Although the reliability flag, thus, reflects the overall pattern in CC, again, these results show that the differences between surface types need to be considered in greater detail.
The results for the RMSE are notably different to those for the other indices and show that the values of the reliability flag do not reflect the variation in the RMSE values. The best RMSE value of 0.511 mm h−1 occurs when the reliability flag is 2, and the worst value of 0.732 mm h−1 occurs when the flag is 9. This could be because the RMSE values depend on the mean absolute precipitation amount. In Japan, the amount of precipitation tends to be high in summer and low in winter. As a result, the number of samples with lower reliability flags is larger in winter when the mean precipitation is small; conversely, the number of samples with higher reliability flags is larger in summer when there is considerable rainfall within the target domain (not shown). This may be the cause of the inconsistency between the values of the reliability flag and the RMSE values.
The NRMSE has a better correspondence with the reliability over the ocean. The NRMSE has a value of 2.54 for a reliability flag of 10, and the NRMSE value increases as the reliability flags decrease from 8 to 6 and then 4 over the ocean. However, in contrast, the NRMSE value decreases as the reliability flags decrease from 9 to 7 to 5 and then 3 over the land. The values are almost the same for reliability flags of 9, 7, 5, and 3, and the variations in the NRMSE are consistent with those in the RMSE. As mentioned in the results for the RMSE, there are some factors that can cause inconsistency in the results, such as differences in the number of samples for example.
In relation to the low-temperature reliability, apart from the RMSE, all of the statistical measures are clearly poorer for reliability flag values below 4 (except for 3 being sure that the low-temperature condition is not met) than for flag values above 5. These results indicate that the inclusion of the low-temperature reliability produces good results. Further improvements to the GSMaP algorithm for making precipitation estimates under low-temperature conditions are required.
Hence, the results indicate that the MVK propagation reliability and low-temperature reliability are consistently reliable, whereas the surface type reliability needs to be improved. For example, the results for a flag value of 6 (corresponding to ocean pixels where one to two hours have elapsed since the last PMW observation) are better than those for a flag value of 7 (corresponding to land pixels where less than one hour has passed since the last PMW observation).
4.3 Seasonal changes in evaluation indices for each reliability flag value
As investigated in previous studies (K2009; K2020), it is known that the GSMaP accuracy for Japan varies seasonally. In this subsection, the results of an examination of the seasonal variations in the evaluation indices for each reliability flag value are discussed with the aim of confirming that the reliability flag can reflect the seasonal changes in GSMaP accuracy throughout the year.
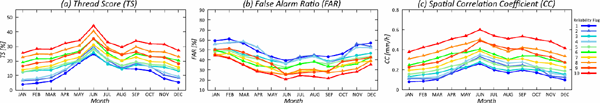
Figure 4 shows the monthly mean values of TS, FAR, and CC, which were used as representative indices for each reliability flag value. Seasonal changes in the GSMaP are clearly seen in all indices in Fig. 4; accuracy gets better in the summer and worse in the winter, which is consistent with K2009 and K2020. The results that were obtained for other indices (not shown) indicated very similar seasonal changes to those shown in Fig. 4. Note that all levels of the reliability flag reflect the seasonal changes in the GSMaP accuracy. Moreover, the evaluation indices for a higher reliability maintain these better scores throughout the year; the same is also true for those with poorer scores. It is, therefore, clear that the reliability flag reflects changes in the GSMaP accuracy even under varying environmental conditions.
5. Improving the reliability flag using orographic rainfall information
As mentioned in the previous section, the results indicated that the surface type reliability should be improved further. This section discusses the possibility of improving the current reliability flag by taken into account orographic rainfall over land.
5.1 Orographic rainfall flag
The GSMaP algorithm was developed specifically for making separate estimates of orographic and non-orographic rainfall (S2013, S2015, T2013, Y2015, and Y2017). The orographic rainfall flag was developed to indicate where and when the orographic rainfall algorithm should be applied. In this study, the orographic rain condition was identified as follows (referring to Y2017). The scheme used to detect whether orographic rainfall is occurring in a particular area considers the orographically forced upward motion [w; Eq. (8)] and the moisture flux convergence [Q; Eq. (9)] using Japanese 55-year reanalysis (Kobayashi et al. 2015). The relevant equations are
and
where 𝕍
H is the average horizontal wind vector (units: m s
−1) at a height < 1.5 km above the upstream region,
q is the average water vapor mixing ratio (units: kg kg
−1) at a height of less than 1.5 km, and
h (
x, y) is the elevation (units: m) derived from digital elevation map averaged over a distance of 50 km. The thresholds for
w and
Q that are used to determine whether the orographic rainfall condition applies consider the area of orographic enhancement as a function of the upstream wind speed as follows [
Eqs. (10),
(11)].
and
It should be noted that the orographic rainfall flag used in this study has been applied to TMI data since GSMaP_NRT version 6, whereas it has been applied to all PMW sensor data only since GSMaP_NRT version 7 (K2020).
5.2 Evaluations of orographic rainfall estimations with the reliability flag
To evaluate the estimates of orographic rainfall in relation to the reliability flag, evaluation indices were calculated using samples taken from locations where orographic rainfall was considered to have been occurring. The results are shown in Table 3, and it can be seen that there are some differences from those shown in Table 2. The results for most indices in Table 3 are an improvement (shown in red) compared to Table 2; however, for the RMSE the results are worse (shown in blue) compared with the results obtained using the complete sample set that were shown in Table 2. Previous studies have suggested that orographic rainfall tends to be heavy (S2013, S2015, T2013, Y2015, and Y2017). Because the orographic rainfall samples may have been limited to heavy rainfall, this will have produced values of the indices that are significantly different from those in Table 2. The improvement in the results (except for the RMSE) is possibly because heavy rainfall is more detectable than light rainfall, which leads to increases in POD, TS and CC, and decreases in FAR and MR. In other words, GSMaP can often miss light or moderate rainfall, causing errors in evaluation scores.

In terms of the RMSE, the value has increased considerably from 0.593 mm h−1 for the total sample set to an average of 2.57 mm h−1 for the orographic samples only. It should be noted that there is also a difference between the mean absolute rainfall rates, , for the total sample set and the orographic samples: the latter value is 1.900 mm h−1, which is approximately ten times higher than the former value of 0.200 mm h−1. All of the NRMSE values in Table 3 are lower than those in Table 2. Moreover, the NRMSE values in Table 3 increase slightly as the reliability flag level decreases; in contrast, as pointed out earlier, in Table 2, the same values decreased as the reliability flag level decreased. Thus, the pattern of errors in orographic rainfall estimates is different from that in average rainfall estimates over land. Information about orographic rainfall would, thus, be useful in improving the reliability flag. (For example, orographic rainfall could be considered separately from non-orographic rainfall when calculating the reliability flag.)
6. Summary and issues to be addressed
In this study, the flag used to characterize the reliability of the GSMaP_NRT precipitation product was described, and this flag was evaluated using gauge-calibrated ground radar data obtained across Japan. This reliability flag was developed to provide a simple, qualitative measure of the reliability of GSMaP precipitation data by taking into account the characteristics of the GSMaP precipitation estimation algorithm. The reliability at a given pixel can take any one of ten values (10 being the best and 1 the worst), based on a consideration of the following three main factors. The “surface type reliability” accounts for the effect that estimates of rainfall using PMW sensors made over the oceans are better than those made over land and coastal areas. The problem of low temperatures causing false detection of surface snow by PMW sensors is accounted for by the “low-temperature reliability.” Finally, the elapsed time since the last overpass of a PMW sensor is included in the “MVK propagation reliability.”
To evaluate the performance of the reliability flag, statistical indices were calculated for each reliability level. Overall, it was found that the reliability flag is able to reflect the differences in the GSMaP accuracy. In terms of the three factors that affect the reliability, the algorithm for the reliability flag handles MVK propagation reliability and low-temperature reliability well; however, the way in which the surface type reliability is handled needs to be improved further. To improve the surface type reliability, the differences in reliability for different surface types should be considered. Differences in the number of samples used can also produce unsatisfactory results related to the surface type reliability, which means that an approach to normalize the number of samples could be one way of improving the algorithm. In terms of seasonal changes in GSMaP errors, all ten levels of the reliability flag were found to reflect the seasonal characteristics in the GSMaP accuracy. Indices with a higher reliability had better scores throughout all seasons, and those with a poorer reliability had consistently poorer scores. Thus, the reliability flag is able to reflect differences in the accuracy of the GSMaP even under changing environmental conditions.
This study also aimed to find how the reliability flag could be improved by using a flag indicating the occurrence of orographic rainfall. It was found that the characteristics of the errors in orographic rainfall estimates are quite different from those of total rainfall estimates. Except for the RMSE, the statistical indices were better for the case of orographic rainfall, which was possibly because the orographic rainfall samples were limited to heavy rainfall and this is generally easier to detect than light rainfall. In other words, GSMaP can often miss light or moderate rainfall, causing errors in the evaluation scores for total rainfall. Hence, information about orographic rainfall could be used to improve the reliability flag by treating orographic rainfall separately from non-orographic rainfall.
One further way in which the reliability flag could be improved—as suggested in previous studies—is to include additional parameters. Shige and Kummerow (2016) demonstrated that there is a relationship between thermodynamic parameters and the precipitation-top heights frequently associated with heavy orographic rainfall. The dependence of environmental parameters on GSMaP errors remains an issue to be addressed.
The IMERG and the National Oceanic and Atmospheric Administration Climate Prediction Center MORPHing Technique (CMORPH; Joyce et al. 2004) use a technique similar to that employed in the GSMaP algorithm. Therefore, the current approach to characterizing reliability could also be applied to the IMERG and CMORPH as well. As mentioned in Section 1, the IMERG quality index uses a different approach to characterizing reliability compared to the GSMaP reliability flag. Evaluations using other satellite precipitation products and comparisons of the methodology used to produce the reliability flag and the quality index are also tasks for future work.
Supplements
Table S1 summarizes the sensors used to produce the GSMaP_NRT. In this study, the sensors were divided into three categories: imager, imager/sounder, and sounder. Sensors described as “imagers” in the main text are denoted by “A” in Table S1—this classification includes both imagers and imagers/sounders. Sensors described as “sounders” in the main text are denoted by “B” in the Table S1.
Acknowledgments
The authors would like to express their sincere gratitude to the GSMaP algorithm team for providing constructive comments from the GSMaP developers' perspective. Especially, Prof. Shoichi Shige (Kyoto University) and Prof. Atsushi Higuchi (Chiba University) provided useful suggestions for the development of the reliability flag. They are also grateful to Dr. Tomoko Tashima (JAXA) and Mr. Shinji Ohwada (Remote Sensing Technology Center of Japan) for their support in processing the data used in the study, and to the anonymous reviewers for their helpful suggestions.
References
- Aonashi, K., J. Awaka, M. Hirose, T. Kozu, T. Kubota, G. Liu, S. Shige, S. Kida, S. Seto, N. Takahashi, and Y. N. Takayabu, 2009: GSMaP passive microwave precipitation retrieval algorithm: Algorithm description and validation. J. Meteor. Soc. Japan, 87A, 119-136.
- Beck, H. E., N. Vergopolan, M. Pan, V. Levizzani, A. I. J. M. van Dijk, G. P. Weedon, L. Brocca, F. Pappenberger, G. J. Huffman, and E. F. Wood, 2017: Global-scale evaluation of 22 precipitation datasets using gauge observations and hydrological modeling. Hydrol. Earth Syst. Sci., 21, 6201-6217.
- Ebert, E. E., J. E. Janowiak, and C. Kidd, 2007: Comparison of near-real-time precipitation estimates from satellite observations and numerical models. Bull. Amer. Meteor. Soc., 88, 47-64.
- Hirose, H., M. K. Yamamoto, S. Shige, A. Higuchi, T. Mega, T. Ushio, and A. Hamada, 2016: A rain potential map with high temporal and spatial resolutions retrieved from five geostationary meteorological satellites. SOLA, 12, 297-301.
- Huffman, G., 2017: IMERG quality index. 4 pp. [Available at https://gpm.nasa.gov/sites/default/files/document_files/IMERG_QI.pdf.]
- Huffman, G. J., D. T. Bolvin, D. Braithwaite, K.-L. Hsu, R. J. Joyce, C. Kidd, E. J. Nelkin, S. Sorooshian, E. F. Stocker, J. Tan, D. B. Wolff, and P. Xie, 2020: Integrated Multi-satellitE Retrievals for the Global Precipitation Measurement (GPM) mission (IMERG). Satellite Precipitation Measurement. Levizzani, V., C. Kidd, D. B. Kirschbaum, C. D. Kummerow, K. Nakamura, and F. J. Turk (eds.), Springer, Cham, 343-353.
- Joyce, R. J., J. E. Janowiak, P. A. Arkin, and P. Xie, 2004: CMORPH: A method that produces global precipitation estimates from passive microwave and infrared data at high spatial and temporal resolution. J. Hydrometeor., 5, 487-503.
- Kobayashi, S., Y. Ota, Y. Harada, A. Ebita, M. Moriya, H. Onoda, K. Onogi, H. Kamahori, C. Kobayashi, H. Endo, K. Miyaoka, and K. Takahashi, 2015: The JRA-55 reanalysis: General specifications and basic characteristics. J. Meteor. Soc. Japan, 93, 5-48.
- Kubota, T., S. Shige, H. Hashizume, K. Aonashi, N. Takahashi, S. Seto, M. Hirose, Y. N. Takayabu, T. Ushio, K. Nakagawa, K. Iwanami, M. Kachi, and K. Okamoto, 2007: Global precipitation map using satellite-borne microwave radiometers by the GSMaP project: Production and validation. IEEE Trans. Geosci. Remote Sens., 45, 2259-2275.
- Kubota, T., T. Ushio, S. Shige, S. Kida, M. Kachi, and K. Okamoto, 2009: Verification of high-resolution satellite-based rainfall estimates around Japan using a gauge-calibrated ground-radar dataset. J. Meteor. Soc. Japan, 87A, 203-222.
- Kubota, T., K. Aonashi, T. Ushio, S. Shige, Y. N. Takayabu, M. Kachi, Y. Arai, T. Tashima, T. Masaki, N. Kawamoto, T. Mega, M. K. Yamamoto, A. Hamada, M. Yamaji, G. Liu, and R. Oki, 2020: Global Satellite Mapping of Precipitation (GSMaP) products in the GPM era. Satellite Precipitation Measurement. Levizzani, V., C. Kidd, D. B. Kirschbaum, C. D. Kummerow, K. Nakamura, and F. J. Turk (eds.), Springer, Cham, 355-373.
- Liu, G., 2008: Deriving snow cloud characteristics from CloudSat observations. J. Geophys. Res., 113, D00A09, doi:10.1029/2007JD009766.
- Makihara, Y., 2000: Algorithms for precipitation nowcasting focused on detailed analysis using radar and raingauge data. Study on the Objective Forecasting Techniques. Technical Reports of the MRI, No. 39, 63-111.
- Makihara, Y., 2007: Steps towards decreasing heavy rain disasters by short-range precipitation and land-slide forecast using weather radar accompanied by improvement of meteorological operational activities. Tenki, 54, 21-33 (in Japanese).
- Makihara, Y., N. Uekiyo, A. Tabata, and Y. Abe, 1996: Accuracy of radar-AMeDAS precipitation. IEICE Trans. Commun., 79, 751-762.
- Masunaga, H., M. Schröder, F. A. Furuzawa, C. Kummerow, E. Rustemeier, and U. Schneider, 2019: Inter-product biases in global precipitation extremes. Environ. Res. Lett., 14, 125016, doi:10.1088/1748-9326/ab5da9.
- Mega, T., and S. Shige, 2016: Improvements of rain/no-rain classification methods for microwave radiometer over coasts by dynamic surface-type classification. J. Atmos. Oceanic Technol., 33, 1257-1270.
- Ngo-Duc, T., J. Matsumoto, H. Kamimera, and H.-H. Bui, 2013: Monthly adjustment of Global Satellite Mapping of Precipitation (GSMaP) data over the VuGia–ThuBon River Basin in central Vietnam using an artificial neural network. Hydrol. Res. Lett., 7, 85-90.
- Nodzu, M. I., J. Matsumoto, L. Trinh-Tuan, and T. Ngo-Duc, 2019: Precipitation estimation performance by Global Satellite Mapping and its dependence on wind over northern Vietnam. Prog. Earth Planet. Sci., 6, 58, doi:10.1186/s40645-019-0296-8.
- Palharini, R. S. A., D. A. Vila, D. T. Rodrigues, D. P. Quispe, R. C. Palharini, R. A. de Siqueira, and J. M. de Sousa Afonso, 2020: Assessment of the extreme precipitation by satellite estimates over South America. Remote Sens., 12, 2085, doi:10.3390/rs12132085.
- Prakash, S., A. K. Mitra, E. N. Rajagopal, and D. S. Pai, 2016: Assessment of TRMM-based TMPA-3B42 and GSMaP precipitation products over India for the peak southwest monsoon season. Int. J. Climatol., 36, 1614-1631.
- Shige, S., and C. D. Kummerow, 2016: Precipitation-top heights of heavy orographic rainfall in the Asian monsoon region. J. Atmos. Sci., 73, 3009-3024.
- Shige, S., T. Yamamoto, T. Tsukiyama, S. Kida, H. Ashiwake, T. Kubota, S. Seto, K. Aonashi, and K. Okamoto, 2009: The GSMaP precipitation retrieval algorithm for microwave sounders—Part I: Over-ocean algorithm. IEEE Trans. Geosci. Remote Sens., 47, 3084-3097.
- Shige, S., S. Kida, H. Ashiwake, T. Kubota, and K. Aonashi, 2013: Improvement of TMI rain retrievals in mountainous areas. J. Appl. Meteor. Climatol., 52, 242-254.
- Shige, S., M. K. Yamamoto, and A. Taniguchi, 2015: Improvement of TMI rain retrieval over the Indian subcontinent. Remote Sensing of the Terrestrial Water Cycle. Lakshmi, V., D. Alsdorf, M. Anderson, S. Biancamaria, M. Cosh, J. Entin, G. Huffman, W. Kustas, P. van Oevelen, T. Painter, J. Parajka, M. Rodell, and C. Rüdiger (eds.), Geophys. Monogr., No. 206, Amer. Geophys. Union, 27-42.
- Taniguchi, A., S. Shige, M. K. Yamamoto, T. Mega, S. Kida, T. Kubota, M. Kachi, T. Ushio, and K. Aonashi, 2013: Improvement of high-resolution satellite rainfall product for Typhoon Morakot (2009) over Taiwan. J. Hydrol., 14, 1859-1871.
- Trinh-Tuan, L., J. Matsumoto, T. Ngo-Duc, M. I. Nodzu, and T. Inoue, 2019: Evaluation of satellite precipitation products over Central Vietnam. Prog. Earth Planet. Sci., 6, 54, doi:10.1186/s40645-019-0297-7.
- Ushio, T., K. Sasashige, T. Kubota, S. Shige, K. Okamoto, K. Aonashi, T. Inoue, N., Takahashi, T. Iguchi, M. Kachi, R. Oki, T. Morimoto, and Z.-I. Kawasaki, 2009: A Kalman filter approach to the Global Satellite Mapping of Precipitation (GSMaP) from combined passive microwave and infrared radiometric data. J. Meteor. Soc. Japan, 87A, 137-151.
- Yamamoto, M. K., and S. Shige, 2015: Implementation of an orographic/nonorographic rainfall classification scheme in the GSMaP algorithm for microwave radiometers. Atmos. Res., 163, 36-47.
- Yamamoto, M. K., S. Shige, C.-K. Yu, and L.-W. Cheng, 2017: Further improvement of the heavy orographic rainfall retrievals in the GSMaP algorithm for microwave radiometers. J. Appl. Meteor. Climatol., 56, 2607-2619.