Abstract
A phased array weather radar (PAWR) can complete one volume scan in 30 s, thus enabling us to obtain high spatiotemporal resolution echo intensities and wind fields of storms. Using its rapid scanning capability, we investigated the evolution of a convective storm in detail. To describe the evolution of convective storms, we used the following definitions. The precipitation cell is defined as a three-dimensionally contiguous region of 40 dBZ or greater. The precipitation core is defined by a threshold of positive deviation greater than 7 dBZ, which is a difference from the average reflectivity during the mature stage of the cell. An updraft core is defined as an updraft region of 1 m s−1 or stronger at a height of 2 km.
An isolated convective storm was observed by two PAWRs on 7 August 2015 in the Kinki District, western Japan. The storm was judged as a single cell, according to the above definition. We identified nine precipitation cores and five updraft cores within 49 min in the mature stage of the cell. A long-lasting updraft core and its branches moved southwestward or southeastward. Around these updraft cores, the precipitation cores were generated successively. The updraft core with the longest duration lasted 73.5 min; in contrast, the lifetimes of the precipitation cores were from 4.5 min to 14.5 min. The precipitation cell was maintained by the successive generations of updraft cores which lifted humid air associated with a low-level southwesterly inflow. The total amounts of water vapor inflow supplied by all the identified updraft cores were proportional to the volumes of the precipitation cell, with a correlation coefficient of 0.75. Thus, the extremely high spatiotemporal resolution of the PAWR observations provides us with new evidence that an isolated convective storm can be formed by multiple precipitation cores and updraft cores.
1. Introduction
Recently, explosively developing isolated convective storms have been observed frequently during the summer in Japan (e.g., Hirano and Maki 2018; Isoda et al. 2018). These storms cause localized heavy rainfall within several minutes following the detection of the first echo observed by conventional weather radars (e.g., Nakakita et al. 2010; Hirano and Maki 2018). Such localized heavy rainfall can cause flash flooding that can sometimes result in major disasters. For example, in two particular rapidly developing storm events, five sewer workers drowned in Zoshigaya City, Tokyo Prefecture, central Japan in 2008 (Kato and Maki 2009; Hirano and Maki 2010; Kim et al. 2012), and five people—including small children—also drowned in the Toga River, Hyogo Prefecture, western Japan in 2008 (Nakakita et al. 2010). These convective storms developed under weak synoptic forcing and in highly unstable atmospheric conditions with weak vertical wind shear (e.g., Kingsmill and Wakimoto 1991; Kim et al. 2012).
A single-cell storm is defined as a precipitation area caused by a single updraft. A precipitation cell evolves in three distinct stages—developing, mature, and dissipating—according to the evolution of the updraft and downdraft. A precipitation cell develops with an intensifying updraft, and then the precipitation cell dissipates with the updraft weakening and a downdraft spreading in the precipitation area. The concept of a “precipitation cell” is widely used to describe single-cell storms. A classic supercell storm, one kind of single-cell storms, is defined as a rotating updraft with a separated downdraft. On the other hand, a multicell storm is composed of multiple convective cells, which have different stages. In these cases, the structure of convective storms has been described in the paradigm of a precipitation cell, which was originally outlined by Byers and Braham (1949).
When a convective storm is observed by a weather radar, a strong echo region is usually detected, which is called a “precipitation core” or “reflectivity core”; these concepts have been used to describe the three-dimensional structure and detailed evolution of a convective storm (e.g., Kingsmill and Wakimoto 1991; Shusse et al. 2005). Kingsmill and Wakimoto (1991) showed the relationship between the lifecycle of a cell and the three-dimensional location of a precipitation core, which was defined as a region of 60 dBZ or greater reflectivity, as a case study. During the developing stage, the maximum reflectivity region moved slightly upward above the melting layer, increasing its intensity. In the mature stage, it attained a reflectivity greater than 60 dBZ and started to descend. In the dissipating stage, the precipitation core continued to descend, producing and strengthening a downdraft. The formation of a precipitation core results from rapid glaciation and particle growth by accretion when a strong updraft occurs associated with the low-level inflow (Wakimoto and Bringi 1988; Tuttle et al. 1989). The descent of a precipitation core is caused by a weakening updraft and increasing hydrometeor fall speed (Kingsmill and Wakimoto 1991). The descent of the precipitation core sometimes causes a microburst or local heavy rain (Ishihara 2012; Shusse et al. 2015). For disaster mitigation, it is important to understand the three-dimensional structure of a precipitation core and its evolution.
The spatiotemporal evolution of precipitation cores has been observed by weather radars with various spatiotemporal resolutions. Shusse et al. (2005) investigated a long-lasting convective cloud in China using full volume-scan data updated every 7 min. As a result, a cell was found to be composed of two precipitation cores generated by two strong updrafts in the developing stage. In the mature stage, these cores developed into a single large precipitation core at the middle and upper levels. Kim et al. (2012) showed, using dual-polarization radar data every 5 min, that the replacement of precipitation cores during the mature stage of a storm was driven by the periodic formation of strong updrafts associated with low-level inflow. Shusse et al. (2015) investigated the behavior of precipitation cores using three-dimensional reflectivity data at 2-min intervals. As noted by Kim et al. (2012) and Shusse et al. (2015), it was difficult to distinguish individual cores and to track each precipitation core with the coarse temporal resolution available. More recently, Isoda et al. (2018) investigated four isolated convective clouds in Osaka City using a phased array weather radar (PAWR) every 30 s. They revealed that heavy rain started within 15 min after the first echo appeared and that a new precipitation core became dominant above a descending precipitation core in the dissipating stage of the precipitation cell. This alternation of the precipitation cores was observed in a few minutes. These results indicate that a rapid volume scan is indispensable to reveal the evolution of precipitation cores.
Although a detailed examination of the spatiotemporal changes in the structures of precipitation cores and updrafts is important to understand the evolution of convective storms, the temporal resolution of conventional radars is insufficient. Furthermore, updrafts change more rapidly than precipitation cores (Kim et al. 2012); thus, the relationship between precipitation cores and updrafts remains unclarified. An isolated convective storm was observed by two PAWRs in the Kinki District, western Japan on 7 August 2015. Since the storm developed in the observation range of two PAWRs, we performed dual-Doppler analysis every 30 s. The purpose of this study is to clarify the evolution of precipitation cores in the storm and the relationship between the lifecycles of precipitation cores and updrafts. On the basis of our results, we propose a new concept of an isolated convective storm in terms of multiple precipitation cores and updrafts.
2. Data and analysis method
2.1 Observation data and processing
X-band PAWRs have been in operation since 2012 in Suita City, Osaka Prefecture and since 2014 in Kobe City, Hyogo Prefecture. The PAWRs transmit a broad beam with a vertical width of 5–10° and a horizontal width of 1.0° from 12–24 antenna elements, and they receive the back-scattered signal with 128 slot antenna elements aligned in the vertical direction. After the transmitted fan beams are received simultaneously, about 100 sharp beams are obtained using a digital beam forming technique (Yoshikawa et al. 2013) within 0.1 s, with an elevation resolution of about 1° from 0° to 90° in elevation. The PAWRs are mechanically rotated in the azimuthal direction with azimuthal and range resolutions of 1.2° and 100 m, respectively. One volume scan takes 30 s. Other details of the PAWR functions were presented in Mizutani et al. (2018).
An X-band polarimetric radar network named the eXtended RAdar Information Network (XRAIN) was used to compare rainfall intensities and amounts. The XRAIN product of rainfall intensity is provided every minute with a horizontal resolution of approximately 250 m estimated from the radar reflectivity and specific differential phase shift, KDP, as described in Maesaka et al. (2011). The accuracy of XRAIN rainfall was verified by comparison with surface observations (Tsuchiya et al. 2015). Japan Meteorological Agency mesoscale analysis data (JMA-MA, Japan Meteorological Agency 2013) were also used to examine the environmental situation.
The reflectivity and Doppler velocity were interpolated into a Cartesian coordinate system with horizontal and vertical grid intervals of 250 m using a Cressman-type weighting function. The effective radius of influence of the weighting function was 700 m in the horizontal and vertical directions. In this study, the greater reflectivity value of the two PAWRs was used in the same grid after the coordinate conversion in order to reduce the effect of attenuation. Horizontal wind vectors and divergence were calculated using the grid data, and then the vertical wind velocity was derived from the upward integration of the horizontal divergence that was estimated using the anelastic continuity equation. The analysis area was limited as the angle between the radar beams of the Suita and Kobe PAWRs ranged from 20° to 160°. The bottom boundary condition of w = 0 m s−1 at 1.0 km above sea level (ASL) was used because data lower than 1.0 km ASL were not available owing to topographical blockage (Fig. 1). The terminal fall velocities of rain, snow, and graupel were adapted from Shimizu et al. (2008). Spatially and temporally discontinuous data were eliminated as noises from the Doppler velocities and three-dimensional wind vectors. Since the upward integration of horizontal divergence tends to amplify the error in vertical velocity at higher levels (e.g., Ray et al. 1980; Nelson and Brown 1982), we used vertical velocities at 2 km ASL, where the cumulative error in vertical velocity may not be significant (Ray et al. 1980). The estimated values of the vertical velocity may have some uncertainties caused by the lack of observation data below 1 km ASL. We, therefore, focused on relatively large and strong updraft regions. The PAWR data are influenced by ground clutter contamination and range sidelobes (Ruiz et al. 2015; Yoshikawa et al. 2013). The analysis area was selected to minimize the influence of ground clutter contamination. To avoid the effects of the range sidelobes, reflectivities greater than 40 dBZ were used for the analysis (see Appendix), and we analyzed updrafts around the greater reflectivity regions. Correction of the storm's movement during each volume scan in the dual-Doppler analysis is not necessary because of the rapid scanning ability of PAWRs. In this study, the horizontal components of wind velocities are used relative to the ground.

In this study, a precipitation cell is defined as a three-dimensionally contiguous region of 40 dBZ or greater above 2 km ASL whose volume is larger than 1 km3. The reflectivity threshold is slightly higher than those in previous studies, e.g., 10 dBZ (Shusse et al. 2005; Shusse and Tsuboki 2006), 30 dBZ (Shimizu and Uyeda 2012), and 25 dBZ (Isoda et al. 2018). The cell definition in this study implies that the region has larger hydrometeors and/or more numerous particles than those in the previous studies.
The high spatiotemporal resolution of PAWR data enables us to track cells and cores. To track a precipitation cell identified at time t, we take the following two steps. In step 1, cells are identified at t + 30 s based on the reflectivity threshold. In step 2, the cell at t + 30 s, which has the largest spatial overlap with the cell at t, is considered to be the same cell. When there is no cell at t + 30 s, which has an overlap with the cell at t, the cell at t is considered to be dissipated at t + 30 s.
To identify the regions of precipitation cores, defined as the greater reflectivity regions in the precipitation cell, the composite data are created by the time-averaged reflectivity at each grid. As a first step, the volume center (Xc, Yc, Zc) of the precipitation cell is calculated by averaging the coordinates within the cell:
where
N is the number of grid points in the cell volume and
i is an index of the grids. Then, the composite data are created by centering on the horizontal center point (
Xc, Yc) and averaging reflectivity during the mature stage of the cell. The temporal change of the vertical center
Zc is small during the mature stage. In this case, the vertical center remained between 5.0 km and 6.1 km ASL during the period from 16:45:30 LST to 17:34:30 LST (LST = UTC + 9 h).
A deviation from the composite reflectivity is used for identifying a precipitation core. A three-dimensionally contiguous region with a positive deviation greater than 7 dBZ is identified above 2 km ASL. The region is defined as a precipitation core, when the three-dimensionally contiguous region is larger than 1 km3 in the volume above 5 km ASL, and the duration time is 3 min or more. The tracking for a precipitation core was performed by the same procedure as that for a precipitation cell. When two cores at t + 30 s overlap with the core at t, the core that has the larger overlapping volume is selected as the same core, and the other is considered a “branched core”, which is indicated by a hyphenated sub-number (case 4 in Fig. 2).

In this study, the precipitation core is identified in three dimensions. On the other hand, the updraft core is defined in a horizontal plane at 2 km ASL as an area with upward velocities of 1 m s−1 or stronger. The area should be larger than 1 km2 and maintained for 3 min or more. The tracking for an updraft core was also performed by the same procedure as that for a precipitation cell. When two cores at t + 30 s overlap with the core at t, the same selection as that for a precipitation core is applied.
Figure 2 shows the schematics of identifying and tracking precipitation cores and updraft cores in the specific six cases. When the volume of 1 km3 or the area of 1 km2 is maintained for less than 3 min, the region is not identified as a precipitation core or updraft core (case 1). When the volume of a precipitation core becomes less than 1 km3 or the area of an updraft core becomes less than 1 km2 at time t, and the volume is larger than 1 km3 or the area is larger than 1 km2 at t −30 s and t + 30 s, the core is continuously tracked (case 2). When two cores merge into one core, the core is identified as the one that appeared earlier (case 3). When a precipitation core or updraft core is separated into two cores, the continuous core is selected as the core that has the larger overlapping volume or area at t + 30 s (cases 4–6). When the other core having the smaller overlapping volume is larger than 1 km3 or the area is larger than 1 km2 and is maintained for 3 min or more, the precipitation core or updraft core is identified as a branched core and indicated by a hyphenated sub-number (case 4). When a precipitation core or updraft core separates into two cores that merge into one core within 3 min, the two precipitation cores are identified individually. For the updraft core, on the other hand, only the updraft core having the larger overlapping volume is identified and the smaller one is ignored (case 5). It should be noted that since the separation and merging of updraft cores were more frequently observed, updraft cores that merged into another one within 3 min were not identified (cases 3 and 5). When the smaller overlapping volume is larger than 1 km3 or the area is larger than 1 km2 but is maintained for less than 3 min, the region is not identified as a precipitation core or updraft core (case 6).
3. Brief description of the environmental situation
The surface weather map at 15:00 LST on 7 August 2015 (Fig. 3a) shows that synoptic forcing was not significant around the analysis area. Figure 3b shows the surface wind and equivalent potential temperature derived from the JMA-MA dataset. At the surface, northwesterly and southwesterly winds blew into the analysis area from the north and south, respectively. These different winds resulted in convergence and/or confluence around the analysis area. The equivalent potential temperature was higher than 360 K in Osaka Bay, approximately 20 km south of the analysis area.

Vertical profiles of the average temperature, dew-point temperature, and wind speed and direction in the analysis area (Fig. 4) were also obtained from the JMA-MA dataset at 15:00 LST, about an hour before the storm was generated. The temperature was 34°C, and the relative humidity was 48 % at the surface, while the temperature was −5.7°C at 500 hPa (about 5.9 km ASL). The freezing level was located at about 5.0 km ASL, and the vertical wind shear was very weak between the surface and 500 hPa (about 5.9 km ASL). The lifting condensation level (LCL), level of free convection (LFC), and equilibrium level (EL) for an air parcel being lifted adiabatically from 950 hPa (about 0.6 km) were 1.4, 2.3, and 13.5 km ASL, respectively. The convective available potential energy (CAPE) was large (2,172 J kg−1), while the convective inhibition (CIN) was small (18 J kg−1). These conditionally unstable conditions in the environmental atmosphere were favorable for the vigorous development of convective clouds around the analysis area.

4. Results
4.1 Characteristics of the precipitation cell
An isolated convective storm developed within the observation ranges of the Suita and Kobe PAWRs, and the storm traveled southward to the west of the Suita PAWR. Figure 1 shows the distribution of total rainfall amounts, estimated from XRAIN, for the period of 16:00–18:00 LST, and the target cell in this study is enclosed by a rectangular box. The cell had two peaks that exceeded 40 mm in rainfall amount, located in the northern and southern parts of the cell. Many cells were generated successively to the east of the target cell. In particular, a new cell was generated next to the target cell after 17:00 LST, which was partly connected to the target cell at lower levels. Since the target cell and the new cell almost simultaneously developed in close proximity, they probably influenced each other. However, the new cell is separated from the target cell, according to contours of 10 mm in total rainfall amounts shown in Fig. 1. The lifetime and maximum volumes of the target cell observed by PAWRs were 104 min (16:21:00–18:05:00 LST) and 598 km3 at 17:23:00 LST, respectively. The maximum rainfall amount in the target cell was 52.6 mm for the period of 16:00–18:00 LST, and the maximum rainfall intensity was 127.8 mm h−1 at 16:59 LST, which were estimated from XRAIN. In this study, we focused on the mature stage of the cell during the period from 16:45:30 LST to 17:34:30 LST.
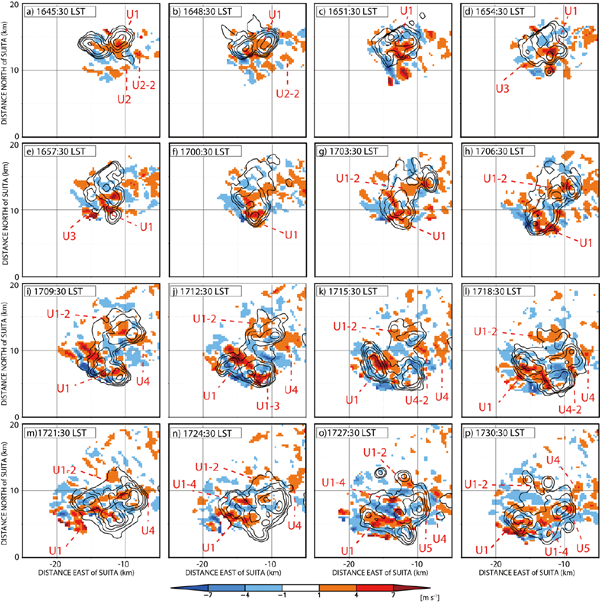
Figure 5 shows the distributions of vertical velocities at 2 km ASL and radar reflectivity at 6 km ASL during the mature stage of the target cell every 3 min. The outermost black contour indicates a 40 dBZ isoline, which is the reflectivity used to define a precipitation cell. At 16:45:30 LST (Fig. 5a), two reflectivity peaks appear in the eastern and western parts of the cell, and then these peaks merge into a single peak (Fig. 5c). The cell gradually expands in the north–south direction until 17:09:30 LST (Figs. 5d–i). At 17:03:30, two reflectivity peaks are located in the northern and southern parts of the cell (Fig. 5g). The northern part of the cell becomes small, while the southern part of the cell expands in the east–west direction (Figs. 5j–l). Two major reflectivity peaks are observed in the southeastern and western part of the cell at 17:18:30 LST (Fig. 5l). After these two peaks become unclear, a new peak is generated in the western part of the cell at 17:30:30 LST (Fig. 5p). An updraft core (U1) is maintained in the target cell, shifting southward until 17:03:30 LST (Figs. 5a–g) and then southwestward (Figs. 5h–p).
The target cell traveled toward the northwest at a speed of approximately 2.4 m s−1 from 16:45:30 LST to 16:50:00 LST, and then the cell almost stagnated. After that, the cell traveled again toward the southwest at a speed of approximately 3.3 m s−1 from 17:00:00 LST to 17:34:30 LST.
4.2 Characteristics of precipitation cores in the precipitation cell
To identify a precipitation core, the composite reflectivity was created by centering at the horizontal center point (Xc, Yc) calculated using Eq. (1) and averaging during the mature stage of the target cell. Figure 6 shows the composite reflectivity distributions at 2, 4, 6, and 8 km ASL. The areas of reflectivity less than 50 dBZ also show that the storm is the single-cell type. Figure 7 shows the distributions of the reflectivity deviations from the composite reflectivity at 6 km ASL every 3 min during the mature stage of the target cell. In the cell, nine precipitation cores (P1–P9) and one branched core (P4-2) are identified during the mature stage; all the identified precipitation cores in this study are listed in Table 1. Precipitation cores P1 and P2 are observed at 16:45:30 LST (Fig. 7a) in the western and eastern parts of the cell, respectively. The two cores merge into one core near the center of the cell at 16:48:30 LST (Fig. 7b). At 6 km ASL, the merged core P1 is located on the northern side of the cell (Figs. 7c, d) and then dissipates at 16:57:30 LST (Fig. 7e). Precipitation core P3 appears in the southern part of the cell from 17:00:30 LST to 17:05:00 LST (Figs. 7f, g). After P3 becomes smaller, precipitation core P4 also develops in the southern part of the cell at 17:06:30 LST (Fig. 7h). Then, P4 shifts southeastward, and precipitation core P5 is identified in the northern part of the cell (Figs. 7i, j). After 17:12:30 LST, precipitation core P6 begins to develop in the southwestern part of the cell (Figs. 7j–l). These three cores (P4, P5, and P6) appear simultaneously for 1.5 min beginning at 17:12:30 LST (Fig. 7j). At 17:18:30 LST, P4 and P5 dissipate, and precipitation core P7 develops in the southeastern part of the cell (Fig. 7l). Precipitation core P8 is identified to the northeast of P7 at 17:21:30 LST (Fig. 7m) and merged with P7 within 2 min. After P7 dissipates, precipitation core P9 develops in the southwestern part of the cell at 17:30:30 LST (Fig. 7p).


The characteristics of the precipitation cores are summarized in Table 1. The lifetimes of the precipitation cores are from 4.5 min to 14.5 min, except for the branched core (P4-2) and the cores that merged into other cores (P2 and P8). These lifetimes are similar to those in previous studies, e.g., approximately 15 min (Kim et al. 2012) and 2–28 min with an average of 13.9 min (Shusse et al. 2015). P7 has the largest volume (41.6 km3) and the longest lifetime (14.5 min). The average reflectivities in all the precipitation cores are in the range of 56–59 dBZ. The average and maximum areas of the precipitation cores in the table are estimated referring to the areas at 6 km ASL during their lifetimes. The average areas of P1, P6, P7, and P8 are larger than 3.5 km2, and the maximum areas are larger than 6.0 km2. The first core P1 reached the highest altitude (11 km) among the precipitation cores. These results indicate that the more vigorously developed cores were P1 and P7, which caused two major peaks in the total rainfall distribution (Fig. 1). The maximum rainfall intensity was observed by XRAIN in the dissipation stage of P1.

Figure 8 shows the time series of the maximum updraft at 2 km ASL within the north–south range of the target cell. The cell area shown by the dashed line in Fig. 8 is the easternmost and westernmost edges of the cell above 2 km ASL within the north–south direction obtained by every 30-s observation. Black, gray, and blue lines indicate the trajectories of the centers of the identified updraft cores. The centers were calculated using Eq. (1) in the plane at 2 km ASL. The updraft intensity changes frequently for a few minutes, and the centers of the updraft cores oscillate westward and eastward.

The updraft cores identified in this study are listed in Table 2. In the target cell, five updraft cores and five branched updraft cores were identified. Updraft cores U2, U4, and U5 finally merged into other updraft cores U1, U1-4, and U1-4, respectively. U1 is located roughly near the center of the cell until 17:00 LST (Figs. 5a–e), and then it shifts toward the southern or southwestern part of the cell and separates into U1-2 (17:01:30 LST), U1-3 (17:10:00 LST), and U1-4 (17:22:30 LST), which appear in the northeastern, southeastern, and eastern parts of the cell, respectively (Figs. 5f–p).

In the eastern part of the cell, updraft cores U2, U4, and U5, and branched cores U2-2 and U4-2 are identified, and updraft core U3 is identified in the western part of the cell (Fig. 5). In the east–west direction, U1, U2, U1-2, U4-2, and U5 shift westward, U2-2, U4, U1-3, and U1-4 shift eastward, and U3 is almost stationary (Fig. 8). U1-4 merges with U1 at 17:30:00 LST and then separates in the next 30 s (Fig. 8). When the merge and separation of U1-4 were observed, the structures of updrafts and downdrafts were complicated (Fig. 5p). These structures could not be resolved sufficiently in this spatial resolution. U1-3 with U1 and U4-2 with U4 showed similar merges and separations. In Fig. 8, the center of U1-4 shifts westward and eastward in a short time around 17:30 LST because of the merges and separations. It became difficult to track updraft cores in the dissipating stage of the cell. Except for U3, all the updraft cores separate or merge with other updraft cores.
The maximum vertical flux of water vapor (VFWV) and water vapor inflow amount (WVIA) are evaluated from water vapor density, which is calculated from average temperature in the analysis area at 2 km ASL derived from the JMA-MA data. The areas of updraft cores are assumed to have a relative humidity of 100 % with an average temperature of 17.6°C at 800 hPa (about 2.1 km ASL). VFWV is the amount of water vapor lifted by updraft cores per unit area per unit time. WVIA is the total VFWV in all the areas of updraft cores. The total WVIA is obtained by integrating the total VFWV during the lifetime in Table 2. Although these estimations include some uncertainties, mostly because of the constant water vapor density, the estimated values of WVIA are of the same order of magnitude as those of a previous study (Shusse and Tsuboki 2006). The largest and longest updraft core was U1, which lasted for 73.5 min from 16:26:30 LST to 17:40:00 LST. The largest VFWV was associated with U3, and the second-largest VFWV was associated with U1. The WVIA for U1 was several times larger than those of the other updraft cores, which indicates that U1 supplied the largest amount of water vapor to the cell.
4.4 Three-dimensional structure of developing precipitation cores P1 and P2
The time changes of the center, top, and bottom heights of the target cell and precipitation cores are shown in Fig. 9. Precipitation cores P2, P4-2, and P8 are not shown in the figure for simplicity. The bottom heights of large precipitation cores P1, P6, and P7 reach down to 2 km ASL. The center and bottom heights of the precipitation cores ascend within the several minutes before dissipation. The evolution of cores was caused by the separation of the lower part of the precipitation cores, which dissipated within 3 min (not shown). In this study, we did not focus on regions smaller than 1 km3 or those having a shorter lifetime than 3 min, even though positive deviations of reflectivity were greater than 7 dBZ. However, these regions (termed as fragments) affected the movement of precipitation cores.

Figure 10 shows the three-dimensional changes of P1 and P2 every 2 min. The top and middle panels show the horizontal distributions at 2 km ASL and the vertical distributions in the east–west direction of the maximum values in the north–south direction, respectively. The bottom panels are the same as the middle panels, but display those in the north–south direction of the maximum values in the east–west direction. The colors indicate the reflectivity; the black thin contours indicate reflectivity deviations of 4, 7, and 10 dBZ; and the thick contours indicate the edge of the precipitation cores. At 16:45:30 LST (Figs. 10h, o), P1 and P2 appear in the western and eastern parts of the cell, respectively. These precipitation cores develop (Figs. 10i, p) and then merge after 16:48:30 LST (Figs. 10j–n, q–u). The top height of merged core P1 reaches over 10.0 km ASL from 16:49:30 LST (Figs. 10j, q) to 16:51:00 LST (not shown). P1 tilts northward with increasing height during the period from 16:49:30 LST to 16:53:30 LST (Figs. 10j–l, q–s). At 16:49:30 LST, the part of P1 falls down and reaches 2 km ASL (Fig. 10c), the areas of which become larger after 2 min (Fig. 10d), and then three major regions with greater reflectivity are found at 16:53:30 LST (Fig. 10e). At 16:55:30 LST, the southern part of P1 has fallen down, while the northern part of P1 remains aloft (Figs. 10m, t). After that, the center of P1 ascends slightly with reduced volume and weakened reflectivity until 16:57:30 LST (Figs. 10m–n, t–u). The ascent of the center after the vertical separation indicates the buoyant motion of the air parcels, including precipitation particles. The falling off of large precipitation particles causes an upward motion because the air parcels can obtain positive buoyancy due to water unloading (Takeda et al. 1982).

Figure 11 shows the horizontal wind vectors and vertical velocities at 2 km ASL while precipitation core P1 is developing. The outer and inner bold lines indicate the edges of the target cell and precipitation cores at 6 km ASL, respectively. At 16:45:30 LST, updraft core U1 has two peaks in the western and eastern parts of the cell, and P1 and P2 appear above the western and eastern peaks, respectively (Fig. 11a). The two peaks gradually shift to the center of the cell as P1 and P2 merge near the center until 16:49:30 LST (Figs. 11b–e). Then, U1 intensifies in the southern part of the cell, and merged core P1 remains in the northern part of the cell at 6 km ASL (Figs. 11f–h). The northerly wind converges with the northeasterly wind at 16:45:30 LST (Fig. 11a), and then the northwesterly wind becomes dominant around the area of U1 (Figs. 11b–h).
4.5 Relationship between the precipitation cores and updraft cores
The trajectories of the centers of U1 and the branched updraft cores U1-2, U1-3, and U1-4 until 17:34:30 LST are shown by colored dots and triangles in Fig. 12. Most of the centers shift from the northeast to the southwest, while the centers of U1-3 and U1-4 shift southeastward after 17:00 LST. The center of U1-2 moved along almost the same trajectory as that of U1 but about 30 min later. The colored contours and dashed lines indicate the areas of the precipitation cores and the target cell at 6 km ASL, respectively, when each precipitation core attains maximum area. The cell areas are drawn when the maximum areas of P1 and P9 are observed. All the precipitation cores are generated around the trajectories of the updraft cores.

The volume of the target cell is largest at 17:23:00 LST when the volume of P7 reaches its maximum (Fig. 13a). As the volume of the cell increases, the maximum volumes of the precipitation cores also increase, except for P1. Figures 13b and 13c show the temporal changes of VFWV and WVIA estimated from the total updraft cores, which are compared with the volume of the cell and the total volume of the precipitation cores. When the total volume of the precipitation cores decreases, VFWV increases around 16:55 LST, 17:10 LST, and 17:25 LST (Fig. 13b). At these times, updraft cores are intensified in the southern and southwestern parts of the cell (Figs. 5e, j, o), because the outflow caused by precipitation particles reaching the ground makes a convergence with the inflow in the south and southwest, and strengthens the convergence locally. In contrast, WVIA continues to increase and is proportional to the volume of the cell without a clear relationship to the total volume of the precipitation cores (Fig. 13c). The correlation coefficient between WVIA calculated from the total updraft cores and the volume of the cell was 0.75. At low levels, warm and moist air was advected from the southwest and was lifted to the LFC (Figs. 2, 3). These analysis results indicate that the updraft cores continued to supply water vapor to the cell by changing their area and intensity.

5. Discussion
5.1 Definition dependency of the cell, precipitation core, and updraft core
The storm examined in this study is a single cell defined by a threshold of 40 dBZ. When the threshold is changed to 50 dBZ, the storm is still considered a single cell, as shown in Fig. 6. Furthermore, when the threshold is changed to 55 dBZ, the storm is separated into several cells. Each cell in this case has almost the same characteristics as the precipitation cores described in the previous sections, and one of the cells causes heavy rainfall (a rainfall rate of more than 100 mm h−1) during its lifetime less than 15 min. If such a short-lived precipitation cell produced heavy rainfall, the analysis is inconsistent with previous studies on convective cells (Kato and Maki 2009; Kim et al. 2012).
The lifetimes of the precipitation cores were of the same order of magnitude as those in previous studies (Kim et al. 2012; Shusse et al. 2015). In addition, each precipitation core had the following same characteristics: a core was developed above the melting layer and then generally descended to the ground (e.g., Kim et al. 2012; Shusse et al. 2015). A substructure with such characteristics in a storm has been treated as a precipitation core. In this study, the threshold of a radar reflectivity deviation of 7 dBZ is used for the definition of precipitation cores. The precipitation core regions larger than 7 dBZ deviation correspond to regions with a reflectivity of approximately 55 dBZ or greater as shown in Fig. 10. When the threshold of the reflectivity deviation was to take on a larger value, the volume and lifetime of each core decreased. In contrast, when the threshold was to take on a smaller value, the volume and lifetime of each core increased, and the number of precipitation cores decreased.
When the threshold velocity of updraft cores was changed to 4 m s−1, the number of updraft cores with a lifetime less than 3 min increased. In this case, since the small updraft cores were scattered in the target cell, it became difficult to examine the relationship between the updraft cores and the precipitation cores. Therefore, that change of the threshold for updraft cores is inappropriate.
5.2 Developing and dissipating mechanisms of precipitation cores P1 and P2
Updraft core U1 is first detected in the northern part of the target cell where the northerly wind converges with the northeasterly wind at 16:45:30 LST (Fig. 11a). During the merging of P1 and P2, the northeasterly wind converges with the northwesterly wind at the center of the cell (Figs. 11b–g), where U1 becomes large and intense. The volume of P1 reaches its maximum at 16:50:00 LST above U1 (Figs. 11e, f). At 16:52:30 LST, the easterly component of wind becomes weak in the eastern part of the cell, while the northwesterly wind becomes dominant in the southern part of the cell (Fig. 11h). As U1 shifts to the south, P1 becomes smaller with increasing distance from U1 (Figs. 5d–f), which indicates that falling fragments separated from P1 disturb the low-level airflow. During this period, the northerly wind is dominant at 2 km ASL, whereas the southwesterly wind originates from the region of higher equivalent potential temperature and converges with the northwesterly wind in the analysis area below 2 km ASL (Fig. 3b). The change in the convergence below 2 km ASL was probably caused by the balance of the southwesterly and northwesterly winds and thus affected the movement and intensification of the updraft cores. The southwesterly inflow region shifts southwestward in association with the movements of the target cell and major updraft core U1 after 17:00 LST (Figs. 5f–p). The convergences of the southwesterly and northwesterly winds were continuously observed at 30-s intervals, which enabled us to track the updraft cores.
When P1 is descending, the core tilts from south to north with height (Fig. 10). At 2 km ASL, U1 shifts to the southern part of the cell, and the downdraft is gradually intensified in the northern part of the cell (Figs. 11g, h). In the northern region of P1, the supply of water vapor is cut off, and a relatively large fragment falls down from the middle to lower levels (x = 12.0 km, y = 10.5 km, z = 2–4 km in Figs. 10d, k, r). Above 4 km ASL, P1 remains aloft (Figs. 10k–n, r–u). In the southern region of P1, water vapor is continuously transported upward by the updraft. At that time, the winds evaluated from dual-Doppler analysis are northerly in the lower layer and southerly above (not shown). As a result, the vertical shear temporarily increased, and the precipitation core tilted to the north. Around the precipitation core, the updraft also tilted northward with increasing height at 16:51:00 LST (not shown).
After 16:50 LST, P1 was separated into fragments, and most of the fragments descended to the ground (not shown). Since P1 remains aloft after the separations, the center oscillates vertically (Fig. 9). We speculate that relatively large positive buoyancy obtained by water unloading increased the top height of P1 during the few minutes after the separation. In particular, the center, bottom, and top height of P1 tend to increase after 16:55 LST (Fig. 9). A similar dissipation process was observed in the lifetime of the other precipitation cores.
6. Summary
An isolated convective storm was observed using two PAWRs that can complete one volume scan in just 30 s. The observations of two PAWRs enable us to perform dual-Doppler analysis every 30 s. The storm caused localized heavy rainfall on 7 August 2015 in the Kinki District, western Japan.
We investigated the relationship between precipitation cores and updraft cores in the storm, and vertical velocities were estimated by the dual-Doppler analysis. A three-dimensional contiguous region with reflectivity values greater than 40 dBZ is defined as a precipitation cell for the present storm. Composite reflectivity is created by centering on the areal center of the precipitation cell and averaging for the period during the mature stage of the cell. Then, the three-dimensional contiguous region with a positive reflectivity deviation greater than 7 dBZ from the composite data above 2 km ASL and a volume of over 1 km3 above 5 km ASL is defined as a precipitation core. An updraft core is defined as a contiguous region with vertical velocities larger than 1 m s−1 for an area of over 1 km2 at 2 km ASL. The identified precipitation cores and updraft cores should be maintained for 3 min or more.
The maximum volume of the target cell was 598 km3, and its lifetime was 104 min. We focused on the period of 49 min in the mature stage of the cell. The cell had nine precipitation cores with lifetimes of 4.5–14.5 min. The number of identified updraft cores was five, and the longest updraft core U1 lasted for 73.5 min, which branched into four cores (U1, U1-2, U1-3, and U1-4). All the precipitation cores were observed along the trajectory of the four cores, which are shown schematically in Fig. 14. Two thick black arrows indicate two major trajectories of the updraft cores, which are separated about one hour after their first appearance. U1 appeared approximately 5 min after the target cell generated. At the beginning of the mature stage of the cell, U1 was almost stationary, and precipitation cores P1 and P2 appeared and merged above U1 in that period. After that, U1 became strong and large at the center of the cell, when the top height of merged core P1 reached 11 km ASL. As U1 shifted southward, P1 started to descend. After P1 dissipated, P3 and then P4 developed in the southern part of the cell. P4 temporarily separated into two cores P4 and P4-2, and then P4 merged again with P4-2 in the southeastern part of the cell. At the same time, P5 and P6 were formed in the northern and southwestern parts of the cell, respectively. After P4 dissipated, P7 developed in the southeastern part of the cell, and then P7 merged with P8, which was generated just to the northeast of P7. The cell became the most vigorous at the time when the volume of P7 peaked. After all the precipitation cores dissipated, a new precipitation core P9 developed in the southwestern part of the cell.

Owing to the fast scanning ability of the PAWRs, an updraft that rapidly changes its location and intensity can be tracked and identified as an updraft core. The evolutions of the updraft cores and precipitation cores in the target cell were examined in detail. As a result, the evolutions of the updraft cores and precipitation cores were different, although they influenced each other. Additionally, all the updraft cores continued to supply water vapor to the cell by changing their location and intensity that were changed associated with the precipitation core evolutions. In this study, we found that the isolated storm exhibited structures of multi-precipitation cores and multi-updraft cores. To investigate the variation of their structures, it is necessary to study many other convective storms using high spatiotemporal resolution observations. Statistical studies on convective storms, which are characterized by precipitation cores and updraft cores, will help to clarify the mechanisms of the rapid development of convective storms, providing useful data for reducing the severity of disasters caused by localized heavy rainfall. In addition, full velocity datasets from the surface to the top of the storms are required to investigate the three-dimensional structure of the updraft cores using any other dual-Doppler analysis method.
Previous studies have equated a dynamically defined convective cell to a precipitation cell defined using radar-echo intensity in isolated convective storms. The structure and evolution of the storms have been described using the concept of the convective cell, while in this study those of the present storm are described using precipitation cores and updraft cores that were clearly defined with threshold values of radar reflectivity and vertical velocity. We found that precipitation cores and updraft cores had different evolutionary characteristics in the present storm.
Supplements
Supplement 1 shows animation of the identified updraft cores at a 30-s interval. Same as Fig. 5.
Acknowledgments
We express our sincere thanks to Dr. Y. Yamada of the Meteorological Research Institute for valuable suggestions on the quality control of Doppler velocities. We are grateful to the members of the Laboratory of Meteorology of the Institute for Space-Earth Environmental Research, Nagoya University. We also thank Prof. T. Kato of the Meteorological College/Japan Meteorological Agency and two anonymous reviewers for their constructive comments, which helped us to improve the original manuscript. This research was conducted under a contract of R&D for Expansion of Radio Wave Resources, organized by the Ministry of Internal Affairs and Communications, Japan. This work was jointly supported by KAKENHI Grants 15H05765 and 16H06311, and the Virtual Laboratory for the Earth's Climate Diagnostics program. The XRAIN product of rainfall intensity was provided by the National Institute for Land and Infrastructure Management (NILIM). X-band PAWRs were developed by the Toshiba Corporation, Osaka University, and the National Institute of Information and Communications Technology (NICT).
Appendix: Comparison of the radar reflectivity observed by PAWR and XRAIN
Since the PAWR data are affected by ground clutter, range sidelobes, and rainfall attenuation, we compared the radar reflectivity values observed by PAWR and XRAIN. The XRAIN data correct the rainfall attenuation using polarimetric parameters (Maesaka et al. 2011). Additionally, four polarimetric radars were used for the composite XRAIN data in the Kinki region: Rokko (34.77°N, 135.26°E), Katsuragi (34.35°N, 135.44°E), Tanokuchi (34.83°N, 135.69°E), and Jubusan (34.83°N, 135.91°E). Since the range resolution is 150 m and 12 elevation angles below 15° are scanned every 5 min, the effective radius of the influence of the weighting function is 1.0 km (Kim et al. 2012), and then the three-dimensional grid data with horizontal and vertical grid intervals of 250 m are calculated. Other radar specifications that produce XRAIN data are outlined in Maesaka et al. (2011). For comparison with the XRAIN data, the PAWR data were produced from greater reflectivity values of the Suita and Kobe PAWRs and averaged for each grid over the 5-min interval.
The comparison was performed only at 2 km ASL from 16:45 LST to 17:35 LST in the analysis area (Fig. 1). Figure A1 shows all the grid point data observed by PAWR and XRAIN during the 50 min. In the region with PAWR reflectivity values lower than 40 dBZ, the XRAIN data are widely scattered, especially in the smaller values; however, in the region with PAWR reflectivity values greater than 40 dBZ, the PAWR data sufficiently correspond to the XRAIN data with a correlation coefficient of 0.79, and the average bias (average difference) and standard deviation are 1.0 dBZ and 3.4 dBZ, respectively. These observation data indicate that PAWR reflectivity data greater than 40 dBZ are less affected by ground clutter, range sidelobes, and rain attenuation.
References
- Byers, H. R., and R. R. Braham, Jr., 1949: The Thunderstorm: Report of the Thunderstorm Project. U.S. Government Printing Office, 287 pp.
- Hirano, K., and M. Maki, 2010: Method of VIL calculation for X-band polarimetric radar and potential of VIL for nowcasting of localized severe rainfall –Case study of the Zoshigaya downpour, 5 August 2008–. SOLA, 6, 89-92.
- Hirano, K., and M. Maki, 2018: Imminent nowcasting for severe rainfall using vertically integrated liquid water content derived from X-band polarimetric radar. J. Meteor. Soc. Japan, 96A, 201-220.
- Ishihara, M., 2012: Radar echo population of thunderstorms generated on the 2008 Zoshigaya-rainstorm day and nowcasting of thunderstorm-induced local heavy rainfalls. Part II: A feasibility study on nowcasting of thunderstorm-induced local heavy rainfalls. Tenki, 59, 563-577 (in Japanese).
- Isoda, F., S. Satoh, and T. Ushio, 2018: Temporal and spatial characteristics of localized rainfall on 26 July 2012 observed by phased array weather radar. SOLA, 14, 64-68.
- Japan Meteorological Agency, 2013: Outline of the operational numerical weather prediction at the Japan Meteorological Agency. 201 pp. [Available at https://www.jma.go.jp/jma/jma-eng/jma-center/nwp/outline2013-nwp/index.htm.]
- Kato, A., and M. Maki, 2009: Localized heavy rainfall near Zoshigaya, Tokyo, Japan on 5 August 2008 observed by X-band polarimetric radar –Preliminary analysis–. SOLA, 5, 89-92.
- Kim, D.-S., M. Maki, S. Shimizu, and D.-I. Lee, 2012: X-band dual-polarization radar observations of precipitation core development and structure in a multicellular storm over Zoshigaya, Japan, on August 5, 2008. J. Meteor. Soc. Japan, 90, 701-719.
- Kingsmill, D. E., and R. M. Wakimoto, 1991: Kinematic, dynamic, and thermodynamic analysis of a weakly sheared severe thunderstorm over northern Alabama. Mon. Wea. Rev., 119, 262-297.
- Maesaka, T., M. Maki, K. Iwanami, S. Tsuchiya, K. Kieda, and A. Hoshi, 2011: Operational rainfall estimation by X-band MP radar network in MLIT, Japan. Proceedings of the Thirty-fifth Conference on Radar Meteorology, 12-18. [Available at https://ams.confex.com/ams/35Radar/webprogram/Manuscript/Paper191685/35RADAR_Maesaka.pdf.]
- Mizutani, F., T. Ushio, E. Yoshikawa, S. Shimamura, H. Kikuchi, M. Wada, S. Satoh, and T. Iguchi, 2018: Fast-scanning phased-array weather radar with angular imaging technique. IEEE Trans. Geosci. Remote Sens., 56, 2664-2673.
- Nakakita, E., H. Yamabe, and K. Yamaguchi, 2010: Earlier detection of the origin of very localized torrential rainfall. Annu. J. Hydraul. Eng., 54, 343-348 (in Japanese).
- Nelson, S. P., and R. A. Brown, 1982: Multiple Doppler radar derived vertical velocities in thunderstorms. I: Error analysis and solution techniques. NOAA Tech. Memo., ERL NSSL, No. 94, 10 pp.
- Ray, P. S., C. L. Ziegler, W. Bumgarner, and R. J. Serafin, 1980: Single- and multiple-Doppler radar observations of tornadic storms. Mon. Wea. Rev., 108, 1607-1625.
- Ruiz, J. J., T. Miyoshi, S. Satoh, and T. Ushio, 2015: A quality control algorithm for the Osaka phased array weather radar. SOLA, 11, 48-52.
- Shimizu, S., and H. Uyeda, 2012: Algorithm for the identification and tracking of convective cells based on constant and adaptive threshold methods using a new cell-merging and -splitting scheme. J. Meteor. Soc. Japan, 90, 869-889.
- Shimizu, S., H. Uyeda, Q. Moteki, T. Maesaka, Y. Takaya, K. Akaeda, T. Kato, and M. Yoshizaki, 2008: Structure and formation mechanism on the 24 May 2000 supercell-like storm developing in a moist environment over the Kanto Plain, Japan. Mon. Wea. Rev., 136, 2389-2407.
- Shusse, Y., and K. Tsuboki, 2006: Dimension characteristics and precipitation efficiency of cumulonimbus clouds in the region far south from the mei-yu front over the eastern Asian continent. Mon. Wea. Rev., 134, 1942-1953.
- Shusse, Y., K. Tsuboki, B. Geng, H. Minda, and T. Takeda, 2005: Structure and evolution of deeply developed convective cells in a long-lived cumulonimbus cloud under a weak vertical wind-shear condition. J. Meteor. Soc. Japan, 83, 351-371.
- Shusse, Y., M. Maki, S. Shimizu, K. Iwanami, T. Maesaka, S. Suzuki, N. Sakurai, and R. Misumi, 2015: Relationship between precipitation core behavior in cumulonimbus clouds and surface rainfall intensity on 18 August 2011 in the Kanto Region, Japan. J. Meteor. Soc. Japan, 93, 215-228.
- Takeda, T., K. Isono, M. Wada, Y. Ishizaka, K. Okada, Y. Fujiyoshi, M. Maruyama, Y. Izawa, and K. Nagaya, 1982: Modification of convective snow-clouds in landing the Japan sea coastal region. J. Meteor. Soc. Japan, 60, 967-977.
- Tsuchiya, S., M. Kawasaki, and H. Godo, 2015: Improvement of the radar rainfall accuracy of XRAIN by modifying of rainfall attenuation correction and compositing radar rainfall. J. Japan Soc. Civ. Eng., 71, I_457-I_462 (in Japanese).
- Tuttle, J. D., V. N. Bringi, H. D. Orville, and F. J. Kopp, 1989: Multiparameter radar study of a microburst: Comparison with model results. J. Atmos. Sci., 46, 601-620.
- Wakimoto, R. M., and V. N. Bringi, 1988: Dual-polarization observations of microbursts associated with intense convection: The 20 July storm during the MIST project. Mon. Wea. Rev., 116, 1521-1539.
- Yoshikawa, E., T. Ushio, Z. Kawasaki, S. Yoshida, T. Morimoto, F. Mizutani, and M. Wada, 2013: MMSE beam forming on fast-scanning phased array weather radar. IEEE Trans. Geosci. Remote Sens., 51, 3077-3088.


