Article
A Climatological Study of Southwesterly Flows and Heavy Precipitation in Taiwan during Mei-yu Seasons from 1979 to 2018
2021 Volume 99 Issue 4 Pages 913-931

Details
2021 Volume 99 Issue 4 Pages 913-931
This paper examined southwesterly flows and rainfall around the Taiwan area during the mei-yu seasons from 1979 to 2018. The occurrence percentage of the southwesterly flow events in southern Taiwan was highly correlated with 6-h accumulated rainfall and heavy precipitation in Taiwan, and those in northern Taiwan showed little correlation. Low pressure to the north of Taiwan and high pressure to the south exerted a large northward pressure gradient force across the Taiwan area, favoring the formation of southwesterly flows and rainfall in southern Taiwan. During an active year of southwesterly flow events, the Pacific high weakened and moisture was transported along two paths in the early mei-yu season: one from the Bay of Bengal and the other from the south of the Pacific high. The moisture-laden air resulted in a high equivalent potential temperature near Taiwan, which, in turn, created a large equivalent potential temperature gradient to the north of Taiwan. This setting favored the activity of mei-yu fronts and produced a low-pressure environment. The pressure gradient thus increased, supporting the formation of southwesterly flows. The southwesterly flows then helped in transporting more moisture toward the Taiwan area, resulting in heavy rainfall as well as a further increase of equivalent potential temperature. This kind of positive feedback produces more fronts, stronger southwesterly flows, and heavier rainfall during the mei-yu season. The study also suggests that the meridional component of the vertically integrated water vapor transport over the South China Sea and the Philippines in the early mei-yu season can be used to predict the occurrence of southwesterly flows and heavy rain for the entire mei-yu season.
Taiwan, a subtropical island southeast of China, has a unique climate that is strongly regulated by East Asian monsoons. The monsoonal flows, including northeasterly in cold seasons and southwesterly in warm seasons, largely determine the seasonal rainfall in Taiwan (Ding and Chan 2005; Chen and Chen 2003; Chen et al. 1999). On the basis of studies employing long-term historical data, Chen and Chen (2003) categorized five different rainfall regimes in Taiwan: winter (December–February), spring (March to mid-May), mei-yu (mid-May to mid-June), summer (mid-June to August), and autumn (September–November). This paper primarily deals with the rainfall of the warm season regimes from April to August, especially mei-yu, which is predominantly related to the southwesterly monsoonal flow.
Mei-yu fronts, which are quasi-stationary fronts, often develop over southeastern China and move southward to Taiwan in mei-yu seasons, resulting in long periods of rainfall (e.g., Wang et al. 2014; Lin et al. 1992; Ding 1992; Chen and Liang 1992; Ray et al. 1991). The fronts usually appear on satellite images as elongated cloud bands that extend from southern China northeastward to Japan (Chen 2004). The cloud bands are typically embedded with mesoscale convective systems (MCS) that can bring heavy rainfall and cause serious disasters to the region (e.g., Ding and Chan 2005; Qian et al. 2004; Zhang et al. 2003; Kuo and Chen 1990). Furthermore, the mei-yu front is usually associated with low-level jets (LLJs) to their south, which play an important role in transporting warm moist air from the tropical ocean to the frontal zone (Chen et al. 2008; Chen, C.-S. et al. 2005; Li et al. 1997; Chen and Yu 1988). The wind direction of the LLJs is typically west-southwesterly to southwesterly, with wind speeds stronger than 15 m s−1 at low levels (e.g., 850 hPa) and decreasing both upward and downward (Chen et al. 2006; Chen, G. T.-J. et al. 2005; Chen et al. 2000). However, it is more common to find slightly weaker southwesterly winds across a rather broad area, which play almost the same role as LLJs do and are an important factor affecting the rainfall in Taiwan. Southwesterly flows are often used by the Taiwanese meteorology community to describe such conditions in a more general manner.
In summer, the southwest monsoon and tropical cyclones (TC) greatly influence the weather and climate in southeastern China and Taiwan (Chen and Shih 2012; Chen et al. 2010; Wang and Chen 2008; Chen et al. 2007). When a westward- to northwestward-moving TC passes over the northern and central parts of Taiwan, its circulation can combine with the summer monsoonal flow and result in enhanced southwesterly flows that extend from the northern South China Sea (SCS) to Taiwan (Liang et al. 2011; Chien et al. 2008). The southwesterly flows can provide efficient moisture transport from upstream regions and a confluent environment favorable for prolonged heavy rainfall in Taiwan (Chien 2014, 2015; Chien and Kuo 2011).
Chien and Chiu (2019) studied southwesterly flows and their relationship with rainfall in Taiwan and compared the formation mechanisms among different warm seasons, namely, spring, mei-yu, and summer, using 11 years of ERA-interim reanalysis data (Dee et al. 2011) from the European Centre for Medium-Range Weather Forecasts (ECMWF). To distinguish the large-scale and local-scale southwesterly, Chien and Chiu (2019) developed a methodology to define southwesterly flow events in the Taiwan area. They found that heavy rain in Taiwan during the warm seasons is often related to strong southwesterly flows around the Island. The axis location of southwesterly flows is important to determine rainfall in Taiwan because heavy rain often occurred when the axis was located over southern Taiwan. Therefore, in this study, we added another criterion to distinguish the axis location of southwesterly flows. In addition, we extended the amount of studied years from 11 to 40 years (1979–2018) in the current paper. With these new settings, this paper aims to examine the relationship between southwesterly flows and heavy rain in Taiwan during the mei-yu seasons at inter-annual time scale, which has not been well explored in the past. The key questions that are addressed include the following:
The southwesterly flows of this study were investigated using ERA-interim reanalysis data from the ECMWF. These data, with a horizontal resolution of 0.5° × 0.5° at six levels (1000, 925, 850, 700, 500, and 200 hPa) and at four times per day (0000, 0600, 1200, and 1800 UTC), were collected for analyses. The periods studied were the warm seasons from April 1 to August 31. Although these data were all similar to Chien and Chiu (2019), we extended the number of years from 11 to 40 years (1979–2018) in the current paper. The atmospheric state at every 6 h was labeled as an event. Thus, in total, 24480 events were evaluated in this study.
Following the method developed by Chien and Chiu (2019), we searched for southwesterly flow events by examining 850-hPa winds of the aforementioned ECMWF data in 14 boxes with a size of 2° × 2° surrounding Taiwan (Fig. 1). The averaged wind in each box was calculated first. Then, a southwesterly flow (hereafter, SW) event was identified if it met the following two criteria. First, of the 14 boxes, at least one box was required to have a mean wind speed greater than 12 m s−1 with a wind direction from 200° to 260° (which is referred to as the southwesterly wind direction in this study). Second, at least half of the 14 boxes were required having a southwesterly wind direction. While the former was set to identify events that had sufficiently strong southwesterly wind speeds, the latter was set to ensure that the wind event was a larger-scale southwesterly flow event, rather than a local southwesterly wind event. If any of the above two criteria were not met, the event was designated as a non-southwesterly flow event (hereafter, nonSW). Chien and Chiu (2019) found that rain in Taiwan was closely related to the axis of southwesterly flows and that heavy rain often occurred when the axis was located over southern Taiwan. Therefore, in this study, we added another criterion to distinguish the axis location of southwesterly flows. If there were more boxes having a mean southwesterly wind speed exceeding 12 m s−1 (similar to the first criterion) near northern Taiwan (boxes 1–7) than near southern Taiwan (boxes 8–14), the event was designated as a northern SW (hereafter, SWn) event. If not, it was designated as a southern SW (hereafter, SWs) event.

The 14 boxes (2° × 2°) surrounding Taiwan are the areas used for average calculation of winds to identify southwesterly flow events, with numbers showing centers of the boxes. The 28 blue dots are the locations of CWB weather stations of which rainfall observations are utilized for this study.
Figure 2 presents examples of SWn versus SWs events in mei-yu seasons. At 1800 UTC 12 June 2016, the axis of strong southwesterly winds was located around northern Taiwan at the 850-hPa level (Fig. 2a). There were 11 boxes surrounding Taiwan with a mean wind speed greater than 12 m s−1, and 14 boxes had a southwesterly wind direction. Therefore, this was defined as an SW event because both of the first two aforementioned conditions were met. Judged by the third condition, this event was further identified as an SWn event because there were more boxes in northern Taiwan (7) than in southern Taiwan (4) that had a mean southwesterly wind speed exceeding 12 m s−1. The 6-h accumulated rainfall from 3 h before to 3 h after the event time using rain gauge observations shows that rainfall occurred mostly over the southern and central mountain regions, with maxima around 40–50 mm (Fig. 2b). On the other hand, the second example at 0000 UTC 12 June 2012 (Fig. 2c) was designated as an SWs event because there were more boxes in southern Taiwan (7) than in northern Taiwan (0) that had a mean southwesterly wind speed exceeding 12 m s−1, in addition to the overall conditions that 7 boxes met the first criterion and 11 boxes met the second criterion. The axis of strong southwesterly winds obviously extended from southern Taiwan toward the northeast at the 850-hPa level. This event produced heavy rainfall in the 6-h time period over the entire island, especially in the mountain areas (Fig. 2d). The maximum rainfall reached about 200 mm in several places.

(a) The 850-hPa winds (color: wind speed, arrow: wind vector, unit: m s−1) for an example of the SWn events at 1800 UTC 12 June 2016 and (b) the 6-h accumulated rainfall (unit: mm) of the event from 3 h before to 3 h after (1500–2100 UTC 12 June 2016). (c, d) Same as (a, b) but for an example of the SWs events at 0000 UTC 12 June 2012.
In order to examine the relationship between the SW events and rainfall, we collected 40 years (1979–2018) of rainfall observations from the 28 Central Weather Bureau of Taiwan (CWB) weather stations. We defined the 6-h rain intensity [hereafter, R; unit: mm (6 h)−1] as the accumulated rainfall from 3 h before to 3 h after the event time. Heavy precipitation was designated for a weather station when its R exceeds 20 mm (6 h)−1. The coverage percentage of such heavy precipitation in Taiwan was defined as heavy precipitation percentage (hereafter, HPP; unit: %),
 |
Figure 3a shows the average occurrence percentage of SWs, SWn, and HPP, and the average R of all 28 CWB stations in 40 years (1979–2018) from April 1 to August 31 using 11-d running mean. The mean (µ) and standard deviation (σ) of each curve are shown in Table 1. It is clear that SWs was highly correlated with R and HPP. They were all small before May 12 and subsequently began to increase sharply. After reaching their maxima around June 7, all three curves started to decline until early July when the typhoon season began in Taiwan. On the other hand, SWn exhibited a quite different pattern compared with the aforementioned three curves, and it had a higher/lower percentage than SWs and HPP in spring/summer. Furthermore, the peak of SWn had a lag of ∼ 11 d compared with that of SWs because southwesterly flows originated first in the south and then gradually propagated toward the north. Figure 3b shows the same plot but using 5-d running mean. The mean and standard deviation, which were close to those of the 11-d running mean, are shown in Table 1. The curves in the 5-d running mean present a similar trend as aforementioned but with more details than those in the 11-d running mean. They also clearly show that the peaks of the SWs event, R, and HPP almost occurred on the same date. Table 2 further shows high correlation coefficients between SWs and R (0.86/0.81) and between SWs and HPP (0.88/0.83) for 11-d/5-d running means. However, the correlation coefficients between SWn and R and between SWn and HPP were all negative and small no matter whether for 11- or 5-d running means. It is therefore evident that rainfall in Taiwan is closely related to southwesterly flow events in southern Taiwan but not in northern Taiwan. The reason for the high correlation is that as documented in the literature shown in the introduction (e.g., Chen et al. 2008; Ding and Chan 2005; Chien 2015), the southwesterly flows usually developed ahead of mei-yu fronts and transported moisture-laden air to the Taiwan area. Moisture flux convergence occurred, and MCS developed over the ocean southwest to Taiwan. When the MCS moved over land, it was further enhanced by the lifting effect of complex terrain and brought heavy rainfall in Taiwan.
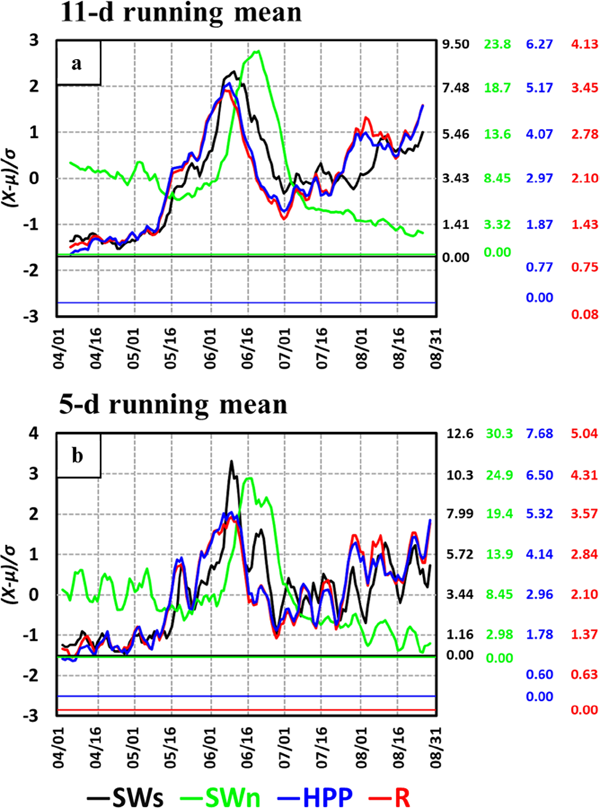
The average occurrence percentage of SWs (black), SWn (green), and HPP (blue) in 40 years (1979–2018) from April 1 to August 31. The average rain intensity of 28 CWB weather stations and 40 years for each date is also shown in red (R). An (a) 11- and (b) 5-d running mean is taken for all curves. The ordinate is shown in normalization by mean (µ) and standard deviation (σ) of each curve, with the original magnitudes (X) denoted in the right by corresponding colors and mean and standard deviation presented in Table 1.


According to the season definitions by Chen and Chen (2003) and Chien and Chiu (2019), we examined the average 6-h rain intensity (R) and (HPP) for all, nonSW, SW, SWs, and SWn events during the entire warm season (April 1–August 31), spring (April 1–May 14), mei-yu (May 15–June 15), and summer (June 16–August 31) from 1979 to 2018 (Fig. 4). The results showed that for the entire warm season and the three different seasons, R and HPP of the SW events were both higher than those of the nonSW events. Except in spring, the magnitudes of the former were all about double those of the latter, suggesting that southwesterly flows can provide favorable conditions for heavy rainfall in Taiwan, which is similar to the 11-year analysis presented in Chien and Chiu (2019). When the SW events were further grouped into the SWs and SWn events, it is interesting to see that R and HPP of the SWs events were both significantly larger than those of the SWn events. R of the SWs events was about four times larger than that of the SWn events, and HPP of the SWs events was even about six times larger. Furthermore, the SWn events and the nonSW events had about the same R and HPP. We can therefore conclude that during the warm season, the SWs events were the major periods of rain and heavy precipitation in Taiwan.

The average 6-h rain intensity (R, bar) and HPP (curve) for all, nonSW, SW, SWs, and SWn events during the entire warm season (April 1–August 31), spring (April 1–May 14), mei-yu (May 15–June 15), and summer (June 16–August 31) from 1979 to 2018.
The above analyses show that no matter whether in spring, mei-yu, or summer, SWs events contributed the most to rainfall in Taiwan. It is therefore important to examine the relationship between the SWs events and rainfall. Because the probability of SWs events was low in spring and rainfall was greatly affected by typhoons besides the monsoonal flow in summer, we decided to focus on studying the relationship between the SWs events and rainfall in the mei-yu season when the SWs events played an important role in rainfall (see Figs. 3, 4).
Figure 5 shows scatterplots of SWs occurrence percentage versus the mean 6-h rain intensity [R, mm (6 h)−1] over Taiwan and HPP (%) averaged for the entire mei-yu season from 1979 to 2018. When the mean SWs occurrence percentage was larger than 10 % in a particular year, all mean R values were larger than 3.0 mm (6 h)−1 (Fig. 5a). When the mean percentage was lower than 10 %, the mean R was mostly smaller than 3.0 mm (6 h)−1. Their correlation coefficient was about 0.58, and it passed the 99 % confidence level of the t-test. This result suggests that the SWs occurrence percentage can have a positive impact on rainfall in Taiwan. The scatterplot of SWs occurrence percentage versus HPP (Fig. 5b) shows the same result as Fig. 5a, with a similar correlation coefficient of 0.57. It is thus concluded that for the mei-yu season in a particular year that has more SWs events, there would be more rainfall and more heavy precipitation events.

Scatterplots of SWs occurrence frequency versus (a) the mean 6-h rain intensity [R, mm (6 h)−1] and (b) HPP (%) averaged for the entire mei-yu season from 1979 to 2018 (blue dots represent the seasonal mean for the 40 years). The linear regressions are also shown in dashed lines. The correlation coefficients of (a) is 0.58, and (b) 0.57.
Figure 6 shows the correlation coefficients between the mei-yu seasonally averaged variables and SWs occurrence percentage in 40 years (1979–2018). A positive/negative correlation coefficient represents that when a particular year has more SWs events, the corresponding variable is relatively larger/smaller in that year and vice versa. Figure 6a shows that a long belt of positive correlation coefficient between seasonally averaged 850 hPa x-component (the zonal component) wind and the SWs occurrence percentage extended from India, Bay of Bengal, Indo-China, the SCS, and Taiwan toward the northwestern Pacific. This indicated that westerly winds in these regions are positively correlated to the SWs events in Taiwan, especially over the SCS, where correlation coefficients were significantly large and passed the 95 % confidence level. Figure 6b shows a large positive correlation coefficient between the 850-hPa y-component (the meridional component) wind and the SWs occurrence percentage over the SCS, extending northeastward to Taiwan and the northwestern Pacific. Together with Fig. 6a, this finding indicates that stronger southwesterly winds at low levels (e.g., 850 hPa) over the SCS would increase the occurrence percentage of the SWs events in Taiwan. Because the southwesterly winds could help in transporting moisture toward the Taiwan area, a positive correlation coefficient was found between the 850-hPa specific humidity and the SWs events over southeastern China, Taiwan, and extending toward the northwestern Pacific (Fig. 6c). In the same areas, correlation coefficients between the 500-hPa omega and the SWs events were mostly negative (Fig. 6d), signifying that there would be a stronger upward motion when more SWs events appeared in a particular year. Combining Figs. 6c and 6d suggests that during an SWs event, rainfall would very likely happen in Taiwan and HPP would be large.

Correlation coefficients between the mei-yu seasonally averaged variables and SWs occurrence percentage in 40 years (1979–2018). The variables include (a) 850-hPa x-component wind, u, (b) 850-hPa y-component wind, v, (c) 850-hPa specific humidity, q, (d) 500-hPa vertical velocity, ω , (e) 850-hPa geopotential height, Z, (f) 850-hPa Δ Z/Δ y, (g) 850-hPa equivalent potential temperature, θ e , and (h) 850 hPa Δθ e/Δ y. Green meshes denote the areas that pass the 95 % confidence level of the t-test.
The pattern of low-level geopotential height is an important factor that determines the distribution of southwesterly flows near the Taiwan area (Chien and Chiu 2019). We therefore further examined correlation coefficients between the 850-hPa geopotential height and the SWs events (Fig. 6e) and found that negative correlation coefficients were located in the north and positive coefficients in the south of the domain. The separation line was positioned nearly around 20°N, passing the SCS and northeastward to the south of Taiwan. This finding indicates that low pressure to the north of Taiwan and high pressure to the south favored the occurrence of southwesterly flows in southern Taiwan. The region of large negative correlation coefficients was collocated with the area of the mei-yu frontal activity in East Asia (Wang 2006). The correlation coefficients between the y-component of the 850-hPa geopotential height gradient and the SWs events (Fig. 6f) show a long belt of large negative correlation coefficients extending from the SCS northeastward to Taiwan and the northwestern Pacific. It is clear that when the y-component of the 850-hPa geopotential height gradient was smaller in these areas, the SWs events would increase owing to the geostrophic adjustment process. Because the gradient was negative, a smaller gradient represented a larger southward-pointing pressure gradient in these areas. The positive correlation coefficients extending from southeastern China to southern Japan suggest that when the SWs events increased, the y-component of the 850-hPa geopotential height gradient would be larger (or smaller southward-pointing pressure gradient) in these areas because the major pressure gradient had shifted to the south of Taiwan. As a matter of fact, the correlation coefficient pattern in Fig. 6f was similar to that in Fig. 6a, except that the signs were reversed, due to the geostrophic relationship. A mei-yu front was usually associated with a high equivalent potential temperature to its south (Ding 1992). Figure 6g shows that a long belt of positive correlation coefficients between the 850-hPa equivalent potential temperature and the SWs events extended from southeastern China and Taiwan toward the Pacific. This indicated that when a mei-yu front was located north of the Taiwan area, there was more chance for the SWs events. It is noted that the correlation coefficient pattern was similar to that in Fig. 6c because the equivalent potential temperature is closely related to moisture. The correlation coefficients between the y-component of the 850-hPa equivalent potential temperature gradient and the SWs events (Fig. 6h) show that a narrow belt of negative correlation coefficient was located over the ocean north of Taiwan, extending from southeastern China to south of Japan. This corresponded to the region of frontal activity in mei-yu seasons where the equivalent potential temperature gradient was largely negative. The negative correlation coefficients suggest that when a mei-yu front was located to the north of Taiwan, the chance of the SWs events was higher.
In order to understand the characteristics of the SWs events, we examined the seasonally average occurrence percentage of SWs events in the mei-yu season for each year from 1979 to 2018 (Fig. 7a). The highest percentage (18.8 %) occurred in 2005, and the lowest (0 %) in 1980 and four other years. The 40-year mean was 5.2 %, and the standard deviation was 4.5 %. This large standard deviation indicates a significant variation among different years. From a wavelet analysis, Fig. 7b shows that periods of 6 and 10 years had larger power and were more evident after 1998. The analysis also shows that SWs events in Taiwan exhibited an abrupt decadal change in the late 1990s.

(a) The seasonally average percentage of SWs events in the mei-yu season from 1979 to 2018. The gray solid line denotes mean, and dashed lines represent one standard deviation. Red/blue dots are SWs active/inactive years. (b) The wavelet analysis of SWs percentage from 1979 to 2018, with the wavelet power (unit: %2) of each period (unit: year) shown in the left and yearly integrated wavelet power for each period in the right.
We then defined an active/inactive year of the SWs events as the year in which the average occurrence percentage of SWs events was higher/lower than the mean plus/minus one standard deviation. It was found that there were five active years: 2001 (14.1), 2005 (18.8), 2006 (18.0), 2012 (10.9), and 2017 (10.2 %), which occurred after 1998, and five inactive years: 1980 (0), 1987 (0), 1989 (0), 1991 (0), and 1992 (0 %), which occurred before 1998.
Composite analyses were performed for the five active years (hereafter, AYM) and the five inactive years (hereafter, IYM), and they were compared with the climatological mean (hereafter, CM) of the 40 mei-yu seasons in 1979–2018. The CM at 850 hPa shows that the Pacific subtropical high extended from the central Pacific west-southwestward to the east of the Philippines (Fig. 8a). Low pressure was located over the Tibetan Plateau and central China. In between these two major pressure systems, a relatively large pressure gradient was observed over the northern SCS and southeastern China, providing favorite conditions for the formation of southwesterly flows in the mei-yu season. In the upstream areas of southwesterly flows, the eastern Bay of Bengal, Indo-China Peninsula, and western part of the SCS were the major regions of moisture sources. A large moisture gradient extended eastward from central China to the north of Taiwan. This corresponded to the frontal activity region (Thomas and Schultz 2019) and was clearly present in the equivalent potential temperature gradient of the climatological mean, as shown in Fig. 8b. In order to examine the amount and direction of total water vapor transport in the southwesterly flows, we calculated the integrated water vapor transport (IVT) according to Ralph et al. (2019). IVT is a vertically integrated water vapor flux from 1000 hPa to 200 hPa. The IVT of the CM clearly shows that the primary moisture source in Taiwan during a mei-yu season was southwesterly flows from the SCS (Fig. 8b). The southerly or southeasterly flow produced by the Pacific subtropical high could also play a secondary role. These moisture transports provided the major moisture supply of the mei-yu season and helped in maintaining large moisture and equivalent potential temperature gradients to the north of Taiwan, corresponding to the mei-yu frontal activity region. This region, extending from southeastern China, north of Taiwan, and to the south of Japan, favored the formation of upward motion shown in 500-hPa omega (Fig. 8c).

Forty-year climatological mean (CM) of (a) 850-hPa winds (vector, m s−1), geopotential height (contour, interval: 10 gpm), and specific humidity (color, g kg−1); (b) 850-hPa equivalent potential temperature (color, K) and 1000-200-hPa integrated water vapor transport (IVT, vector, kg m−1 s−1); and (c) 500-hPa horizontal winds (vector, m s−1), geopotential height (contour, interval: 10 gpm), and omega (color, unit: 0.01 Pa s−1) in mei-yu seasons.
Differences between the AYM and CM present a large area of negative geopotential height anomaly extending from southeastern China to the south of Japan. This pressure anomaly, which was caused by the weaker Pacific subtropical high in AYM, was associated with a cyclonic circulation in the wind anomaly. To the south of the pressure anomaly, a low-level southwesterly wind anomaly associated with a positive moisture anomaly extended from the SCS to Taiwan (Fig. 9a). Further upstream over the southern Indo-China Peninsula, moisture exhibited a negative anomaly because it had been transported to the downstream regions, such as the SCS and the Taiwan area. This is clearly shown in the IVT vector anomaly in Fig. 9b. As a result, the equivalent potential temperature also exhibited a large positive anomaly over the same areas. Consequently, the equivalent potential temperature gradient to the north of Taiwan became more significant, and the mei-yu frontal activity increased in the active years. The mid-level vertical velocity (omega) showed a negative anomaly (Fig. 9c), which corresponded to the frontal area over the northern SCS, the Taiwan area, and toward south of Japan.
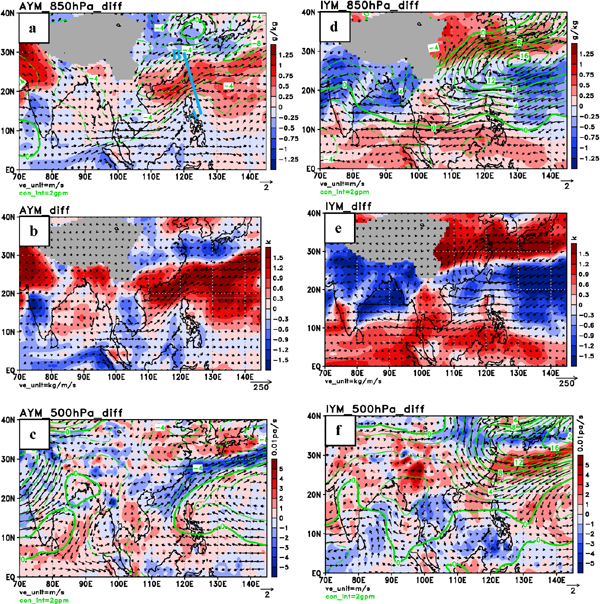
As for differences between the IYM and CM (Figs. 9d–f), they were nearly opposite to those between the AYM and CM (Figs. 9a–c). At 850 hPa, the IYM showed a large positive pressure anomaly over the northwestern Pacific due to the northwestward extension of stronger Pacific subtropical high. The pressure anomaly resulted in an easterly to northeasterly wind anomaly to the south of Taiwan and over the SCS (Fig. 9d). Without the southwesterly flow, moisture could not be transported northward. Instead, it accumulated over the southern SCS and the Indo-China Peninsula. Around the Taiwan area, there was a dry anomaly associated with a negative equivalent potential temperature anomaly (Fig. 9e). The equivalent potential temperature gradient became smaller during the inactive years such that the mei-yu frontal activity was significantly reduced. It is also evident that the IVT anomaly was directed westward from the relatively dry central Pacific to the SCS. All of these patterns were unfavorable to rainfall in Taiwan such that the 500-hPa omega exhibited a positive anomaly that was associated with a downward motion (Fig. 9f).
In order to understand the process of establishing a southwesterly flow environment in Taiwan, we examined the time evolution of the SWs events, R, and HPP in May and June for CM, AYM, and IYM using the 40-year data (Fig. 10). The black curves in Figs. 10a–c are the same as the black, red, and blue curves, respectively, in Fig. 3. During the first half of the mei-yu season (May 15–31), the occurrence percentage of the SWs events in AYM was not much different to that in CM (Fig. 10a). However, this percentage in AYM sharply increased from 5 % in late May to 30 % in mid-June. Although the occurrence percentage of the SWs events in CM also increased during the same period, it was only a small rise from about 4 % to 8 %. After June 15, the occurrence percentage of the SWs events in AYM sharply dropped to almost zero in late June. R and HPP (Figs. 10b, c) showed a similar pattern of difference between AYM and CM in the second half of the mei-yu season, but the slope of the curve was rather gentler than those of the occurrence percentage of the SWs events. From May 6 to 20, R and HPP of the AYM were relatively larger than those of CM, but starting in the first half of the mei-yu season, the difference between AYM and CM became smaller. The fact of the latter, that AYM was close to CM, implies that in the first half of the mei-yu season, an active year was nothing special in terms of the occurrence percentage of the SWs events, R, and HPP. Only until the second half of the mei-yu season did the conditions favor the formation of the SWs events and heavy rainfall appear for an active year. For inactive years (IYM), the occurrence percentage of the SWs events, R, and HPP were all very low during the mei-yu season, and they started to increase slightly only after June 16, later than in the active years (AYM). It is thus clear that during an inactive year, the atmosphere condition was unfavorable for the formation of the SWs events and rainfall.

Time evolution of (a) the SWs events (%), (b) R [mm (6 h)−1], and (c) HPP (%) in May and June for the CM (black), AYM (red), and IYM (blue) using the 40-year data from 1979 to 2018. An 11-d running mean is taken for all curves. The black curves in (a–c) are the same as the black, red, and blue curves, respectively, in Fig. 3a.
Hovmöller diagrams along a cross section AB (location shown in Fig. 9a) show a negative 850-hPa geopotential height gradient pointing from the south-southeast (A: 125°E, 15°N) to the north-northwest (B: 120°E, 30°N) in CM at 500–1700 km of the cross section in early May (Fig. 11a). The negative gradient started to increase further in magnitude around the Taiwan area (700–1200 km) after May 16. This means that the north-northwestward pressure gradient force became larger and the formation percentage of the SWs events would increase in this region after the onset of the mei-yu season (refer to Fig. 3). Starting from June 10, the area of large geopotential height gradient started to shift northward over time. The formation location of southwesterly flows also shifted northward such that the SWn/SWs events gradually increased/decreased (see Fig. 3). It is thus clear that the pressure gradient near the Taiwan area would determine the occurrence percentage of southwesterly flows. In AYM/IYM, the geopotential height gradient exhibited a negative/positive anomaly near the Taiwan area during the mei-yu season. The negative anomaly in AYM significantly increased after May 26, suggesting that the sharp increase of the SWs events in the second half of the mei-yu season in an active year was caused by the increased pressure gradient around the Taiwan area.

Hovmöller diagrams of the 850-hPa (a) geopotential height gradient [gpm (100 km)−1] and (b) equivalent potential temperature gradient [K (100 km)−1] along line AB (see Fig. 9a for the location). Top: CM, middle: difference between AYM and CM, and bottom: difference between IYM and CM. The ordinate is the distance (km) from A to B, and the abscissa is time from May 1 to July 1. An 11-d running mean is taken for both variables. The light blue line at the left denotes the range of Taiwan.
Figure 11b shows the same diagrams as Fig. 11a, except for the equivalent potential temperature gradient. A large negative of such gradient can be a good indicator of an active region of the mei-yu front. The climatological mean shows that the equivalent potential temperature gradient was large negative to the north of Taiwan (> 1200 km) and remained almost the same during the first half of the mei-yu season (Fig. 11b). The fact that the largest negative gradient was found near point B was due to the front frequently forming in the north and moving southward into the cross section from time to time. After June 1, the frontal active region started to shift northward over time. AYM shows two minima of negative anomaly to the north of Taiwan: one appeared early before the mei-yu season, and the other appeared in late May to early June. This finding means that the mei-yu front was more active in an active year of southwesterly flow events because the frequently formed front was associated with a low-pressure environment in the north, which produced a larger pressure gradient around the Taiwan area and favored the formation of the southwesterly flows.
In order to check whether there really were more fronts in an active year of the SWs events, we examined daily weather maps at 0000 UTC issued by Japan Meteorological Agency. When a front appeared in the box north of Taiwan (115–125°E, 25–28°N), that particular date was counted as a frontal date. For active years in 2001, 2005, 2006, 2012, and 2017, the frontal days were 12, 14, 12, 11, and 8, respectively, in 32 days of the mei-yu season (May 15 to June 15). On the other hand, for inactive years in 1980, 1987, 1989, 1991, and 1992, the frontal days were 7, 7, 4, 0, and 7, respectively. This finding was consistent with those discussed in the last paragraph, and it suggests that low pressure associated with the frequent frontal formation favors the formation of southwesterly flows.
Figure 12 shows the 5-d average of 1000–200 hPa IVT and 850-hPa geopotential height before (May 10–14) and during (May 15–19) the early mei-yu season. Around the onset time of the mei-yu season, the climatological mean shows two moisture transport paths around the Taiwan area (Figs. 12a, b). The first one extended from Indo-China, through southern China, north of Taiwan, and east-northeastward to the south of Japan. The second one originated from the south of the Pacific subtropical high, westward through the Philippines and the northern SCS, and northward to the Taiwan area. Another path of large IVT was far over the Bay of Bengal, which more or less connected to, and supplied moisture for, the first path in CM. In AYM, however, this third path of moisture transport became an important moisture supplier in the mei-yu season (Fig. 12d). Before the mei-yu season, the first path of moisture transport was weaker and the second path was stronger in AYM (Fig. 12c) than in CM. After the onset of the mei-yu season (Fig. 12d), the Pacific subtropical high weakened and the first path disappeared in AYM (compare Figs. 12c and 12d). The third path strengthened and extended to the SCS, where it combined with the second path and transported moisture northward to Taiwan. As a result of increased moisture in Taiwan, the equivalent potential temperature increased. Consequently, the equivalent potential temperature gradient increased to the north of Taiwan, which favored the mei-yu frontal activity. In turn, the pressure gradient around the Taiwan area increased with a greater chance for southwesterly flow formation, which would then further increase the moisture transport. In IYM, the Pacific subtropical high strengthened and the first and second paths both became stronger than in CM, but they circled around Taiwan such that not much moisture affected Taiwan before the mei-yu season (Fig. 12e). After the onset of the mei-yu season (Fig. 12f), there was still not much moisture near the Taiwan area and the IVT pattern was actually very similar to that of the climatological mean.

Five-day average (May 10–14) of 1000–200 hPa IVT (vector, kg m−1 s−1), IVT magnitude (color shading, kg m−1 s−1), and 850-hPa geopotential height (contour, gpm) for (a) CM, (c) AYM, and (e) IYM. (b, d, f) Same as (a, c, e) but for 5-d average from May 15 to 19.
To illustrate more clearly the aforementioned formation process of the SWs events in an active year, Figs. 13a, b present time evolution of several box-averaged variables in AYM from May 1 to July 1. The boxes are shown in Fig. 13c with corresponding colors. The red curve in Fig. 13b presents the same occurrence percentage of the SWs events as that in Fig. 10a for comparison purpose. Because the y-component gradients of the equivalent potential temperature and geopotential height are both negative, they are multiplied by minus one for easy comparison. We use the average 850-hPa geopotential height in a box to the east of Taiwan and the northern Philippines (brown box in Fig. 13c) as an index of the strength of the Pacific subtropical high. The brown curve in Fig. 13a shows that the Pacific subtropical high was weakening from early May to June 6 in AYM. Figure 12d already shows that northward moisture transport over the SCS and the Philippines was large. We therefore compute the averaged y-component of IVT in a box over these regions (black box in Fig. 13c) to examine the moisture transport. The y-component of IVT (black curve in Fig. 13a) started to increase after May 8 and peaked approximately on May 18, which corresponded to the process shown in Figs. 12c, d. As a result of such moisture transport, the equivalent potential temperature (purple curve) around the Taiwan area increased after May 21 and so did the minus y-component of the equivalent potential temperature gradient north of Taiwan (green curve in Fig. 13b). This environment favored the formation of mei-yu fronts and low pressure to the north of Taiwan such that the minus y-component of the pressure gradient (blue curve) around the Taiwan area increased with a greater chance for southwesterly flow formation (red curve). The southwesterly flow then resulted in a further increase of moisture transport (black curve in Fig. 13a) from June 1 to June 16. Lastly, two additional notes are needed for the minus y-component of the equivalent potential temperature gradient (green curve). First, the peak around May 15, which was also found in R/HPP (Figs. 10b, c), was mainly associated with the SWn events (green curve in Fig. 3a) that contributed to the large moisture transport around northern Taiwan in early May and was thus irrelevant to the current discussion. However, the moisture transport (black curve) and equivalent potential temperature increase (purple curve) before May 15 might have contributed to its formation to some extent. This peak and the second peak around May 28 corresponded to the two minima in AYM of Fig. 11b. Second, the drop of the minus y-component of the equivalent potential temperature gradient after June 1 was a result of the northward shift of frontal activity (see CM in Fig. 11b). The low-pressure environment was still present to the north of Taiwan.

Time evolution of (a) the 850-hPa geopotential height [Z (brown)], y-component of IVT (black), 850-hPa equivalent potential temperature θ e (purple)], and (b) minus y-component of the 850-hPa equivalent potential temperature gradient [−Δθ e/Δ y (green)], minus y-component of the 850-hPa geopotential height gradient [−Δ Z/Δ y (blue)], and occurrence percentage of the SWs events (red) in AYM from May 1 to July 1. All variables, except the last one, are averaged in the box shown in (c) with corresponding colors. The last one, the occurrence percentage of the SWs events, is the same as the red curve in Fig. 10a. The ordinate is shown in normalization by mean (µ) and standard deviation (σ) of each curve, with the mean and standard deviation presented in Table 3. An 11-d running mean is taken for all curves.

From the above discussion, it is clear that in active years, northward moisture transport over the SCS and the Philippines around the onset time of the mei-yu season was very important in determining the formation of southwesterly flows and rainfall in Taiwan. We therefore further examined the correlation coefficient between IVT in the early mei-yu season and the average R for the entire mei-yu seasons over 40 years. A 5-d running mean of the y-component of IVT at each grid point was first calculated for a chosen 5-d period (e.g., May 12–16) before and during the early mei-yu season from May 7 to 22 for each year. The correlation coefficient at each grid point was then calculated between the 5-d mean IVT and the seasonally averaged R for the 40 mei-yu seasons. The spatial distribution of the correlation coefficients is presented in Fig. 14a for the 5-d period of May 12–16 as an example. It is clear that over the eastern part of the SCS and the Philippines, the correlation coefficients were all high (> 0.5) and exceeded the 99 % confidence level, suggesting that we could use the y-component of IVT over these regions in the early mei-yu season (e.g., May 12–16) to predict rainfall in Taiwan for the entire mei-yu season.
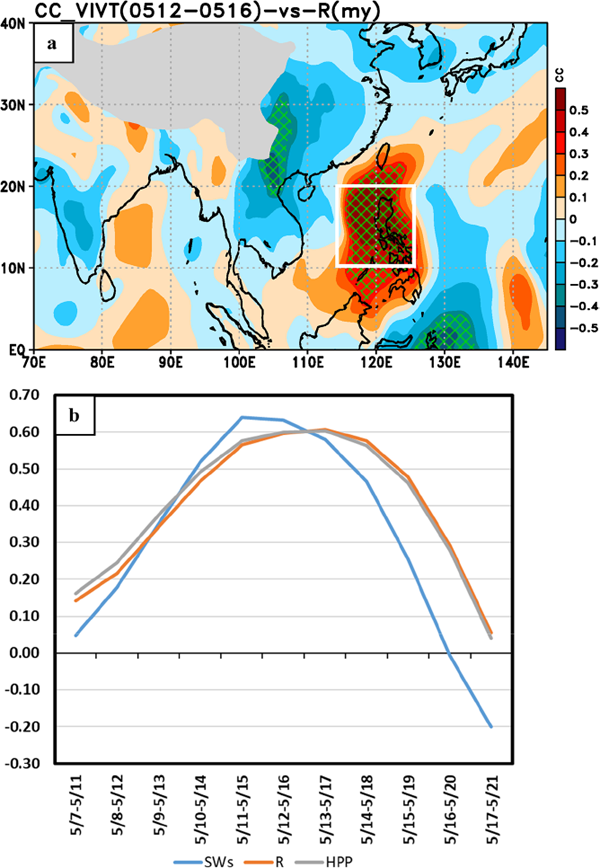
(a) The correlation coefficient between the 5-d mean y-component of IVT from May 12 to 16 and the seasonally averaged R for the 40 mei-yu seasons. Green meshes denote the areas that pass the 95 % confidence level of the t-test. (b) The correlation coefficient between the 5-d running mean y-component of IVT averaged in a box over the SCS and the Philippines (location shown in a) and the seasonally averaged occurrence percentage of the SWs events (blue)/R (orange)/HPP (gray) for the 40 mei-yu seasons. The abscissa is 11 5-d periods, including May 7–11, May 8–12, …, May 17–21. The ordinate is the correlation coefficient.
Because the correlation coefficients over the SCS and the Philippines were relatively high, we further took an average of the y-component of IVT first in a box over these regions (location shown in Fig. 14a, which is the same as the black box in Fig. 13c) for a chosen 5-d period before and during the early mei-yu season for each year. The correlation coefficient was then calculated between the 5-d areal mean IVT and the seasonally averaged occurrence percentage of the SWs events/R/HPP for the 40 mei-yu seasons. The correlation coefficients are presented in Fig. 14b for 11 5-d periods, including May 7–11, May 8–12, …, May 17–21. The y-component of IVT was highly correlated with the occurrence percentage of the SWs events, R, and HPP. For the three periods May 11–15, May 12–16, and May 13–17, the correlation coefficients were all higher than 0.57. Even for the period before the mei-yu season, May 10–14, the correlation coefficients were still higher than 0.49, which exceeded the 99 % confidence level of the t-test. This finding suggests that we could use this IVT variable in early mei-yu season as an index to predict the occurrence percentage of the SWs events, rain, and heavy precipitation in Taiwan for the entire mei-yu season.
This paper presents a climatological study on southwesterly flows and heavy rainfall around the Taiwan area during the mei-yu seasons from 1979 to 2018. The relationship between southwesterly flows and rainfall in Taiwan was investigated using ERA-interim reanalysis data from the ECMWF and rainfall data from the 28 CWB weather stations. Constituting a continuous study of Chien and Chiu (2019), this paper divided the southwesterly flow events into two groups according to the axis location of southwesterly flows. The event was defined as an SWn/SWs event if the axis was located over northern/southern Taiwan. It was found that the occurrence percentage of the SWs events was highly correlated with 6-h accumulated rainfall and heavy precipitation, and the rainfall of the SWs events was significantly larger than that of the SWn events. It is clear that during the warm season, the SWs events were the major periods of rain and heavy precipitation in Taiwan. Correlation coefficient analyses show that stronger southwesterly winds at low levels (e.g., 850 hPa) over the SCS would increase the occurrence percentage of the SWs events in Taiwan. These airflows were associated with plenty of moisture in the low level and upward motion in the middle level, indicating that rainfall and heavy precipitation would very likely happen in Taiwan. Low pressure to the north of Taiwan and high pressure to the south exerted a large northward pressure gradient force across the Taiwan area, favoring the formation of southwesterly flows in southern Taiwan. The low-pressure region also corresponded to the area of mei-yu frontal activity. When a mei-yu front was located north of the Taiwan area, there was more chance of the SWs events.
During the first half of the mei-yu season (May 15–31), the occurrence percentage of the SWs events in active years (AYM) was not much different to that in the climatological mean. This percentage, however, sharply increased in the second half of the mei-yu season (June 1–15), suggesting that only until the second half of the mei-yu season did the atmospheric conditions favor the formation of the SWs events and heavy rainfall appear for an active year. The sharp increase of the SWs events was caused by the increased pressure gradient around the Taiwan area in the second half of the mei-yu season. This is due to the fact that the Pacific subtropical high weakened and the mei-yu fronts were more active in an active year and the frequently formed front was associated with a low-pressure environment in the north, producing a larger pressure gradient around the Taiwan area and favoring the formation of southwesterly flows. More specifically, Fig. 15 presents a schematic diagram to summarize the formation process of southwesterly flows in the environment surrounding the Taiwan area. It all started with the weakening of the Pacific subtropical high in the early mei-yu season. Moisture was then transported along two major paths south of the Taiwan area. The first one extended from the Bay of Bengal, Indo-China, the SCS, and to the Taiwan area. The second one originated from the south of the Pacific subtropical high, westward through the Philippines and the northern SCS, and northward to the Taiwan area. The airflows converged over the SCS and moved northward to southern Taiwan. As a result of the moisture transport, the equivalent potential temperature increased in the Taiwan area. Consequently, the equivalent potential temperature gradient increased to the north of Taiwan, which favored mei-yu frontal activity, creating a cyclonic circulation and low-pressure anomaly. The pressure gradient around the Taiwan area thus increased, which supported the formation of southwesterly flows. The southwesterly flows then helped in transporting more moisture toward the Taiwan area, resulting in heavy rainfall and increased equivalent potential temperature in Taiwan. This kind of positive feedback can produce more fronts, stronger southwesterly flows, and heavier rainfall in the mei-yu season. On the basis of the moisture flux study, we suggest that the meridional component of IVT over the eastern part of the SCS and the Philippines in the early mei-yu season (e.g., May 12–17) can be used to predict the occurrence percentage of the SWs events and heavy rainfall for the entire mei-yu season.

A schematic diagram showing the formation of southwesterly flows and rainfall in the environment surrounding the Taiwan area during active years of the SWs events.
The data used in this study are obtained from the European Centre for Medium-Range Weather Forecasts (ECMWF) and the Central Weather Bureau of Taiwan (CWB). This research was supported by the Ministry of Science and Technology of Taiwan (Grants: MOST 108-2111-M-003-004 and MOST 109-2111-M-003-003).