Article
Trajectory Analyses on the Warm Core Development and Pressure Falls of a Developing Typhoon as Simulated by a Cloud-Resolving Model
2021 Volume 99 Issue 5 Pages 1329-1350

Details
2021 Volume 99 Issue 5 Pages 1329-1350
The central pressure fall in a typhoon is associated with the development of the warm core and mass divergence in the eye. Trajectory analyses were utilized to investigate the origins of air moving into the warm core and the paths of air parcels leaving the eye. First, developing Typhoon Wipha (2007) was simulated using a high-resolution (2 km) cloud-resolving model to represent the central pressure fall and axisymmetric structures such as the warm core in the upper levels of the eye, the eyewall, and the secondary circulation. Then, using the model output data, backward trajectories were calculated from the eye; the results show that the air parcels comprising the warm core originated from the lower troposphere and the lower stratosphere. Those originating from the lower troposphere, whose equivalent potential temperature (θe) is increased by the latent heat flux from the sea, ascend through the eyewall and move inward in the upper troposphere. Those originating in the lower stratosphere, which have high potential temperature (θ), descend from the lower stratosphere to the upper troposphere. Hence, the warm core comprises high-θe air from the lower troposphere and high-θ air from the lower stratosphere. Next, forward trajectories were calculated to examine the paths of air parcels leaving the eye; the results show that air parcels leave the eye through the eyewall throughout the troposphere, particularly at heights below 2 km and between 9 km and 12 km, which ultimately results in a central pressure fall.
The warm core is one of the most important structures of tropical cyclones (TCs) such as hurricanes and typhoons. Because the temperature in the eye and the pressure field are in approximate hydrostatic balance, the warm core is related to the central pressure. Thus, information regarding how the warm core develops is important for understanding the central pressure fall in TCs.
Early flight-level measurements (e.g., La Seur and Hawkins 1963; Hawkins and Rubsam 1968; Hawkins and Imbembo 1976) revealed the presence of warm temperature deviations within hurricanes and showed that the greatest temperature deviations are found in the upper troposphere. By contrast, a composite analysis of flight-level data in hurricanes performed by Shea and Gray (1973) showed that the temperature within a hurricane is the warmest inside the radius of maximum wind and that the greatest temperature deviation occurs at 525 hPa. More recently, the structure of the warm core has been studied by dropsonde observations (e.g., Halverson et al. 2006; Stern and Zhang 2016; Komaromi and Doyle 2017) and retrieval by the Advanced Microwave Sounding Unit (AMSU) (e.g., Knaff et al. 2000, 2004). The structure of the warm core has also been simulated using numerical models (e.g., Yamasaki 1968; Kurihara and Tuleya 1974; Liu et al. 1997; Wang and Wang 2014). Although a maximum of a warm core has been found at various altitudes in the middle and upper troposphere, it is unclear whether its height is related to the storm intensity (Stern and Nolan 2012).
Because the eye of intense TCs is often cloud-free except for a low-level stratocumulus (e.g., Simpson 1952; La Seur and Hawkins 1963), it has been thought that the subsidence of air in the eye leads to the development of the warm core. Theoretical studies based on Eliassen's (1951) diagnostic equation for a meridional circulation (e.g., Willoughby 1979; Shapiro and Willoughby 1982; Pendergrass and Willoughby 2009) suggested that the subsidence in the eye is forced by a heat source in the eyewall that induces warming. Indeed, a weak subsidence in the eye has been found by both observational (e.g., Gray and Shea 1973; Jorgensen 1984; Marks et al. 1992) and numerical studies (e.g., Rosenthal 1971; Kurihara and Bender 1982; Liu et al. 1997). The numerical simulations have shown that the subsidence produces weak adiabatic warming in the eye (e.g., Zhang et al. 2002). On the basis of soundings in the eye, Willoughby (1998) suggested that the subsidence in the eye is a response to a loss of air mass from the eye (e.g., air is drawn into the eyewall convection from the bottom of the eye). Zhang and Kieu (2006) showed that subsidence in the eye is induced by a mass inflow from the upper-level eyewall and is maintained by a downward dynamically induced perturbation pressure-gradient force (see also Zhang et al. 2000). Stern and Zhang (2013a, b) investigated the mechanisms of warming in the eye by budget and trajectory analyses of an idealized TC. They showed that the warming and perturbation temperature are the largest at the mid-level in the eye and that the presence of weak to moderate vertical wind shear does not systematically alter the height of the maximum warm core. Recent studies have suggested that the upper-level warm core is formed by the downward flow from the lower stratosphere (Chen and Zhang 2013; Ohno and Satoh 2015). Because the warm core is formed primarily because of adiabatic warming (i.e., downward advection of high potential temperature) caused by subsidence in the eye, the development (i.e., the change of the intensity and height) of the warm core may be determined by the origin and the path taken by the air of the eye.
The development of the warm core is related to a central sea-level pressure fall in accordance with the hydrostatic balance. To maintain the balance between the temperature of the air column in the eye and the central sea-level pressure, the mass divergence of the air column in the eye must occur as TCs deepen. Willoughby (1998) showed that the warm and dry air aloft in the eye of the TC is separated from the cloudy air below by an inversion, suggesting that the mass transport from the eye below this inversion results in subsidence in the eye. Furthermore, Cram et al. (2007) performed trajectory analyses of Hurricane Bonnie (1998) using the simulation of Braun et al. (2006) and showed that air in the low-level eye flows into the eyewall, which is superficially consistent with the superintensity mechanism by which high-entropy air within the low-level eye provides an additional energy source for TC intensification (e.g., Persing and Montgomery 2003; Montgomery et al. 2006). However, subsequent studies (e.g., Bryan and Rotunno 2009; Wang and Xu 2010) have shown that the entropy flux from the low-level eye into the eyewall contributes little to TC intensification. Cram et al. (2007) also found that air from the eye can mix with that in the eyewall in the middle to upper troposphere, which is more consistent with the weakening cases described by Willoughby (1998). Stern and Zhang (2013b) suggested that stirring of air from the eye into the eyewall strongly decreases with increasing storm intensity. Most previous studies have focused not on the removal of air from the eye but on the interactions between the eye and the eyewall. For understanding the mass divergence in the eye, it is necessary to investigate the flow field in the inner core region and the transport of air from the eye to the region outside of the eyewall.
Here, we investigate the mechanisms of warm core development and central pressure fall. In particular, we focus on the wind fields within the eye and the eyewall by tracing the air parcels moving into and out of the eye and the eyewall. First, we performed a numerical simulation of Typhoon Wipha (2007), whose central pressure decreased by 40 hPa in 24 h, by using a high-resolution cloud-resolving model. Then, we performed trajectory analyses to examine (i) the origins and paths of the air comprising the warm core and (ii) the paths followed by air leaving the eye throughout the troposphere.
For the present simulation, we used the Cloud Resolving Storm Simulator (CReSS) (Tsuboki and Sakakibara 2002) developed at the Institute for Space-Earth Environmental Research (ISEE) of Nagoya University in Japan. CReSS is a cloud-resolving regional model using non-hydrostatic and compressible equations in a terrain-following coordinate system. Cloud microphysical processes are formulated by a bulk cold rain parameterization (Murakami 1990). Prognostic variables of water substances are mixing ratios of cloud water (qc), rain (qr), cloud ice (qi), snow (qs), and graupel (qg). No cumulus parameterization is included. Subgrid-scale turbulent mixing is parameterized by a 1.5-order turbulent kinetic energy closure scheme (Deardorff 1980). A fourth-order finite difference approximation is used for advection terms. Although radiation processes of clouds and the atmosphere are not considered, short- and long-wave radiation processes at the land surface are considered. The CReSS model has been used to study several TCs (e.g., Nomura and Tsuboki 2012; Akter and Tsuboki 2012; Wang et al. 2012).
The horizontal resolution of the simulation is 2 km. The physical domain covers an area of 1600 km × 1320 km with 803 × 663 grid points in the staggered grids of the Arakawa-C type on the Mercator projection (Fig. 1). The number of vertical grids is 83 in the staggered grids of the Lorenz type, and vertical grid intervals vary from 100 m at the lowest level (50-m height) to about 350 m at the top of the model (28-km height). The initial and boundary conditions are obtained from the regional objective analysis (RANAL) data provided by the Japan Meteorological Agency (JMA), whose horizontal resolution is 20 km. Sea surface temperature (SST) is obtained from the merged satellite and in situ data global daily SST (MGDSST) dataset for 17 September 2007, which is also provided by JMA. Throughout the simulation, SST is kept constant with time (Fig. 1). The CReSS simulation was performed for 24 h from 0000 UTC 17 September to 0000 UTC 18 September 2007 with an output frequency of 5 min.

Horizontal distribution of SST (contours, °C) and topography (shading, m) in the model domain. The solid line indicates the track of the simulated typhoon. The dashed line indicates the observed track of Typhoon Wipha (2007) during the simulation period, and the dotted lines show the observed track before and after the simulation period. The white square indicates the point where genesis occurred at 0000 UTC 16 September 2007. The white and black circles indicate the positions at 0000 UTC and 1200 UTC, respectively.
According to the best track data obtained from the Regional Specialized Meteorological Center (RSMC) Tokyo - Typhoon Center, genesis of Wipha occurred at 0000 UTC 16 September at 20.1°N. The typhoon is interesting as the storm showed a rapid intensification immediately after the genesis. We used the RANAL data from several different times for the initial condition and found that the simulation starting from 0000 UTC 17 September agreed best with the development of the observed storm. All simulations initialized on 16 September were less successful, perhaps because the storm was located too close to the southern boundary of the RANAL data. Because the observed storm reached the lifetime maximum intensity at 1800 UTC 17 September, the simulation was performed for 24 h after 0000 UTC 17 September. Because the simulation is a cold-start type, the earlier part of the simulation was considered as a spin-up period and was not used for the analysis. In the present paper, all analyses were performed after 9 h from the initial time.
2.2 Trajectory analysisBecause previous studies suggested that the warm core is formed by adiabatic warming, the local tendency of potential temperature (θ) in the warm core may develop as a result of downward advection of θ. However, an Eulerian budget analysis can reveal the existence of downward advection of θ into the warm core but not the origin or trajectory of the advecting air. To reveal the origin and trajectory of the air, it is necessary to trace the advection of the air comprising the warm core using a backward trajectory analysis. To elucidate the warming process of the air in a Lagrangian form, we traced the air entering the warm core and examined the evolution of potential temperature.
The following forward trajectory analysis (Golding 1984) is used:
 |
 |
 |
 |
The parcel used in the trajectory analysis is considered as an idealized point. The potential temperature in a dry process and the equivalent potential temperature in a moist process are conserved approximately. Conversely, they may be changed if mixing processes are significant.
In this section, the characteristics of the simulated typhoon are summarized. Figure 1 shows the track of the simulated typhoon and the RSMC best-track data. During the simulation period, both the simulated and the observed typhoon move west-northwestward with almost the same average speed (approximately 20 km h−1). The model typhoon is located very close to the observed one with a maximum position error of 32 km. Figure 2a shows temporal changes in central pressure for the simulated typhoon and, the RSMC and Joint Typhoon Warning Center (JTWC) best-track data. The frequencies of the RSMC and JTWC best-track data are 3 h and 6 h during the period, respectively. The RSMC estimated central pressure of the observed typhoon is 965 hPa at 0000 UTC 17 September 2007 (initial time) and 925 hPa at 0000 UTC 18 September, decreasing by 40 hPa in 18 h. The JTWC one is 967 hPa at 0000 UTC 17 September and 922 hPa at 0000 UTC 18 September, decreasing by 45 hPa in 24 h. The estimated central pressure values from the two best tracks are almost the same. The central pressure of the simulated typhoon is approximately 978 hPa at the initial time because of the coarse resolution of the RANAL data. It changes to 943 hPa at 18 h (a decrease of 35 hPa) and 938 hPa at 24 h (a decrease of 40 hPa). Although the model typhoon is weaker than the observed one, the simulation represents well the rapid pressure fall (i.e., the development) of Typhoon Wipha. We consider the simulation to be adequate for the purpose of this study, which is not to examine the intensity of the typhoon but to understand the mechanism of the central pressure fall in the typhoon. Figure 2b shows temporal changes in the maximum surface wind speed for the simulated typhoon and best-track data. The RSMC estimated maximum surface wind of the observed typhoon is 70 kt at 0000 UTC 17 September 2007 and 100 kt at 0000 UTC 18 September, increasing by 30 kt in 18 h. The JTWC one is 75 kt at 0000 UTC 17 September and 135 kt at 0000 UTC 18 September, increasing by 60 kt in 24 h. The JTWC estimated maximum wind speed is greater than that of RSMC. Part of the difference is caused by the difference in the wind averaging periods: 10 min for the RSMC and 1 min for the JTWC. However, because the 10-min average wind speed converted from the JTWC estimated wind speed by being multiplied by 0.88 is still larger, the wind speed estimates may have some uncertainty. According to the both estimated maximum surface wind speeds, rapid intensification occurs during this period. The maximum surface wind of the simulated typhoon is about 60 kt at the initial time and catches the RSMC wind speed at about 4 h. Then, it increases at approximately the same rate as that of the observed typhoon with small time-scale fluctuations. Hence, the simulation represents well the intensification of Typhoon Wipha.

Temporal changes in (a) central sea-level pressure (hPa) and (b) maximum surface wind speed (kt) of Typhoon Wipha in the simulation (solid line), the RSMC best-track data (dashed line), the JTWC best-track data (dash-dotted line) and the RANAL data (dotted line). The dashed double-dotted line in (b) shows the JTWC maximum surface wind speed converted from the 1-min average to the 10-min average by being multiplied by 0.88.
Although the duration of the simulation (24 h) was not sufficiently long and a cold start was used, the maximum surface wind speed of the simulation matched that of the best track and the intensification was simulated well (Fig. 2b). Because the numerical model was a cloud-resolving type and the horizontal resolution was as high as 2 km, convective clouds rapidly developed just after the simulation started, and the adjustment between cloud process and dynamic process occurred in a sufficiently short period. Therefore, the result after 9 h from the initial time is useful to study the development process of the warm core. However, potential caveats of the short simulation need to be pointed out. The short simulation period could have a discrepancy in the storm structure, particularly, the structure of the warm core because a typhoon simulation occasionally depends on the initial condition and the spin-up period.
Figure 3 shows the precipitation intensity of the developing typhoon at 1700 UTC 17 September 2007 (just before reaching the maximum intensity), as obtained from the JMA radar data and the simulated precipitation intensity. Although both the observed and simulated typhoons have a precipitation-free eye, an eyewall, and spiral rainbands outside the eyewall, the simulated eye is much larger than the observed eye. Likely because of the coarse and inaccurate initial conditions, the current simulation is unable to represent the inner-core size correctly. Because the observed Typhoon Wipha appears to have a double eyewall-like structure with small inner eyewall, the structure of the warm core of the real storm is expected to be complicated. In situ observation using aircraft is necessary to study the thermodynamic and dynamic structure of the warm core. However, because we do not have such observation at present, understanding the structure of such an eye remains for future work. The simulated typhoon showed a different size of eyewall, suggesting that the warm core structure could be different from the observed one and that the result may not simulate the real Typhoon Wipha perfectly. However, similar to the observed storm the simulated storm showed rapidly deepening central pressure to the north of 20°N. Thus, we consider that the simulated typhoon is representing a storm similar to Typhoon Wipha that showed rapidly deepening central pressure at a relatively high latitude. The following analyses will elucidate the mechanism of warm core development and pressure fall process of such a rapidly intensifying typhoon. Although there is a discrepancy in the size of the eye, the simulated typhoon data are still useful for the study of warm core development.

Horizontal distribution of precipitation intensity (mm h−1) at 2-km height (a) from JMA radar at 1700 UTC 17 September 2007, and (b) from the simulation at 17 h. The yellow square in (a) indicates the radar location on Ishigaki Island.
Figure 4 shows the azimuthally and temporally averaged structure of the simulated typhoon between 17 h and 18 h. A cyclonically tangential wind is simulated below 18 km with a peak value (> 60 m s−1) at about 70-km radius at about 700-m height (Fig. 4a). The simulated typhoon also represents well the secondary circulation, which comprises an intense inflow outside the 40-km radius below 1 km, an intense slantwise updraft at radii between 50 km and 120 km, and an outflow outside the 90-km radius at heights between 12 km and 16 km (Figs. 4b, c). Intense precipitation is simulated in the region of the intense updraft, which corresponds to the eyewall (Fig. 4d). Strong convergence occurs in the lower part of the eyewall (Fig. 4b). A precipitation-free eye is simulated inside the eyewall (Fig. 4d). A weak downward motion is simulated near the center of the eye (Fig. 4c) that is the strongest at heights between 10 km and 14 km, which corresponds to the forced dry descent of Willoughby (1998). A strong downward motion at the inner edge of the eyewall between 10-km and 15-km heights is the compensating subsidence of the eyewall convection, which is enhanced by evaporative cooling and corresponds to the saturated descent of Willoughby (1998). Three weak radial flows are simulated between the eye and the eyewall (Fig. 4b): an inward radial velocity from the eyewall within the 70-km radius at heights between 12 km and 18 km, an outward radial velocity from the eye to the eyewall below 2 km, and an outward radial velocity from the eye at heights between 8 km and 12 km. The weak precipitation simulated outside the eyewall corresponds to the asymmetric rainbands of the typhoon (Figs. 4d, 3). Together, these results show that the simulation represents well the characteristic precipitation pattern, primary and secondary circulation, and downward motion in the eye of a TC reported by both observational (e.g., Jorgensen 1984; Marks and Houze 1987) and numerical (e.g., Liu et al. 1999) studies.

Radius–height cross-sections of variables averaged azimuthally and temporally from 17 h to 18 h: (a) tangential velocity component (vθ; m s−1), (b) radial velocity component (vr; m s−1), (c) vertical velocity component (w; m s−1), and (d) mixing ratio of precipitation (g kg−1; qr, qs, and qg are the mixing ratios of rain, snow, and graupel, respectively). Gray shading in (b) indicates regions of radial inflow. Additional contours of ±1 m s−1 are superimposed on (b) to elucidate the weak radial flows between the eye and the eyewall. The gray dashed line shows the tropopause, which is defined as the zero line in the vertical temperature gradient.
Figure 5 shows the azimuthally averaged potential temperature deviation (θ′), defined as the deviation from the potential temperature averaged over a horizontal area within the 500-km radius at each level at each time. The θ′ increases sharply as the radius decreases, indicating the presence of a warm core (in terms of θ) in the simulated typhoon. A maximum θ′ of about 10 K is located between 7-km and 8-km heights at 9 h (Fig. 5a), which pre-exists in the initial condition data. Between 14-km and 16-km heights (approximately 150–110 hPa), θ′ significantly increases during the 15-h period from 9 h to 24 h (Figs. 5a, b), reaching a maximum of 14–17 K. An upper-level warm core has also been simulated by recent studies (e.g., Chen and Zhang 2013; Wang and Wang 2014; Ohno and Satoh 2015).

Radius–height cross-sections of the azimuthally averaged potential temperature deviation (K) at (a) 9 h and (b) 24 h. The gray dashed line shows the tropopause.
The significant increase of θ′ of air in the upper-level eye may play an important role in the deepening of the simulated typhoon. Figure 6a shows a thickness deviation Δz′ = −(Cp/g) ∫θ′dΠ calculated using a vertical profile averaged over a horizontal area within the 50-km radius, where Π = (p/p0)(Rd/Cp) is the Exner function and p0 = 1000 hPa is the reference pressure. In response to the increase in θ′, the thickness deviation between 200 hPa and 100 hPa is also large. In addition, we calculated a vertical difference of an Exner function ΔΠ = −(g/Cp) ∫ (1/θ) dz every 500 m from the surface up to 20 km. The radially averaged sea-level pressure changed from 958 hPa at 9 h to 941 hPa at 24 h (a decrease of 17 hPa). Meanwhile, the hydrostatic sea-level pressure estimated by a vertical integration of ΔΠ throughout all layers changed from 965 hPa at 9 h to 951 hPa at 24 h (a decrease of 14 hPa). Although the hydrostatic pressure is higher than the simulated pressure, it represents the pressure fall of the simulated typhoon. To elucidate the contribution of θ increase of each layer to the surface pressure fall, Fig. 6b shows the time difference of ΔΠ between 9 h and 24 h. Because Π at the 20-km height increases hardly from 9 h to 24 h (about 0.25 × 10⁻⁴), the hydrostatic pressure decreases because of the change of the vertical integration of ΔΠ between the surface and 20 km. The ΔΠ between 13 km and 17.5 km increases significantly because of the significant increase of θ of air in the upper eye, which is similar to the thickness deviation in Fig. 6a. Because Fig. 6b indicates the positive values below 13-km height, there is a considerable contribution of the warming in the middle and lower troposphere to the surface pressure fall. ΔΠ increase implies a decrease of the central sea-level pressure in accordance with the hydrostatic relation. In the following section, we focus on the maximum warming in the typhoon eye.

Vertical profiles of (a) the thickness deviation (m) every 25 hPa from 925 hPa to 50 hPa at 24 h and (b) the difference between 9 h and 24 h of ΔΠ (× 10−4) every 500 m from the surface to 20 km. The profiles are averaged over a horizontal area within the 50-km radius from the typhoon center.
As shown in Section 3, the simulated typhoon has a warm core with the maximum θ′ at about 15-km height at t = 24 h. To determine the origin of the air comprising the warm core, we performed a backward trajectory analysis with starting points located at 2-km intervals horizontally and at heights of 14, 15, and 16 km in the 60 km × 60 km region near the center of the typhoon. A total of 2883 trajectories [961 trajectories at each level (31 × 31 points)] were calculated for 15 h from the starting time at t = 24 h to the ending time at t = 9 h (Table 1). Ztropo in Table 1 indicates the height of the tropopause, which is defined as the level where the vertical temperature gradient is zero along the trajectory of each parcel.

Representative backward trajectories (Fig. 7) show that the air parcels follow two major paths toward the warm core: one is from outside the 100-km radius and below 2 km and ascends through the eyewall [red trajectories in Fig. 7; (1) in Table 1], and the other is from outside the 150-km radius and above 16 km in the lower stratosphere and descends in the eye [blue trajectories in Fig. 7; (2) in Table 1]. The blue trajectories are similar to the upper-level inflow reported by Chen and Zhang (2013). The descending motion from the stratosphere is supported from tracer observational studies (Östlund 1968; Stout and Rodgers 1992). Of all the trajectories, 28 % follow the red path and 24 % the blue path, demonstrating that the contribution of parcels from the lower stratosphere to the development of the warm core maximum is comparable with that of parcels from the lower troposphere. In addition, 4 % of the parcels come from within the 50-km radius below 2 km in the low-level eye [green trajectories in Fig. 7; (3) in Table 1]. Their contribution to the development of the warm core is much smaller than that of red parcels from outside the eyewall. This finding is consistent with those of Bryan and Rotunno (2009) and Wang and Xu (2010), who found that the contribution of high-entropy air near the surface in the eye to the maximum intensity is very small because of the relatively small volume of the eye. Another 5 % of the parcels come from a radius between 50 km and 100 km below 2 km in the low-level eyewall [orange trajectories in Fig. 7; (4) in Table 1]. They appear to come from the region outside of the eyewall as the red parcels before 9 h, and some of them stagnate in the eye region before ascending in the eyewall.

Representative backward trajectories of air parcels in the warm core in radius–height cross-section. The trajectories shown in the figure are approximately 3 % of the total calculated trajectories. The number of trajectories in each category is not proportional to their actual relative frequencies. Squares indicate the starting points for the trajectories and triangles indicate the end points. The trajectories are colored according to their paths and end points (see Section 4.1). Gray shading shows the azimuthally averaged potential temperature deviation (K) at 24 h. The black dashed line shows the tropopause.
In total, 37 % of the parcels (the red, green, and orange trajectories) move from the lower troposphere, in particular from the boundary layer, into the upper troposphere. Another 1 % of the parcels in the eyewall come from outside the eyewall in the middle to upper troposphere [light-blue trajectories in Fig. 7; (5) in Table 1], and they appear to have little effect on the development of the warm core. Another 8 % of the parcels come from inside the eye in the mid-troposphere [purple trajectories in Fig. 7; (6) in Table 1], mostly at heights between 8 km and 12 km. Among all parcels, only 9 % originate from the middle to upper troposphere (light-blue and purple trajectories), which is a much smaller proportion compared with parcels coming from the lower troposphere or lower stratosphere. In addition, 21 % of the parcels are ascending in the eyewall [brown trajectories in Fig. 7; (7) in Table 1], and 8 % are flowing in the lower stratosphere near the center of the typhoon [yellow trajectories in Fig. 7; (8) in Table 1]. Another 1 % originate from the warm core itself and return to the warm core [pink trajectories in Fig. 7; (9) in Table 1].
To elucidate the contributions of adiabatic and diabatic effects to the development of the warm core, we examined the potential temperature θ and the equivalent potential temperature θe of the parcels. Figure 8 shows the changes in θ and θe with time for a parcel following a red trajectory in Fig. 7. The value of θe increases between 15.5 h and 17.5 h as the parcel moves inward between radii of 150 km and 50 km near the sea surface; however, θ is approximately conserved during this time interval. The parcel thus mixes with air acquiring water vapor via the latent heat flux from the sea surface because of increases in the tangential wind toward the eyewall. Between 17.5 h and 19.5 h, as the parcel ascends in the eyewall cloud between radii of 50 km and 100 km, θ increases greatly by almost 70 K. The increase in θ is due mainly to the heating by condensation of water vapor to cloud water. The contribution of the heating by freezing or deposition is smaller than the condensation heating. At this time, θe is nearly conserved, that is, the parcel ascends moist adiabatically in the eyewall. At about 19.5 h, as the parcel reached about 16-km height near the tropopause, θ approaches θe . The θ increases (∼ 5 K) when the parcel reached the tropopause between 19.5 h and 20 h. Because the changes in θ and θe are the same near the tropopause and the radiation processes of clouds and the atmosphere are not considered in this study, the parcel must mix with higher-θ air around the tropopause for its θ to increase. After 20 h, the parcel moves inward and downward with approximately constant θ, indicating that the parcel is warmed adiabatically as it moves downward. The downward motion may correspond to the forced dry descent. The inward motion of the parcel is consistent with the upper-level inflow from the eyewall (Fig. 4b). This result suggests that one of the heat sources of the warm core is high-θe parcels originating within the low-level inflow.

(a) A representative backward trajectory of an air parcel in the warm core traced back to the lower troposphere (following a red trajectory in Fig. 7). (b) Potential temperature (solid line, K) and equivalent potential temperature (dashed line, K) corresponding to this parcel.
Figure 9 shows the changes in θ with time for a parcel following a blue trajectory in Fig. 7. Many blue trajectory parcels move inward in the stratosphere without crossing the tropopause until they reach the inner region. Because the changes in θ for such trajectories are qualitatively similar, the trajectory in Fig. 9 was chosen from them. The θe equals θ during the period shown in Fig. 9. The θ of the parcel slightly increases by about 8 K until 19 h, and then, it rapidly decreases by about 20 K between 20.5 h and 21 h. This decrease in θ is likely a result of mixing with lower-θ air in the upper troposphere once the parcel crosses the tropopause. After 21 h, θ is again conserved, indicating that the parcel is warmed adiabatically as it descends. This result suggests that high-θ air coming from the lower stratosphere also contributes to the development of the warm core.

The backward trajectory analysis reveals that air from the lower troposphere moves into the warm core. However, most of the air ascending through the eyewall moves outward in the upper-level outflow layer (Fig. 4b). Therefore, it is unclear how much air from the lower troposphere actually enters the warm core. To estimate the proportion of parcels that move into the warm core from the lower troposphere, we performed a forward trajectory analysis. The starting points are located at 10-km intervals in both the x and y directions between radii of 150 km and 300 km at four different heights of 100, 200, 300, and 400 m. A total of 15,120 forward trajectories (3780 trajectories at each level) were calculated for 15 h from t = 9 h (Table 2). The results show that more than 50 % of the parcels are carried aloft by convective clouds before they reach the eyewall; therefore, in the following analyses, we focus only on parcels that reach the upper troposphere by ascending in the eyewall [(1) and (2) in Table 2].

Figure 10 shows the representative forward trajectories of the parcels that ascend in the eyewall and reach the upper troposphere. Most of these parcels flow outward in the upper troposphere at 24 h, and are beyond the 150-km radius and above 12 km [blue trajectories in Fig. 10; (1) in Table 2]. Only a few parcels move into the warm core within the 50-km radius between 13-km and 17-km heights [red trajectories in Fig. 10; (2) in Table 2]. Because the blue trajectory parcels tend to accelerate outward above 12 km, they have a large outward radial velocity at heights between 13 km and 16 km. By contrast, once the red trajectory parcels have ascended close to the tropopause, they descend to the altitude of the warm core. Of all the trajectories, 28.6 % take the blue paths and 0.3 % the red paths. Thus, approximately 1 % of the parcels that ascend to the upper troposphere (i.e., parcels with either blue or red trajectories) move into the warm core. We examined the radial positions of parcels in the boundary layer when they begin to ascend to the top of the eyewall in the forward trajectory analysis. Although no significant difference in the positions of radius was found between the parcels moving outward and those coming into the eye, the radii of the maximum frequency for the former parcels (60–70 km) are larger than those for the latter (50–60 km) (not shown). This indicates that although the initial position of ascent in the boundary layer may not be the only determinant of the separation of parcel movement at the top of the eyewall, it may be one of such factors.

As in Fig. 7, but solid lines show representative forward trajectories starting from the boundary layer. Blue trajectories are parcels moving outward in the upper troposphere and red trajectories are parcels moving into the warm core. The number of trajectories in each category is not proportional to their actual relative frequencies.
Previous studies (e.g., Kossin et al. 2000; Kossin and Eastin 2001; Nguyen et al. 2011) reported that episodic structure variations in the TC inner core often occur. Because the time scale of these episodic variations is at an order of 1 h, we examine the time variation of the events that parcels move into the warm core at this time scale. To examine whether air from the lower troposphere flows into the warm core episodically or continuously, we performed additional forward trajectory analyses in the same way as discussed above starting every hour from t = 0 h to t = 12 h. The results show that 0.2–0.4 % of the total parcels enter the warm core. Thus, the warm core acquires air from the lower troposphere continuously, not episodically, at least during the period of the simulation. The proportion of total parcels ascending to the upper troposphere that enter the warm core is 0.7–2.1 %.
To explain the dynamics of the parcels that move outward or into the warm core, we examined the radial force (Fr) acting on the parcels. Because the Coriolis force near the center of the typhoon is much smaller than the centrifugal force and the pressure-gradient force, we focus on the balance between the latter two forces. Figure 11 shows the changes in the radial acceleration with time of a representative blue trajectory parcel in Fig. 10. As the parcel moves inward below 1 km between 15 h and 17 h, the pressure-gradient force mainly acts on the parcel such that the inward radial velocity increases, and both the pressure-gradient force and centrifugal force increase rapidly in magnitude in the boundary layer within the 150-km radius. The pressure-gradient force reaches a peak at about 95-km radius at about 16.5 h, and the centrifugal force reaches a maximum at about 65-km radius at about 17 h. Hence, the radial acceleration changes rapidly from inward to outward below the eyewall clouds. This outward acceleration leads to a rapid change in the radial velocity from inward to outward, which is consistent with the low-level convergence below the eyewall (Fig. 4b). The parcel then moves outward and upward in the eyewall with a peak vertical velocity of approximately 7 m s−1. At about 13-km height, the parcel is accelerated outward (positive radial acceleration) because of the centrifugal force and the outward pressure-gradient force related to the local high-pressure area, which may be caused by the strong updraft.

(a) A representative forward trajectory of an air parcel flowing outward (following a blue trajectory in Fig. 10). Gray contours show the absolute angular momentum (× 106 m2 s−1), averaged azimuthally and temporally from 17 h to 20 h. (b) Radial acceleration (black line, × 10−3 m s−2), centrifugal force (red line, × 10−3 m s−2), radial pressure-gradient force (green line, × 10−3 m s−2), radial velocity (blue line, m s−1), vertical velocity (orange line, m s−1), and absolute angular momentum (black line in the bottom panel, × 106 m2 s−1) per unit mass of the parcel.
Figure 11b also shows the changes in the absolute angular momentum (M) with time. The absolute angular momentum averaged azimuthally and temporally from when the parcel begins to ascend in the eyewall (M̄) is superimposed on Fig. 11a. Although M̄ in Fig. 11a does not exactly correspond to M in Fig. 11b, it is useful to understand the time change of M of the parcel. As the parcel moves inward through the boundary layer, its M decreases from 7 × 10⁶ m2 s−1 to 4 × 10⁶ m2 s−1 because of surface friction. Then, as the parcel ascends in the eyewall, its M remains nearly constant (17–18 h). Because the tangential wind decreases with height (Fig. 4a), the parcel moves outward along the constant M̄ surface. It is then accelerated outward by the outward pressure-gradient force and comes across the constant M̄ surface from 11-km to 15.5-km height (18–18.5 h). The M decreases because of the tangential pressure-gradient force related to the local high-pressure area and the mixing with the lower-M air above. Then, M continues to decrease because of the tangential pressure-gradient force coming from the larger scale asymmetric pressure pattern.
Figure 12 shows the changes in the radial acceleration of a parcel following a red trajectory in Fig. 10. This parcel is also accelerated outward in the eyewall clouds by the centrifugal force, which is greater than the pressure-gradient force, via the same mechanism that results in the parcel flowing outward in the upper troposphere. The peak vertical velocity is approximately 14 m s−1, which is larger than that in Fig. 11. Because the outward radial velocity of this parcel increases less than that of the blue trajectory parcel (Fig. 11), the parcel reaches a height of about 17 km near the tropopause without having moved as far outward. Because the region where the pressure-gradient force is much greater is displaced from where the centrifugal force is greater (Fig. 13), the local pressure deviation defined as the deviation from the pressure averaged over a horizontal area within the 500-km radius (Fig. 14a) accelerates the parcel toward the warm core. Other parcels also enter the warm core in this azimuthal region.


Horizontal distributions of (a) centrifugal force (× 10−3 m s−2) and (b) radial pressure-gradient force (× 10−3 m s−2), averaged vertically from 16-km to 17-km height and temporally from 18 h to 21 h. Light gray vectors in (a) and (b) indicate the centrifugal force and horizontal pressure-gradient force, respectively. The dark gray line shows the trajectory of the parcel shown in Fig. 12; the triangle indicates the end point of the trajectory.

Horizontal distributions of pressure deviation (hPa) (a) at 16.8-km height and 19 h, and (b) averaged vertically from 16-km to 17-km height and temporally from 18 h to 21 h. In (a), the gray line shows the trajectory of the parcel shown in Fig. 12; the triangle indicates the end point of the trajectory, and the circle indicates the position of the parcel at its current position (i.e., at 19 h and 16.8-km height).
As with the blue trajectory parcel, the M of the red trajectory parcel decreases from 7 × 10⁶ m2 s−1 to 3 × 10⁶ m2 s−1 in the boundary layer and is nearly conserved while ascending in the eyewall (18–18.5 h). The smaller M allows the parcels to reach close to the tropopause without having moved outward. Its M rapidly decreases from about 8-km height. It then comes across the constant M̄ surface (18.5–19 h) and reaches close to the tropopause.
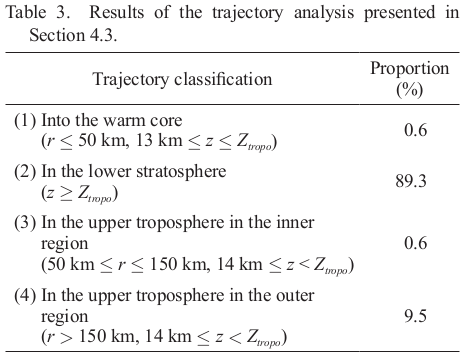
4.3 Proportion of air parcels entering the warm core from the lower stratosphereTo estimate the proportion of parcels moving into the warm core from the lower stratosphere, we performed a forward trajectory analysis as in the analysis described in Section 4.2 except for starting points located at 200-m intervals between 17 km and 18 km (6 levels). A total of 22,680 trajectories were calculated, and the results show that most parcels stay in the lower stratosphere (Table 3). Figure 15 shows the representative trajectories of the parcels that descend into the warm core from the lower stratosphere [(1) in Table 3]. Of all the trajectories, 0.6 % of the parcels flow into the warm core, which is larger than the proportion moving into the warm core from the boundary layer [0.3 %; (2) in Table 2]. The backward trajectory analysis in Section 4.1 shows that the parcels coming from the lower stratosphere [approximately 24 %; (2) in Table 1] are fewer than those coming from the lower troposphere [approximately 28 %; (1) in Table 1]. The discrepancy between the backward and the forward trajectory analyses is probably caused by the vertical motion of air in the lower troposphere. In the lower troposphere, there are vertical exchanges of air with the air in the middle to upper troposphere due to convective clouds. Because approximately half of the parcels in the lower troposphere are carried aloft by convective clouds before the parcels reach the eyewall [(8) in Table 2], those from the middle and upper troposphere must descend to compensate for the updrafts. The forward trajectory analysis traces only the parcels located in the lower troposphere at the starting time but not those descending from the middle and upper troposphere. Conversely, most parcels in the lower stratosphere stay at heights between 16.5 km and 18 km, and vertical exchange does not appear to be active.

Representative forward trajectories of parcels moving into the warm core from the lower stratosphere in radius–height cross-section. Triangles indicate the end points for the trajectories. Contours show the azimuthally averaged potential temperature deviation at 24 h (K). The black dashed line shows the tropopause.
The trajectory analyses show the origin of the air comprising the warm core. Because the central pressure fall requires mass divergence of the air column in the eye, air must be removed (at a higher rate) from the eye to exceed the mass inflow. To investigate the paths of air leaving the eye, we performed another forward trajectory analysis using the same horizontal locations for the starting points as in the analysis described in Section 4.1; however, 1-km intervals were used in the z direction between 1 km and 16 km. A total of 961 forward trajectories were calculated at each level for 12 h from the starting time at t = 12 h. Table 4 summarizes the results of the trajectory analysis.

Figure 16 shows the representative trajectories of the parcels that reach more than the 150-km radius at 24 h [(1) in Table 4]. Parcels starting above 10 km in the eye descend slowly as they flow outward, whereas those starting below 10 km maintain an approximately constant altitude as they move toward the eyewall. These trajectories agree well with the relatively stronger descent in the eye between 10 km and 14 km in the simulation (Fig. 4c). Once the parcels at all levels of the troposphere have moved into the eyewall, they ascend in the eyewall and then flow outward in the upper troposphere. Thus, in the simulated typhoon, parcels throughout the troposphere leave the eye through the eyewall. As a result of this net outflow, the central pressure falls in the simulated typhoon.

Representative forward trajectories, viewed in radius–height cross-section, of air parcels reaching the region outside of the eyewall. These parcels originate in the eye at heights of 1 km (green), 3 km (light-blue), 5 km (gray), 7 km (purple), 9 km (orange), 11 km (blue), 13 km (red), and 15 km (brown). The number of trajectories in each category is not proportional to their actual relative frequencies. Squares indicate the starting points for the trajectories and triangles indicate the end points. The black dashed line shows the tropopause at 12 h.
Figure 17 shows a plane view where trajectories in Fig. 16 are projected at each level. The parcels at all levels move outward rotating cyclonically. The same applies to the parcels originating at any level not shown in Fig. 16. Some parcels at a height of 1 km remain stagnant for a relatively long period and rotate cyclonically within the eye.

Forward trajectories, viewed in horizontal cross-section, of air parcels originating in the eye at heights of (a) 1 km, (b) 3 km, (c) 9 km, and (d) 13 km in Fig. 16. Only trajectories in (a) are thinned out to half. Squares indicate the starting points for the trajectories and triangles indicate the end points. Contours show the tangential velocity component (m s−1) at 12 h.
Figure 18 shows the proportions of parcels reaching more than the 150-km radius, drifting at radii between 50 km and 150 km, and remaining within the 50-km radius at each height. Many parcels starting in the eye at heights below 2 km or between 9 km and 12 km leave the eye, whereas most parcels starting at heights between 3 km and 7 km remain in the eye, indicating that mass divergence in the eye is active below 2 km and between 9 km and 12 km but not at heights between 3 km and 7 km. This result is consistent with the azimuthally averaged radial velocity pattern in the simulation (Fig. 4b), which indicates a low-level outflow from the eye into the eyewall and a weak outflow at heights between 8 km and 12 km.

Proportions of parcels remaining in the eye (gray), drifting in the eyewall (white), and reaching the region outside of the eyewall (black) relative to the total parcels at each height.
θ and θe of the parcels are changed by the subgrid-scale turbulent mixing. Hence, to better interpret the results of the trajectory analyses, the turbulent mixing effects should be considered. When an air parcel is ascending in the eyewall, θe of the parcel is approximately conserved (Fig. 8), that is, the parcel ascends moist adiabatically in the eyewall without mixing with the lower-θe air surrounding the eyewall cloud. As shown by the backward trajectory analysis, some parcels in the mid-troposphere enter the eyewall (light-blue and purple trajectories in Fig. 7), that is, advection of the air in the mid-troposphere into the eyewall occurs. According to Fig. 8, the θ increases (by ∼ 5 K) when the parcel flows inward near the tropopause. Because the changes in θ and θe are the same near the tropopause and the radiation processes of clouds and the atmosphere are not considered in this study, the parcels must mix with higher-θ air around the tropopause for their θ to increase. The mixing possibly occurs via nonlinear interactions between the overshooting convective updrafts and the tropopause or by the breakdown of the convectively generated gravity waves, as proposed by Lane et al. (2003). We also see a sharp decrease in θ of the parcel from the lower stratosphere (by ∼ 20 K) between 20.5 h and 21 h (Fig. 9), which may be due to mixing with lower-θ air in the troposphere. In addition, the paths of both groups of parcels are similar when the parcels flow inward in the upper troposphere. For these reasons, considerable mixing also occurs near the tropopause, besides that in the boundary layer where turbulent mixing is active. Together, these results suggest that the upper-level warm core maximum is mainly formed by the advection of air parcels from both the lower troposphere and the lower stratosphere.
The mixing effect near the tropopause can be estimated by using the data presented in Table 1. Provided parcels (1), (3), (4), (5), (6), and (7) (approximately 67 % of the total parcels), all of which originate in the troposphere, have θe of 369 K (corresponding to the average value at radii between 60 km and 120 km at heights between 12 km and 15 km), the parcels (2) and (8) (approximately 32 % of the total parcels), which originate in the stratosphere, have θe of 389 K (corresponding to the average value within the 150-km radius above the tropopause), and the parcels (9) (approximately 1 % of the total parcels), which pre-exist in the warm core region, have θe of 370 K (corresponding to the average value at 9 h), θe of the mixed air is about 375 K, which is similar to the average value of all parcels at 24 h (approximately 378 K). Thus, the results of the trajectory analysis are consistent with the development of the warm core.
5.2 Process by which air parcels enter the warm coreMost parcels gain a large outward velocity and begin to move outward above about 12 km (blue trajectories in Fig. 10). The outward radial force acting on the parcels is the centrifugal force that is larger than the inward pressure-gradient force or the outward pressure-gradient force that may arise in the local high-pressure area caused by the strong updraft in the eyewall. Some parcels, however, gain only a small outward radial velocity above about 12 km and continue to ascend to the tropopause at about 16.5-km height (red trajectories in Fig. 10). Because the axisymmetric primary circulation (and thus the centrifugal force) near the tropopause is weak (vθ < 10 m s−1; see Fig. 4a), the radial acceleration near the tropopause may depend primarily on the radial pressure-gradient force (Fig. 13). The temporally averaged pressure in the eye is lower than the pressure outside the eye even near the tropopause (Fig. 14b). Thus, the pressure-gradient force allows the air parcels to enter the warm core if they reach a level near the tropopause without the large centrifugal force or outward radial pressure-gradient force.
As noted in Section 4.2, the parcels entering the upper-level warm core tend to begin ascending in the boundary layer at the smaller radii than those moving outward in the upper troposphere. This is consistent with the finding that the parcels beginning to ascend in the eyewall in Fig. 12 have smaller M than those in Fig. 11. Because the outward slope of M surfaces generally increases with radius (and M), parcels ascending at a small radius are more likely to reach a level near the tropopause.
Although most parcels moving into the upper-level warm core maximum descend from near the tropopause, not all of them near the tropopause enter the warm core. Some blue trajectory parcels (Fig. 10) reach a level near the tropopause and then flow outward because of a centrifugal force or an outward pressure-gradient force generated by a local pressure perturbation. Thus, reaching a level near the tropopause without substantial outward acceleration appears to be a necessary condition for a parcel to move into the warm core. The pressure distribution near the tropopause determines whether the parcels that arrive near the tropopause flow outward or move into the warm core.
5.3 Air flows in the eye and the eyewallWilloughby (1998) showed that the eye contains two air masses separated by an inversion formed at 850–500 hPa. The air below the inversion mixes with air from the eyewall and is incorporated into the updraft in the eyewall. Cram et al. (2007) showed that a considerable number of parcels move from the low-level eye into the eyewall from the result of the forward trajectory analysis (I). They also found that some parcels in the boundary layer inflow are transported into the eye from the result of the forward trajectory analysis (II). In this study, although the simulated typhoon has no obvious inversion in the low-level eye, the air below 1 km is nearly saturated, whereas the air above 1 km is relatively dry (not shown). The trajectory analyses showed that the parcels from the low-level eye enter the eyewall (green trajectories in Fig. 7; green trajectories in Fig. 16). As shown in Section 4.4, many parcels initially at heights below 2 km leave the eye through the eyewall, which is consistent with the forward trajectory analysis (I) of Cram et al. (2007). The forward trajectory analysis discussed in Section 4.2 indicates that 0.3 % of parcels are located in the eye at 24 h [(3) in Table 2], which is consistent with the forward trajectory analysis (II) of Cram et al. (2007). A small number of parcels initially in the low-level inflow layer enter the eye and then ascend in the eyewall (Fig. 10). We consider these trajectories to be a combination of trajectories (I) and (II) of Cram et al. (2007). Similar trajectories have been reported by Braun (2002) and Persing and Montgomery (2003). Together, the results of the trajectory analyses suggest that the air in the low-level eye likely mixes with air in the eyewall or outside the eyewall, as suggested by Willoughby (1998).
Willoughby (1998) argued that the warm, dry air above the inversion has remained inside the eye since its formation. However, our analysis in Section 4.4 shows that some parcels in the eye above 2 km flow outward through the eyewall (see Fig. 18). In addition, some parcels in the eye (maximum of 23 % of parcels starting at 1-km height) move into the eyewall and then return to the eye at a higher altitude [a part of the parcels (2) in Table 4], which is similar to the purple trajectories in Fig. 7. We also found that some parcels pass through the warm core before moving outward in the upper troposphere (0.6 % of the blue trajectories in Fig. 10). In the simulated typhoon, some parcels move into and out from the middle and upper level of the eye and the eyewall. Cram et al. (2007) showed that air in the middle and upper level of the eye also enters the eyewall. In their analysis, more parcels are removed from the eye at 9.8-km than at 5.6-km height. Their simulated hurricane has a vertical wind shear of approximately 12 m s−1 between 1-km and 12-km heights. Although the vertical wind shear in our simulation is comparatively weaker (about 5.0–6.5 m s−1 between 1-km and 12-km heights) and the simulated typhoon has no inversion in the eye, our case is consistent with that of Cram et al. (2007) and is similar to the weakening cases of Willoughby (1998). Stern and Zhang (2013b) showed that stirring of air from the eye at 6-km height is greatly suppressed once the TC achieves a sufficient intensity (∼ 35–45 m s−1 of maximum wind speed). The maximum wind is about 47–63 m s−1 in the period during which trajectories in Section 4.4 are calculated (Fig. 2b) and is stronger than their threshold intensity (∼ 35–45 m s−1). The proportion of the parcels that originate at the 6-km height and remain within the eye [60 %; (2) in Table 4] is smaller than that of Stern and Zhang (2013b) (more than 90 %). Cram et al. (2007) and Stern and Zhang (2013b) showed that stirring decreases when the initial radius of a trajectory decreases. The proportion of the parcels that originate within the 20-km radius at the 6-km height and remain within the eye (74 %) is larger than that in Table 4 (60 %).
5.4 Subsidence in the eyeWilloughby (1998) showed that both a saturated descent, which is evaporatively driven along the inner edge of the eyewall, and a forced dry descent, which is forced as convection draws mass from the bottom of the eye into the eyewall, occur in the eye, and these two characteristic downward motions are also simulated in our study (Fig. 4c). Our forward trajectory analyses (Sections 4.2 and 4.4) show that some parcels move downward along the inner edge of the eyewall (not shown), corresponding to the saturated descent. They also show that some parcels at all heights move outward, descend along the inner edge of the eyewall and then return to the eye [a part of the parcels (2) in Table 4].
Willoughby (1998) suggested that the forced dry descent warms the air in the eye adiabatically. Thus, parcels moving inward and descending in the eye adiabatically (see Figs. 8, 9) may represent forced dry descent. The inward-flowing parcels are consistent with the findings of Chen and Zhang (2013). As suggested by Zhang and Kieu (2006), these parcels may play an important role in the subsidence in the eye. Parcels above 10 km in the eye descend and enter the eyewall at 10-km height, whereas those below 10 km enter the eyewall without significant descent (Fig. 16). This result is consistent with the stronger descent and warming simulated in the upper troposphere than in the lower troposphere (see Figs. 4c, 5), and it may be related to the relatively higher static stability layer simulated at heights between 1 km and 8 km (not shown). In summary, the trajectory analyses described in Sections 4.2 and 4.4 show that some parcels move inward from the upper-level eyewall, descend in the eye, and then return to the eyewall. A continuous flow comprising an upper-level inflow, a forced dry descent, and an outflow into the eyewall from the eye at about 10-km height is likely. The warm core in the upper troposphere may be enhanced by the descending motion, which is a part of this flow. Willoughby (1998) hypothesized that the descent in the eye is driven by drawing air from the low-level eye into the eyewall. In our simulation, the outward flow in the upper-level eye may act as an additional forcing of the dry descent. Thus, the outward flow from the eye is likely to contribute to both the central pressure fall and the forcing of the descent in the eye.
The development of the warm core and the net divergence from the eye play an important role in the central pressure fall of a typhoon. To examine the mechanisms of warm core development and removal of air from the eye, leading to the pressure fall, we performed trajectory analyses on the basis of a high-resolution numerical simulation of a developing typhoon using the cloud-resolving model CReSS. Figure 19 shows a conceptual model of the air flows in the inner core based on the results of the trajectory analyses. The air parcels comprising the warm core originate in two principal regions: the lower troposphere and the lower stratosphere.

A conceptual model of the movement of air in the inner core region of a developing typhoon in the radius–height plane. Arrowed lines represent the motions of air parcels based on the results of the present trajectory analyses. The thickness of the lines represents roughly the magnitude of the mass fluxes. Gray shading represents the warm core. The labels (e.g., W, S, T1, and E1) are described in the text.
The path T1–T2 (Fig. 19) represents the trajectories of parcels flowing in the secondary circulation. Parcels from the lower troposphere move inward, acquiring high θe as a result of the latent heat flux from the sea surface. These parcels then ascend through the eyewall (at radii between 50 km and 100 km) as their θ increases by diabatic (latent) heating. Because θe is nearly conserved while the parcels ascend in the eyewall, the parcels transport heat from the lower troposphere to the upper troposphere. In the upper troposphere, the trajectories separate into an outflow (the thicker path toward T2) and an inflow (the thinner path toward W). Most parcels move outward at heights between 13 km and 16 km because of the large centrifugal force or outward radial pressure-gradient force above about 12 km. This result is consistent with the axisymmetric secondary circulation. Approximately 1 % of the ascending parcels reach a level near the tropopause at about 17 km without accelerating outward. They then descend toward the warm core at heights between 13 km and 17 km (dark gray region, Fig. 19) and thus intensify the warm core adiabatically.
The other parcels that comprise the warm core descend from the lower stratosphere into the upper troposphere (path S–W, Fig. 19). The parcels transport higher-θ air from the lower stratosphere (θ equals θe because there is almost no water vapor) into the warm core. The proportion of parcels entering the warm core from the lower stratosphere is about the same as that entering from the lower troposphere. Hence, both high-θe air from the lower troposphere and high-θ air in the lower stratosphere contribute to the development of the warm core.
The central pressure fall requires mass divergence of the air column in the eye. In Fig. 19, the lines from the center of the eye to the 50-km radius (E1, E2, E3, E4, and W) represent the trajectories of parcels leaving the eye. In the present simulation, the removal of air from the eye through the eyewall occurs throughout the troposphere. The parcels above 10 km in the eye descend slowly as they flow outward (the path from W, Fig. 19). By contrast, the parcels below 10 km maintain their altitudes as they move to the eyewall (the lines from E1, E2, E3, and E4, Fig. 19). After entering the eyewall, nearly all parcels ascend in the eyewall and flow outward in the upper troposphere in the same way as the secondary circulation (the path T1–T2, Fig. 19). In particular, parcels from below 2 km and from heights between 9 km and 12 km are actively removed from the eye. Thus, it is this active mass divergence in these layers that likely leads to the central pressure fall.
As discussed in Section 5.2, a parcel that reaches a level near the tropopause may enter the warm core. However, it is not clear which factors determine whether the parcels reach a level near the tropopause. The distance where the parcels move radially depends on the radial force, that is, the radial acceleration and the ascent rate of the parcels. The eyewall has asymmetric components that are not examined in this study. Asymmetric components of the radial force or of the updraft in the eyewall might determine a height where the parcels reach. Indeed, Chen and Gopalakrishnan (2015) indicated that the upper-level warming occurs after convective bursts are concentrated in the down-shear-left quadrant. To further elucidate the question, such asymmetric components of the eyewall might need to be considered in future work.
The numerical simulation was performed on the supercomputer system (NEC SX-8R/128M16) of the Center for Global Environmental Research (CGER), the National Institute for Environmental Studies (NIES). This study was supported by the Japan Society for the Promotion of Science KAKENHI Grant No. 16H06311 and the Virtual Laboratory for the Earth's Climate Diagnostics Program.