Article
An Abrupt Slowdown of Late Season Tropical Cyclone over the Western North Pacific in the Early 1980s
2021 Volume 99 Issue 6 Pages 1413-1422

Details
2021 Volume 99 Issue 6 Pages 1413-1422
Translation speed is an important factor determining locally accumulated disasters induced by tropical cyclones (TCs). We found that the basin wide TC translation speed over the western North Pacific (WNP) in the late season (October–December) experienced an abrupt decrease in the early 1980s. However, this slowdown cannot be explained by the previously proposed deceleration in large-scale steering. In this study, we demonstrated that this slowdown results from the decreased proportion of subtropical TC track frequency in the early 1980s. Because late-season large-scale steering flow in the subtropical WNP is much greater than that in the tropical WNP, TCs influencing the subtropical WNP generally hold greater translation speed than that of TCs staying in the tropical WNP. Thus, a decrease in the ratio of subtropical TC track frequency can lead to a notable decrease in the basin wide TC translation speed. The decreased ratio of subtropical TC track frequency results from the strengthened southwestward steering and the reduced ratio of TC genesis in the tropical eastern WNP, which is linked to a WNP anticyclonic circulation that appears to be driven by the Atlantic Multi-decadal Oscillation. The result introduces the crucial role of TC track shift in the basin wide TC translation speed and has important implications for understanding the effects of climate change on TC translation speed.
Tropical cyclone (TC)-induced damages are usually linked to TC's own characteristics such as intensity and size, which greatly determines the intensity and duration of TC-related strong winds and heavy rainfall. Besides these canonical factors, TC translation speed is an important factor determining the locally accumulated disaster. For a specific geographic site, TC-induced disaster increases substantially when TCs move slowly because of the relatively long exposure time. Therefore, understanding the climate variations in TC translation speed is of great importance. Kossin (2018) found that TC translation speed decreased globally by 10 % over 1949–2016 and was arguably consistent with the expected weakening in atmospheric circulation forced by anthropogenic warming (Vecchi et al. 2006; Vecchi and Soden 2007). However, uncertainties in TC records in the pre-satellite era may lead to a suspicious trend in TC translation speed (Moon et al. 2019; Lanzante 2019; Kossin 2019). When only TC records for the satellite era were considered, no significant trend can be detected in TC translation speed in the western North Pacific (WNP) (Chan 2019; Yamaguchi et al. 2020; Wang et al. 2020; Zhang et al. 2020).
Most studies focused on TC activity in the peak season (July–September) because approximately 54 % of the annual total genesis frequency occurs in this season (Lander 1994). However, TC activity in the late season (October–December) brings enormous damages to the Pacific coastal regions as well, although TCs formed in this season only account for approximately 30 % of the annual total (Hsu et al. 2014). Recently, some late-season typhoons caused catastrophic disasters to the Pacific islands and Asian countries. For example, Supertyphoon Haiyan (2013) formed on November 4 and made landfall in the Philippines on November 7, killing more than 6000 people, and causing a $2.2 billion loss in the Philippines. More recently, Category 5 Supertyphoon Hagibis (2019) attained the tropical storm intensity on October 5, made landfall on Japan on October 12, killed more than 100 people, and caused approximately $15 billion worth of damages in Japan. Some studies have noted the notable climate variability in the late-season typhoons, but most of them focused on variabilities in the canonical TC activity metrics such as genesis and track frequency (Hsu et al. 2014; Zhao and Wang 2016). This study aims to examine and to understand the variations in late-season basin wide TC translation speed (BWTCS) over the WNP (0–50°N,100°E–180°). Section 2 introduces the data, method, and numerical model. Section 3 presents the abrupt reduction in the late-season BWTCS over the WNP, and Section 4 illustrates the dominant role of the shifted TC prevailing track in the BWTCS decrease. Section 5 discusses the possible contribution of the Atlantic Multi-decadal Oscillation (AMO) to the decrease in the BWTCS. Section 6 presents the summary and discussion.
TC translation speeds were derived from the best track data from the Regional Specialized Meteorological Centre Tokyo–Typhoon Center of Japan Meteorological Agency (JMA) and the Joint Typhoon Warming Center (JTWC, Chu et al. 2002). TC translation speed was calculated by the successive six-hourly TC records and distance between two locations was estimated by great circle arc. The accuracy of TC positions is foremost to the reliability in the derived TC translation speed, which is mainly determined by positions of individual TC records. Since routine polar satellite observation began around 1966 (Joint Typhoon Warming Center 1966; McAdie et al. 2009), TCs would unlikely be missed. Moreover, differences in TC location among the best track datasets for the WNP are relatively small, and there is no stepwise change in TC location differences during the late 1970s when geostationary satellite monitoring was introduced for the WNP (Song et al. 2010). Thus, the locations of TC records since the polar satellite era are generally reliable to derive the variability in TC translation speed, and our analysis period ranges from 1966 to 2018. TC records gaining tropical depression intensity were used to calculate TC translation speed to maintain accordance with previous studies (Kossin 2018; Chan 2019).
Three methods were used to identify the regime shift in the BWTCS. The first is a regime shift detection algorithm developed by Rodionov (2004), which detects a significant shift in the sequential running means with a certain cutoff length using Student's t-test. A regime shift is identified when a difference in the two means is significant at a certain confidence level. In this study, a cutoff length of 10 years was used and only regime shifts significant at 90 % confidence level are considered, following Liu and Chan (2013). The second one is the moving t-test, which is another common method used to identify regime shifts by testing the mean values of two sequential running means (Karl and Riebsame 1984). If the t statistic indicates that the mean values of two sequential running means are significantly different, a regime shift is identified between the two time periods. In this study, a 9-year running window was used. The last method is the Pettitt–Mann–Whitney method (O'Connor et al. 2015), which is widely used to determine change points in a time series.
Monthly wind data from the National Centers for Environmental Prediction–National Center for Atmospheric Research reanalysis (Kalnay et al. 1996) were used to derive changes in large-scale steering flow, which is defined as the seasonal mean pressure-weighted wind averaged between 850 hPa and 300 hPa (Holland 1983; Wu and Wang 2004; Wang and Wu 2018). Note that accurate steering flow should be estimated by the instantaneous wind fields around a specific TC. Here, we used the monthly mean wind to represent the environmental steering effect on TCs. On the basin wide scale and the interannual time scale, such approximation is sufficient to reflect climate variations in TC motion (Wu and Wang 2004; Wu et al. 2005; Emanuel et al. 2006, 2008). Wang et al. (2020) suggested that the seasonal mean large-scale steering flow is indicative of interannual variability in TC translation speed over the WNP. Sea surface temperature from National Oceanic and Atmospheric Administration Extended Reconstructed SST version 4 (Huang et al. 2015) was adopted to present the SST pattern linked to variability in the late-season TC translation speed. Trend was estimated via linear regression, and its statistical significance was assessed using a two-tailed Student t-test (Wilks 2006). Because of the relatively small sample size, the Mann–Whitney U statistic was used to test the significances of the composite anomalies (Chu 2002).
Two numerical experiments with a coupled climate model (Cao et al. 2015) were conducted to examine the contributions of AMO on anomalous large-scale circulation over the WNP. The model configuration is the same as that in Wang et al. (2019). One is the control run with external forcings (solar, volcanic, and greenhouse gases) fixed at 1990 conditions. The other is a partial coupling experiment with the AMO-regressed SST anomalies over the North Atlantic (0°–40°N, 90°W–0°) being nudged to the ocean model while keeping atmosphere and ocean freely coupled outside of this area. Each experiment includes a 30-year integration. The partial coupling run shares the same initial condition of the control run for each year. In this case, the initial conditions for each year in the partial coupling experiment are different, and the simulation for each year can be considered as one ensemble member. Hence, each experiment includes 30 ensemble members. The mean difference between the two experiments was regarded as responses to the AMO-related SST anomalies.
Figure 1 shows the time series of late-season BWTCS over the WNP during 1966–2018 derived from the JMA and JTWC best track datasets. The late-season BWTCS shows an insignificant decrease over 1966–2018 with a slope of −0.09 (−0.08) m s−1 decade−1 for the JMA (JTWC) data. The magnitudes of the decrease in the BWTCS are qualitatively consistent with that in Kossin (2018) but with a much smaller magnitude due to the different study periods (Moon et al. 2019; Lanzante 2019; Kossin 2019; Chan 2019). Previous studies found that the significant decrease in BWTCS over 1949–2016 is mainly attributed to the high-speed period over 1949–1965, when TC records may have large uncertainties due to the lack of satellite monitoring (Moon et al. 2019; Lanzante 2019; Chan 2019; Wang et al. 2020).
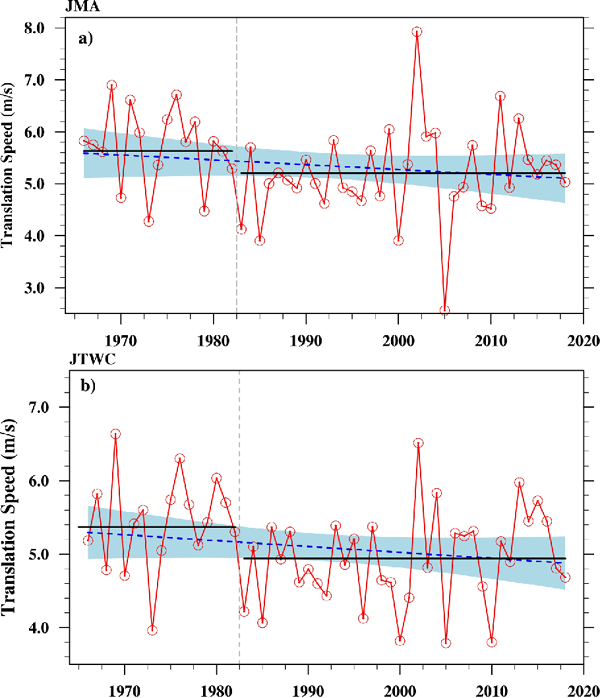
Time series of the late-season TC translation speed (red solid line) derived from the (a) JMA and (b) JTWC best track datasets during 1966–2018. Linear trends (blue dash lines) are shown with their 95 % two-sided confidence intervals (blue shading). The vertical gray dash line divides the years 1966–2018 into the high- and low-speed periods. The horizontal black dash lines denote the mean TC translation speed for the identified high- and low-speed periods.
This slowdown is mainly induced by an abrupt regime shift around the early 1980s. According to the regime detection algorithm proposed by Rodionov (2004) and the Mann–Whitney U statistic test, a high-speed period over 1966–1982 and a low-speed period over 1983–2018 can be identified in both the BWTCS derived from the JTWC and JMA best track datasets (Fig. 1). Meanwhile, results of the moving t-test also show that the late-season BWTCS experiences a significant decrease in 1983 (Fig. 2) in both the JTWC and JMA best track datasets. Particularly, the mean late-season BWTCS derived from the JTWC (JMA) best track is 5.71 m s−1 (5.44 m s−1) during 1966–1982, and it decreases to 5.17 m s−1 (4.92 m s−1) during 1983–2018. In other words, the late-season BWTCS decreases by approximately 10 % in the later period. One may note that the BWTCS in the JMA best track is slightly greater than that derived from the JTWC best track. This difference, which results from the different TC records in the two agencies, has little impact on our main conclusion. The consistency in the decrease of late-season BWTCS in the two best track datasets confirms the reliability of TC locations since the polar satellite era, which lends us confidence for further investigation. Because the results derived from the JMA best track data are generally similar to those derived from the JTWC best track, only the results based on the JMA best track are shown in the following sections.
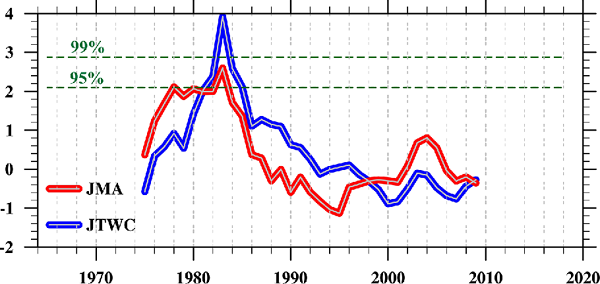
t statistic values of moving t-test of 9-year window for the late-season TC translation speed derived from the JMA (blue line) and the JTWC (red line) best track datasets. The green dashed lines indicate 95 % and 99 % confidence levels.
TC motion is predominantly determined using the TC-embedded large-scale steering flow (Chan and Gray 1982; Holland 1983). changes in TC translation speed were previously linked to temporal variations in tropical atmospheric circulation or the basin wide large-scale steering flows (Kossin 2018; Lanzante 2019). To obtain the basin wide averaged large-scale steering, we first calculated the seasonal mean pressure-weighted wind averaged between 850 hPa and 300 hPa over the WNP in each year and then calculated the basin wide averaged steering flow in each year weighted by the climatological TC track frequency, which means that weights for calculating basin wide steering are different for each grid. Particularly, steering flows over the grids that experience greater TC track frequency (e.g., vicinity of Philippines) have higher weights, whereas those over the grids that experience less TC track frequency have lower weights. Weights for large-scale steering over grids that never experience TCs are 0. Figure 3 shows the time series of basin wide averaged large-scale steering over the WNP in the late season during 1966–2018. However, temporal variability in large-scale steering seems to be irrelevant to that in the BWTCS on both the interannual and interdecadal timescales with a weak correlation during 1966–2018. In terms of regime shift, no change point can be detected in time series of the basin wide averaged large-scale steering during 1966–2018 and there is no significant difference in large-scale steering between the identified high- and low-speed periods (Fig. 3). Particularly, the difference in large-scale steering between the high- and low-speed periods is 0.03 m s−1, which can only contribute to 5 % of the difference in the corresponding BWTCS (0.54 m s−1). The result indicates that temporal variations in the basin wide averaged large-scale flows play a secondary role in the abrupt decrease in the late-season BWTCS over the WNP.
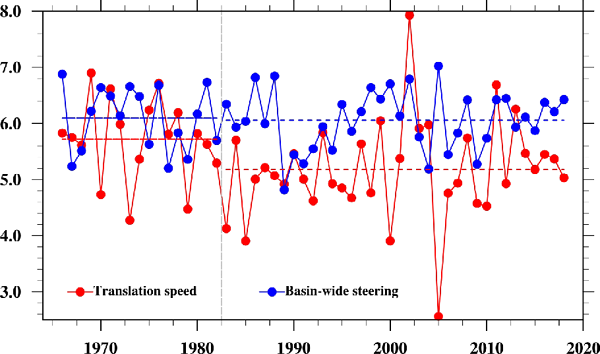
Time series of basin wide TC translation speed (red solid line) derived from the JMA best track data and the basin wide averaged large-scale steering speed (blue solid line) in the late season during 1966–2018. The vertical grey dash line divides the years 1966–2018 into the high-speed (1966–1982) and low-speed periods (1983–2018). The horizontal red (blue) dash lines denote the mean TC translation speed (large-scale steering flow) for the identified high- and low-speed periods.
Since large-scale steering over the WNP is not uniformly distributed, variations in TC track may lead to changes in the BWTCS. Particularly, large-scale steering in the subtropical WNP (to the north of 25°N) is much greater than that in the tropical WNP (to the south of 25°N), TC translation speed in the subtropical WNP is much greater than that of the tropical WNP (Figs. 4a, b). The mean TC translation speed is only 5.5 m s−1 to the south of 25°N, but it increases to 14 m s−1 to the north of 25°N, which is in accordance with the distinct contrast between the tropical and subtropical large-scale steering (Fig. 4b). Thus, it is conceivable that changes in the ratio of subtropical TC track frequency to its basin wide total can lead to variations in the BWTCS. Figure 4c shows the composite difference in the ratio of TC track frequency to its basin wide total between 1966–1982 and 1983–2018. There is a greater ratio of TC track frequency influencing the subtropical WNP during the high-speed period of 1966–1982 compared with that of 1983–2018. During 1966–1982, more TCs formed in the southeast WNP but fewer TCs formed in the northwest WNP (figure not shown); meanwhile, large-scale steering flow shows anomalous northward steering over the tropical eastern WNP, which contributes to the anomalous distribution of TC track frequency ratio (Fig. 4c). Accordingly, we further compared the latitudinal distribution of TC track frequency ratios during the two periods (Fig. 4d). A lower TC track frequency ratio can be found to the north of 30°N during 1983–2018 than that during 1966–1982, indicating that fewer TCs tend to influence the subtropical WNP during 1983–2018. These results suggest that the variation of subtropical TC track frequency is a key factor resulting in the abrupt decrease in the late-season BWTCS.

(a) Climate mean large-scale steering flows (vectors, m s−1), steering speed (shadings, m s−1), and TC track frequency (contours, number year−1); (b) latitudinal distribution of climate mean large-scale steering (red bars) and TC translation speed (blue bars); (c) mean TC track frequency (contours, number year−1), the composite difference in TC track frequency ratio (shadings, %), and large-scale steering flow (vectors, m s−1) between 1966–1982 and 1983–2018; and (d) latitudinal distribution of relative track frequency during 1966–1982 (blue bars) and 1983 –2018 (red bars). Green hatched areas and red vectors in (c) denote where the composite difference in TC track frequency ratio and large-scale steering flow is significant at the 90 % confidence level.
What contributes to the decreased subtropical TC track frequency in the later period? Most TCs influencing subtropical WNP in the late season form in the tropical eastern WNP (0–20°N, 130–180°E) with a maximum center at 10°N, 150°E (Fig. 5a). These TCs move northwestward and then turn northeastward into the subtropical westerly steering (Fig. 5b). Note that the northwestward movement of TCs mainly occurred in 0–20°N, 130–150°E, which is in accordance with the mean northward steering in this region (Fig. 5b). The results suggest that variations in the proportion of TC genesis number in the tropical eastern WNP may contribute to changes in the ratio of subtropical TC track frequency and thus to variations in the BWTCS. It is further supported by the temporal variations in the ratio of TC genesis number in the tropical eastern WNP and BWTCS in the late season (Fig. 6a), which are significantly correlated (r = 0.4, p < 0.05) over 1966–2018. Moreover, the ratio of TC genesis number in the tropical eastern WNP over 1966–1982 is 0.74, which is significantly greater than that in 1983–2018 (0.61). Meanwhile, large-scale steering may also contribute to the decreased subtropical TC track frequency in recent decades. As shown in Fig. 6b, the meridional steering flow in the tropical eastern WNP experiences a significant slowdown with a slope of 0.11 m s−1 decade−1 over 1966–2018. Particularly, the mean meridional steering in the tropical eastern WNP turns southward in the early 1980s, which can lead to fewer TCs enter the subtropical WNP and thus contribute to the decrease in the late-season BWTCS during 1983–2018.
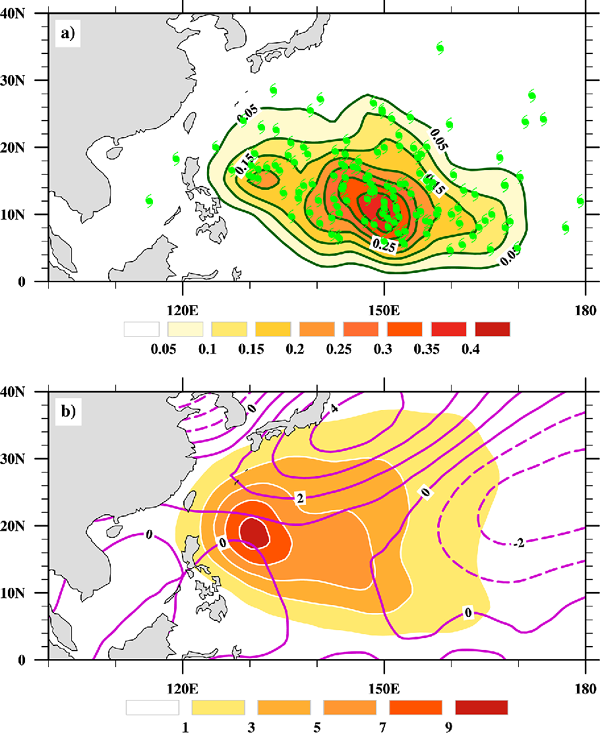
Late-season mean (a) TC genesis frequency (shadings, number decade−1), (b) TC track frequency (shadings, number decade−1) for TCs that influence the subtropical WNP in the late season and late season mean meridional component of large-scale steering (contours, m s−1) over 1966–2018. Green symbols in (a) denote the corresponding TC genesis locations.
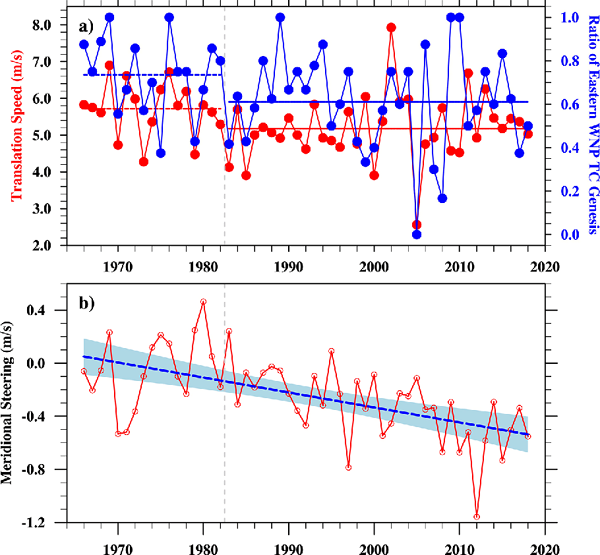
(a) Time series of the late-season TC translation speed (thin blue line) and the ratio of TC genesis number (thin red line) in the tropical eastern WNP (0–20°N, 130–180°E), (b) meridional component of steering speed over the tropical eastern WNP during 1966–2018. Linear trend (blue dash line) in the meridional steering is shown with their 95 % two-sided confidence intervals (blue shading). The vertical grey dash lines divide the years 1966–2018 into the high- and low-speed periods. The horizontal red (blue) dash lines in (a) denote the mean TC translation speed (ratio of TC genesis number in the tropical eastern WNP) for the identified high- and low-speed periods.
What drives the changes in the ratio of TC genesis number and meridional steering flow in the tropical eastern WNP? Figure 7a shows the composite difference in the relative SST and 850 hPa winds between 1983–2018 and 1966–1982. Note that the tropical mean SST (20°N–20°S) was removed to focus on the SST distribution (Vecchi and Soden 2007; Johnson and Xie 2010). SST anomalies feature cooling in the central equatorial Pacific and the subtropical North Pacific. The increased zonal Pacific SST gradient and the related heating anomalies generate an anticyclonic circulation over the eastern WNP, which is unfavorable to TC genesis and tends to decrease the ratio of TC genesis in the tropical eastern WNP to its basin total (Gray 1968). Meanwhile, southeasterlies to the eastern portion of the anomalous anticyclonic circulation can steer fewer TCs to influence the subtropical WNP and thus decrease the BWTCS over the WNP.

Composite difference in SST (shadings, °C) and 850 hPa wind (vectors, m s−1) anomalies between 1983–2018 and 1966–1982, (b) regressed SST (shadings, °C) anomalies and 850 hPa wind (vectors, m s−1) anomalies against the normalized AMO index (c) model simulated response of (a) SST (shadings, °C) and 850 hPa wind (vectors, m s−1) anomalies to the AMO-regressed SST warming in the North Atlantic. The hatched areas in (a) and (b) denote where the SST anomalies are significant at the 90 % confidence level. The green box in (c) outlines the region where the SST is nudged to the AMO-regressed warming.
The concurrent SST anomalies in the North Atlantic are featured with warming in the eastern Atlantic along coastal western Africa and subtropical region but relative cooling in the vicinity of the Gulf of Mexico. Such SST distribution resembles that of the AMO. The AMO experiences a negative phase from 1966–1994 and a positive phase during 1995–2018. Although the phase switch point does not match the change point of the decadal decrease in the BWTCS, the switch from the negative to the positive phase of AMO in the mid-1990s can contribute to the Atlantic SST warming during 1983–2018. The AMO-related SST and wind anomalies (Fig. 7b) are generally similar to those shown in Fig. 7a. Previous studies have found the AMO has a profound impact on large-scale circulation over the North Pacific (Zhang and Delworth 2007; Ham et al. 2013; McGregor et al. 2014; Li et al. 2016).
Numerical experiments with a coupled model were conducted to verify the role of AMO in the WNP large-scale circulation anomalies (Section 2). Although some discrepancies exist, with the AMO-related SST warming in the North Atlantic, the coupled model generally reproduced the observed anticyclonic circulation over the WNP and SST anomalies over the North Pacific (Fig. 7c). Particularly, the North Atlantic SST warming-induced ascending motion can remotely generate descending motion in the tropical central Pacific by modulating Walker circulation (Lyu et al. 2017). The associated easterly anomalies tend to cool the eastern tropical Pacific but warm the western Pacific through Bjerknes feedback (Bjerknes 1969; Li et al. 2015). The increased zonal Pacific SST gradient and the related heating anomalies can further emanate an anticyclonic circulation over the WNP, which acts to suppress TC genesis over the eastern WNP and steer fewer TCs enter the subtropical WNP, and thus contribute to the decrease in the late-season BWTCS over the WNP. Generally, numerical results support the proposed important role of AMO in the decrease in the late-season BWTCS over the WNP.
Late-season BWTCS over the WNP experienced an abrupt decrease in the early 1980s in both the JTWC and JMA best track datasets. Here, we found that it cannot be attributed to the temporal change in large-scale steering flow on the basin wide scale. Because climatological late season large-scale steering in the subtropical WNP is much greater than that in the tropical WNP, TCs influencing the subtropical WNP hold greater translation speed than TCs that stayed in the tropical WNP. Thus, variations in the ratio of the subtropical TC track frequency can lead to notable changes in the BWTCS. It was found that the ratio of subtropical TC track frequency indeed experienced a decrease in the early 1980s and thus led to the decrease in BWTCS. The decreased ratio of subtropical TC track frequency results from the strengthened southwestward steering and the reduced ratio of TC genesis number in the eastern WNP, which are associated with an anticyclonic circulation over the eastern WNP during 1983–2018. The anticyclonic circulation can suppress TC genesis in the eastern WNP. Meanwhile, northeasterly to the eastern portion of the anomalous anticyclonic circulation can lead to fewer TCs that influence the subtropical WNP during 1983–2018. Numerical results suggest that the anticyclonic circulation over the eastern WNP appears to be driven by the AMO-related SST warming through the modulation of the Walker circulation.
Although natural variabilities such as AMO remain the dominant factors influencing TC track frequency, Murakami et al. (2020) have shown that the signal of climate change in TC track frequency has already emerged in observed TC records, which may partially result from the increased greenhouse gas. A notable feature in their results is that the responses of TC track frequency to natural variability or external forcing show a dipole pattern with opposite anomalies in the tropical and subtropical WNP, which can lead to distinct changes in BWTCS due to the much larger TC translation speed in the subtropical WNP. Meanwhile, no significant change in BWTCS over the WNP was found in the current climate (Yamaguchi et al. 2020), indicating that the effects of external forcing and natural variability on TC track frequency may compensate each other. These competing roles of external forcing and natural variability may make it difficult to identify the same change points in the BWTCS and climate indexes.
Our results suggest that changes in BWTCS are not consistent with that of individual TCs. Hence, changes in TC translation speed, whether over land or ocean, should be examined in areas where the magnitude of large-scale steering flow is generally uniform distributed. It is only in this way that changes in the area mean TC translation speed can reflect variations in motion of individual TCs. Moreover, note that variations in TC translation speed are sensitive to the target period, season, and region. For example, Chu et al. (2012) found the steering flow during the peak season over tropical WNP experienced a deceleration, Yamaguchi and Maeda (2020) found a notable decrease in the September TC translation speed over the middle latitudes WNP during 1980–2019, whereas Kim et al. (2020) found an increase in TC translation speed over the WNP since 1982. These results suggest that variations in TC translation speed may be season and region dependent (Wang et al. 2020).
The authors thank Dr. Munehiko Yamaguchi for his editorial effort and important suggestions to improve the manuscript. This study was jointly supported by the National Key R&D Program of China (2019YFC 1510201) and the National Natural Science Foundation of China (Grant No. 42075031, 41730961, and 41922033). Numerical experiments were performed on the NUIST High Performance Computer Center.