Abstract
The free-living ciliate protist Lacrymaria olor has an extendable neck, which extends up to 8 times longer than its cell body. Previous papers assessed several ultrastructural features of L. olor; however, dynamic features of the extension and contraction cycle of the neck have been unclear. As a first step to understand the mechanism of such dynamic processes, we tried to characterize the neck deformation of living L. olor using a high-speed camera and image processing. These analyses defined the four different cell states, namely, active, resting, activation and inactivation, and highlighted the features of the neck deformation of L. olor depending upon the cell states. Our analyses will make it possible to elucidate further details of the L. olor neck deformation mechanism.
INTRODUCTION
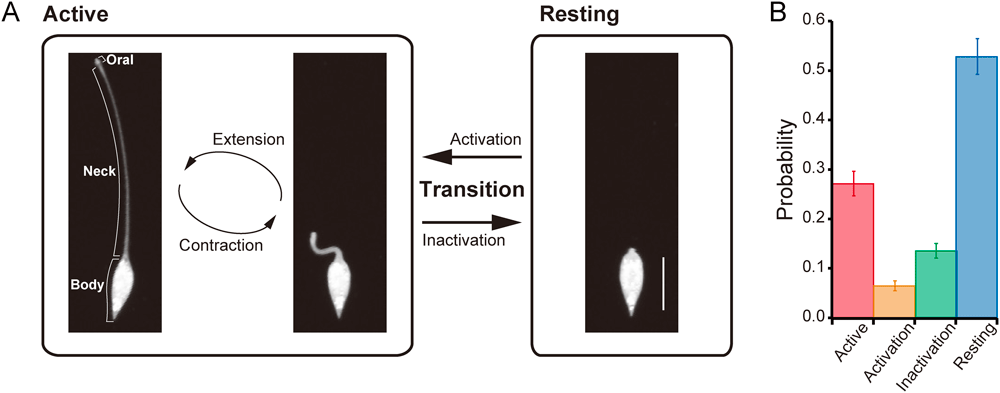
Lacrymaria olor is a free-living ciliate protist belonging to a highly diverse class, Litostomatea (Vd’ačný et al., 2011). An L. olor cell consists of three parts, a cell body, an extendable neck and an oral apparatus on the distal end of the neck (Fig. 1A; Mast, 1911; Kink, 1972). Some strains of L. olor extend their neck up to 8 times longer than their cell body (Mast, 1911). During predation, L. olor rapidly extends its neck in various directions, and then the neck is contracted. Such a rapid extension–contraction cycle is one of the unique characters of L. olor (Mast, 1911).
Previous papers proposed that the extension of the neck was induced by the beating of oral cilia (Mast, 1911; Tatchell, 1980). During the contracting process, the beating of the oral cilia stopped, and the contraction of the neck might be a result of the inherent neck elasticity (Mast, 1911). In addition, ultrastructural studies revealed characteristic intracellular structures: the microtubule bundles located under the pellicle, the crosslinking structures between the microtubules and the pellicle, and the striated microfibrillar bands along each kinety (Bohatier, 1970; Didier and Bohatier, 1970; Kink, 1972; Tatchell, 1980, 1981). Tatchell (1980) suggested that the microtubule bundles and crosslinking structures might be part of the extensile system of the neck and that the striated microfibrillar band might be a functional myoneme, a contractile structure found in some ciliates (Amos, 1972; Huang and Pitelka, 1973).
Although ultrastructural studies uncovered those intracellular structural features, dynamic features of the extension–contraction cycle of the neck in L. olor have been unclear because of experimental difficulty derived from rapid deformation of the neck. As the first step to elucidate the mechanism of such dynamic processes, we tried to characterize the deformation of the neck of living L. olor using a high-speed camera and image processing. The results make it possible to quantitatively evaluate the neck deformation of L. olor in four different cell states.
MATERIALS AND METHODS
Cell culture
Lacrymaria olor cells were collected from a pond in Nara, Japan, and cultured in a 0.01% (v/v) Knop medium (0.24 mM Ca(NO3)2, 0.14 mM KNO3, 0.06 mM MgSO4, 0.10 mM KH2PO4) in a plastic dish (22×15×4 cm) at 25°C in the dark. Cyclidium sp. was added as a food source twice a week. Cyclidium sp. were collected from the same pond and routinely cultured in 200 ml of the 0.01% (v/v) Knop medium in a flask in which 20 ml of 2% (w/v) agar containing 20 mg skim milk (Morinaga milk, Tokyo, Japan) and 20 mg yeast extract (BD Biosciences, FL, USA) was laid in the bottom. Bacteria derived from the same pond were co-cultured with Cyclidium sp. in the same flask as a food source. L. olor cells were starved for at least 2 days before use.
Counting number of cells in each state in a population of cells
The states of the cells in a culture dish were recorded using a stereomicroscope, SZH-141 (Olympus, Tokyo, Japan), with a CCD camera, DP73 (Olympus). The video recordings were performed on five different observation fields per culture dish for one minute. In one-minute recordings, the cells that continued extending and contracting their neck were counted as being in the active state, the cells whose necks remained completely contracted were counted as being in the resting state, and the cells that gradually extended or contracted their neck were counted as being in the activation or inactivation state, respectively.
Observation of length change of cells in the active state
Two strips of double-sided tape (30 µm in thickness) (Teraoka Seisakusho, Tokyo, Japan) were placed parallel to each other on a glass slide at a distance of 1.5 mm. After placing a coverslip onto the tape, the chamber was filled with the 0.01% (v/v) Knop medium. A few L. olor cells in the culture medium were transferred into the chamber from one side of the openings using a glass pipette with a fine tip. The movement of a cell was observed using a dark-field microscope, BX60 (Olympus), with a high-speed CCD camera, FASTCAM-NEO 32K (Photron, Tokyo, Japan), at 250 frames/s.
Observation of length change of cells in the transition and resting states
The cells prepared as described above were observed using a dark-field microscope, BX60, with a CCD camera, DP73, for long-time observations in a video.
Analysis of the change of the cell length in each cell state
The recorded images were converted to binarized images between the cell and background. Then, a skeleton line was extracted from the binarized cell shape in each frame of the recording with the image analysis software ImageJ (Schindelin et al., 2012). The length of an extracted skeleton line for each recording frame was successively measured using the Analyze Skeleton Plugin (Arganda-Carreras et al., 2010) and an ImageJ macro for automatic measurement.
Length measurements of cells in the resting state
Cells in culture dishes were captured using an inverted microscope, IX70 (Olympus), with a CCD camera, DP70 (Olympus). The length of each cell in the resting state was manually measured using the captured images with ImageJ.
Measurements of duration of the active and resting states
The states of the cells in a culture dish were recorded using a stereomicroscope, SZH-141 with a CCD camera, DP73 for 50 min. In fifty-minutes recordings, the average durations of the active and resting states of each cell were measured.
Immunofluorescence microscopy
A modified method of El-Haddad et al. (2013) was used for the immunofluorescence microscopy. Cells were concentrated at 100×g for 5 min and resuspended in 1.5 ml of PHEM buffer (60 mM PIPES, 25 mM HEPES, 10 mM EGTA, 2 mM MgCl2, pH 7.0) containing 4% (w/v) paraformaldehyde (Nisshin EM, Tokyo, Japan) and 0.5% (w/v) Triton X-100. The cells were fixed at room temperature for 30 min, concentrated at 500×g for 5 min, and resuspended in 1 ml of phosphate-buffered saline (PBS) containing 0.1 M glycine and left for 20 min. The concentrated cells were resuspended in 1 ml of PBS with 0.2% (w/v) bovine serum albumin (BSA) and blocked for 30 min at room temperature. After blocking, the cells were incubated with an anti-α-tubulin monoclonal antibody as the primary antibody (Merck, Darmstadt, Germany) at a 1 : 500 dilution in PBS containing 0.1% (w/v) BSA and 0.1% (w/v) Triton X-100 for 1 h. The washed cells were incubated with a 1 : 1,000 dilution of Alexa Fluor 488 conjugated anti-mouse IgG antibodies as the secondary antibodies (Thermo Fisher, MA, USA) in PBS containing 0.1% (w/v) BSA and 0.1% (w/v) Triton X-100 for 1 h. All washes (three times for 10 min each after each antibody incubation) were performed using 1.5 ml of PBS containing 0.2% (w/v) Triton X-100. The specimens were observed with a confocal laser microscope, LSM 510 (Zeiss, Heidelberg, Germany) using a Plan-Apochromat 63×/1.4 NA objective lens (0.7 µm optical slice thickness, 57 z-sections for the cell in the active state and 43 z-sections for the cell in the resting state were collected).
Data Analysis
To characterize the extension–contraction cycle in the active state, we examined the autocorrelation of the cell length, described as Autocorrelation (t)=⟨(L(t′)−L̅)(L(t′+t)−L̅)⟩t′,i (t: lag time, L: cell length, L̅: average of cell length, i: cell number, ⟨ ⟩t′,i: temporal and ensemble average of the all cell-length changes). The value of Autocorrelation (t) should have a maximum at t=0 s, and we normalized the Autocorrelation (t) as Autocorrelation(0)=1. The normalized Autocorrelation (t) was generally used in analyses of various oscillatory phenomena (Li et al., 2008; Despósito and Viñales, 2009; Krauss et al., 2010; Nishigami et al., 2016; Kirby et al., 2016).
To analyse the length of the neck in the transition states, the strain was examined. The strain is defined as ε(t)=(L(t)−Lr)/Lr (L: length of a cell, Lr: length of the resting cell) (Morrison, 2001). In the activation process, the length just starting activation (at t=0 s) was used as Lr. In the inactivation process, the length at t=160 s was used as Lr. In this work, the strains were smoothed using median values before and after 7.5 s. The averaged values of the strain were fit by a simple viscoelastic model, called the Kelvin–Voigt model, because living cells have viscoelastic properties (Evans, 1983; Bausch et al., 1998; Yamada et al., 2000; Karcher et al., 2003). In the activation process, the Kelvin–Voigt model of the extending (creep) process was used for fitting, which is described as ε(t)=(σ/E)(1−exp(−t/τ)) (σ: stress, E: elastic modulus, τ: retardation time) (Morrison, 2001). The retardation time was regarded as the characteristic time of the activation process and is equivalent to the reciprocal of the reaction rate constant of the activation process if the process is considered as a first-order reaction in kinetics. In the inactivation process, the Kelvin–Voigt model of the contracting (creep recovery) process was used for fitting, which is described as ε(t)=ε0 exp(−t/τ) (ε0: strain at t=0 s, τ: relaxation time). The relaxation time was regarded as the characteristic time of the inactivation process and is equivalent to the reciprocal of the reaction rate constant of the inactivation process if the process is considered as a first-order reaction in kinetics. All statistical analyses were carried out using Igor 6.3.7.2 (WaveMetrics, OR, USA).
RESULTS
Cell states of L. olor
It has been known that L. olor exhibits two states, namely, the active and resting states (Mast, 1911; Fig. 1A). In the active state, L. olor cells actively extend and contract their necks. On the other hand, the cells in the resting state keep their necks contracted and take a spindle shape. However, it is still unclear what kinds of processes L. olor goes through to switch between the two states. In detailed observations of the deformation of L. olor, we found that transition states connect between the active and resting states, in which a cell gradually changes the length of its neck and the activity of the extension–contraction cycle (Fig. 1A). The processes of transitioning from the resting state to the active state and from the active state to the resting state were termed activation and inactivation, respectively.
Considering the probability of the cells in each state in a population, more than half of the population existed in the resting state (53±4% (SEM, n=5)), whereas only 27±2% (SEM, n=5) of the population existed in the active state. The probability of cells being in the transition states was lower than the probability of them being in the other states (activation: 6±1%, inactivation: 14±1% (SEM, n=5); Fig. 1B).
Analysis of the extension–contraction cycle in the active state
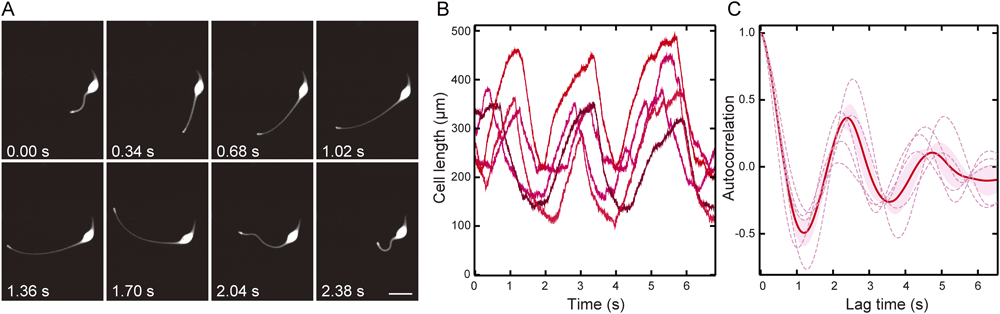
To examine the difference of each state (active, resting, activation or inactivation), we tried to characterize the active state first. To measure the length of a cell during the active state, we performed high-speed imaging and analysed the images obtained with image processing (Fig. 2A, B; see Materials and Methods). L. olor repeatedly extended and contracted its neck, and the period of the extension–contraction cycle looked similar even among the different specimens (Fig. 2B). Such oscillation was also confirmed in the autocorrelation function of the neck length (Fig. 2C) because the function, Autocorrelation (t), oscillated across 0. The lag time at the first maximum value of Autocorrelation (t), which corresponds to an oscillation period, was 2.4±0.3 s (SEM, n=5). In addition, the amplitude of the autocorrelation function gradually decreased, which refers to the imperfect periodicity of the extension–contraction cycle.
Analysis of cells in the resting state
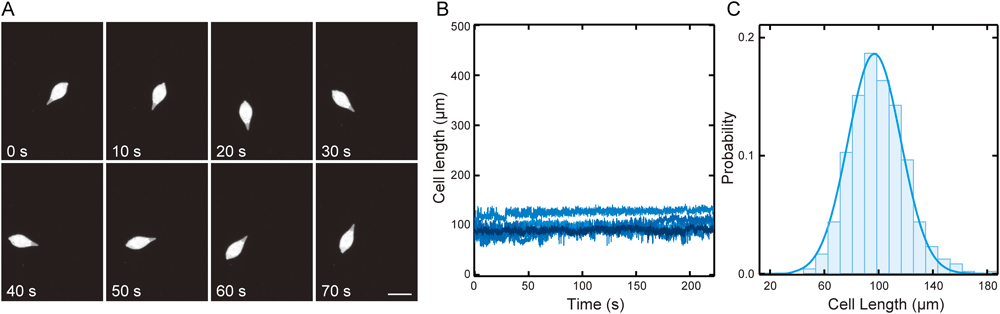
In the active state, the cell length actively changed, and the average value of the cell length was approximately 300 µm (Fig. 2A, B), while the cells in the resting state did not change their length (Fig. 3A, B), and the average cell length was 93.5±19.4 µm (SD) (Fig. 3C). In the resting state, the neck was completely integrated with the cell body and became indistinguishable from the cell body (Fig. 3A). The duration of the resting state was 281±34 s (SEM, n=5), which was almost similar to that of the active state (244±53 s (SEM, n=5); Table 1).
Table 1. The duration of the active and resting states
| Cell states |
Duration (s) |
| Active |
244±53 |
| Resting |
281±34 |
Values are expressed as mean±SEM (n=5).
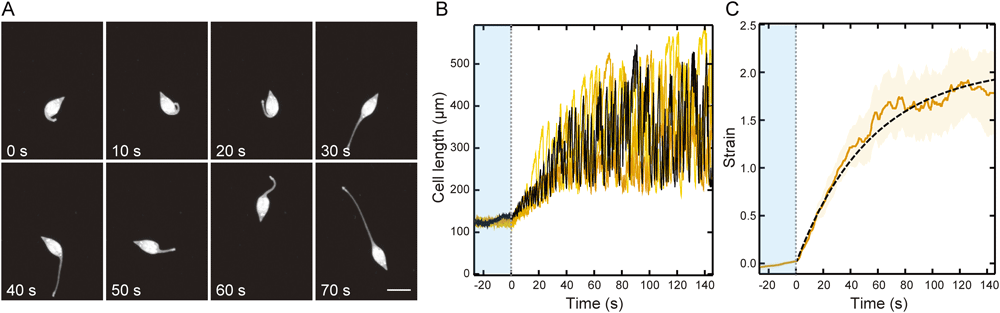
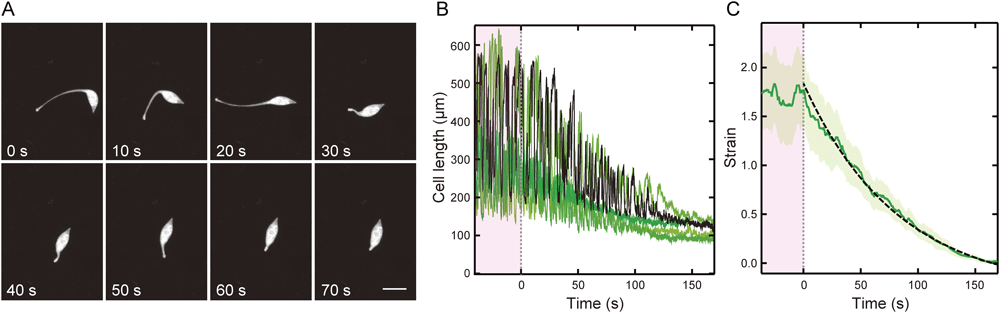
We also analysed the change in the cell length of L. olor in the two transition states, the activation and inactivation states. When the activation state started, the neck, which had been integrated in the cell body, began to elongate. At the beginning of the activation state, the amplitude of the extension–contraction cycle of the neck was small. Then, the amplitude gradually became larger according to the elapsed time, and finally, the cells entered the active state (Fig. 4A, B). To characterize the activation process, we examined the time-dependent strain change. Fig. 4C shows the average values of the strain (a yellow solid line). A characteristic time of activation was obtained from a viscoelastic model fitting, Kelvin–Voigt model fitting, (see Materials and Methods), and the value was 42.5±0.3 s (SEM, n=5).
Next, we characterized the deformation of the cells in the inactivation state. During the inactivation process, the cells gradually reduced the amplitude of the extension–contraction cycle of the neck. Then, the neck was integrated in the cell body, and finally, the cell entered the resting state (Fig. 5A, B). We examined the strain change and fitted the strain change using the viscoelastic model equation (Fig. 5C; see Materials and Methods). As a result, the characteristic time of inactivation was 82.4±1.3 s (SEM, n=5).
Difference of the microtubule arrays between the active and resting states
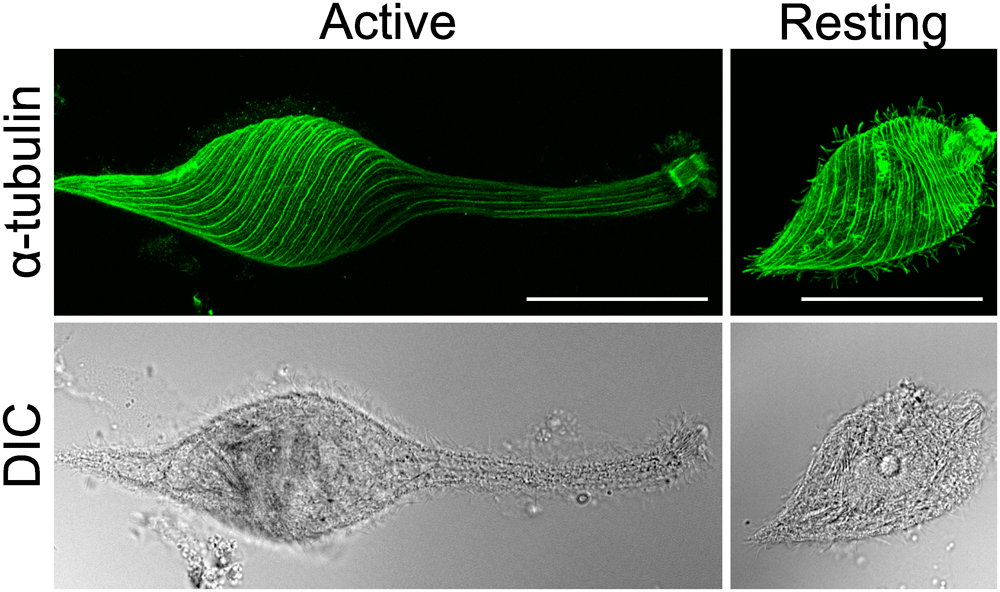
Motile activity and cell morphology changed according to the cell states. To investigate how the intracellular structures are different between the cell states, we observed the microtubules of the L. olor cells in the active and resting states using immunofluorescence. In cells in the active state, the microtubules were aligned spirally at the cell body. Then, these arrays were aligned almost parallel to the long axis, making the anterior end of the cells as elongated as their neck. On the other hand, in cells in the resting state, the microtubule arrays at the posterior half of the cell body were almost the same as the cells in the active state; however, the concentrated winding microtubule arrays were seen at the anterior end of the spindle shaped cells (Fig. 6). These observations suggest that the drastic difference in the microtubule arrays at the anterior end may be related to the difference in the neck activity according to the cell states.
DISCUSSION
The neck extension–contraction cycle of L. olor in the active state has attracted attention for a long time; however, the detailed character of the deformation has been unclear. In this study, we quantitatively demonstrated that the deformation is indeed an oscillatory movement with an oscillation period of approximately 2.4 s and an imperfect periodicity. Moreover, it appeared that the deformation was autonomously performed without any apparent external stimuli. Such fast and autonomous oscillatory movement was also reported in various organisms, and the prominent example of such a movement is the autonomous contraction of human embryonic stem cell-derived cardiomyocytes (hES-CMs), which are coupled to the autonomous generation of action potentials (Satin et al., 2004). It is known that the ciliary beating of L. olor starts to reverse as the neck starts to contract (Mast, 1911). Moreover, the ciliary reversal is coupled to the generation of the action potential (Kinoshita et al., 1965). These facts suggest that the contraction of the neck may be coupled to the generation of the oscillatory action potential as was the case of hES-CMs and that the action potential might totally regulate the autonomous oscillatory deformation of the neck in L. olor.
In addition to the active cell state, it has been known that L. olor takes on a resting state (Mast, 1911). However, it has been unclear how the cells switch between the active and resting states. We found two novel L. olor transition states, which connect between the active and resting states, namely, the activation state and the inactivation state. The cells in transition states switched cell states by gradually changing the extension–contraction amplitude of the neck. The characteristic times of the activation and inactivation were 42.5±0.3 and 82.4±1.3 s, respectively. It is obvious that the deformations of the transition states are much slower than those of the extension–contraction cycle in the active state. Considering the difference in the microtubule arrays between the active and resting states, it is inferred that changes between the active and resting states are associated with significant rearrangement of the microtubule arrays beneath the cell surface. The long duration for the transitions (more than 1 min in full transition) may reflect the time required for the rearrangement of the microtubule arrays. Moreover, it was revealed that deformation in the inactivation state takes almost two times longer than the deformation in the activation state. The difference in the required durations between the activation and inactivation may be due to the difference or anisotropy in the rearrangement dynamics of the microtubules and/or the force generated by the beating of the oral cilia, which may more extensively contribute to the deformation of the neck in the activation state than in the inactivation state.
Our findings shed light on the features of the neck deformation of L. olor and defined the cell states of L. olor. These findings and analyses will make it possible to elucidate further details of the neck deformation mechanism, e.g., the relationship between the extension–contraction cycle and the kinetic apparatuses, such as the oral cilia or cytoskeletal structures.
ACKNOWLEDGEMENTS
We thank Prof. Kohei Hatta (University of Hyogo) for assistance with the high-speed imaging and Mr. Takuya Ohmura (Kyoto University), Dr. Jack Sunter (Oxford Brookes University), Prof. Keith Gull (University of Oxford), Dr. Shigenori Nonaka and Dr. Atsushi Taniguchi (NIBB) for their helpful comments. This work was partially supported by NIBB Collaborative Research Program (17-503) to S. S. and JSPS KAKENHI Grant Numbers JP25103012, JP26707020, and JP17J06827.
REFERENCES
- Amos, W. B. (1972) Structure and coiling of the stalk in the peritrich ciliates Vorticella and Carchesium. J. Cell Sci., 10, 95–122.
- Arganda-Carreras, I., Fernández-Gonzáles, R., Muñoz-Barrutia, A. and Ortiz-De-Solorzano, C. (2010) 3D reconstruction of histological sections: Application to mammary gland tissue. Microsc. Res. Tech., 73, 1019–1029. doi: 10.1002/jemt.20829.
- Bausch, A. R., Ziemann, F., Boulbitch, A. A., Jacobson, K. and Sackmann, E. (1998) Local measurements of viscoelastic parameters of adherent cell surfaces by magnetic bead microrheometry. Biophys. J., 75, 2038–2049. doi: 10.1016/S0006-3495(98)77646-5.
- Bohatier, J. (1970) Structure et ultrastructure de Lacrymaria olor (O. F. M. 1786). Protistologica (Paris), 6, 331.
- Despósito, M. A. and Viñales, A. D. (2009) Subdiffusive behavior in a trapping potential: Mean square displacement and velocity autocorrelation function. Phys. Rev. E Stat. Nonlin. Soft Matter Phys., 80, 1–7. doi: 10.1103/PhysRevE.80.021111.
- Didier, P. and Bohatier, J. (1970) Structures microfibirillaires chez le Cilié Lacrymaria olor (O. F. Müller). C. R. Soc. Biol., 164, 317–319.
- El-Haddad, H., Przyborski, J. M., Kraft, L. G. K., McFadden, G. I., Waller, R. F. and Gould, S. B. (2013) Characterization of TtALV2, an essential charged repeat motif protein of the Tetrahymena thermophila membrane skeleton. Eukaryot. Cell, 12, 932–940. doi: 10.1128/EC.00050-13.
- Evans, E. A. (1983) Bending elastic modulus of red blood cell membrane derived from buckling instability in micropipet aspiration tests. Biophys. J., 43, 27–30. doi: 10.1016/S0006-3495(83)84319-7.
- Huang, B. and Pitelka, D. R. (1973) The contractile process in the ciliate, Stentor coeruleus. J. Cell Biol., 57, 704–728.
- Karcher, H., Lammerding, J., Huang, H., Lee, R. T., Kamm, R. D. and Kaazempur-Mofrad, M. R. (2003) A three-dimensional viscoelastic model for cell deformation with experimental verification. Biophys. J., 85, 3336–3349.
- Kink, J. (1972) Observation on morphology and oral morphogenesis during regeneration of ciliate Lacrymaria olor (O. F. M. 1786). Acta Protozool., 10, 205–213.
- Kinoshita, T., Murakami, A. and Yasuda, M. (1965) Interval between membrane potential change and ciliary reversal in Pramecium immersed in Ba–Ca mixture. J. Fac. Sci. Univ. Tokyo Sect. IV Zool., 10, 421–425.
- Kirby, R. J., Qi, F., Phatak, S., Smith, L. H. and Malany, S. (2016) Assessment of drug-induced arrhythmic risk using limit cycle and autocorrelation analysis of huma iPSC-cardiomyocte contractility. Toxicol. Appl. Pharmacol., 305, 250–258. doi: 10.1016/j.taap.2016.06.025.
- Krauss, G., Lohss, S., Hanke, T., Sell, A., Eggert, S., Huber, R. and Leitenstorfer, A. (2010) Synthesis of a single cycle of light with compact erbium-doped fibre technology. Nat. Photonics, 4, 33–36. doi: 10.1038/nphoton.2009.258.
- Li, L., Nørrelykke, S. F. and Cox, E. C. (2008) Persistent cell motion in the absence of external signals: A search strategy for eukaryotic cells. PLoS ONE, 3, e2093. doi: 10.1371/journal.pone.0002093.
- Mast, S. O. (1911) Habits and reactions of the ciliate, Lacrymaria. J. Anim. Behav., 1, 229–243.
- Morrison, F. A. (2001) Understanding Rheology. Oxford University Press, Oxford.
- Nishigami, Y., Ito, H., Sonobe, S. and Ichikawa, M. (2016) Non-periodic oscillatory deformation of an actomyosin microdroplet encapsulated within a lipid interface. Sci. Rep., 6, 18964. doi: 10.1038/srep18964.
- Satin, J., Kehat, I., Caspi, O., Huber, I., Arbel, G., Itzhaki, I., Magyar, J., Schroder, E. A., Perlman, I. and Gepstein, L. (2004) Mechanism of spontaneous excitability in human embryonic stem cell derived cardiomyocytes. J. Physiol., 559, 479–496. doi: 10.1113/jphysiol.2004.068213.
- Schindelin, J., Arganda-Carreras, I., Frise, E., Kaynig, V., Longair, M., Pietzsch, T., Rueden, C., Saalfeld, S., Schmid, B., Tinevez, J. Y., et al. (2012) Fiji: An open source platform for biological image analysis. Nat. Methods, 9, 676–682. doi: 10.1038/nmeth.2019.Fiji.
- Tatchell, E. C. (1980) An ultrastructural study of extension and contraction in Lacrymaria olor (O. F. Muller). Protistologica (Paris), 16, 167–175.
- Tatchell, E. C. (1981) An ultrastructural study of prey capture and ingestion in Lacrymaria olor (O. F. M. 1786). Protistologica (Paris), 17, 59–66.
- Vd’ačný, P., Bourland, A. W., Orsi, W., Epstein, S. S. and Foissner, W. (2011) Phylogeny and classification of the Litostomatea (Protista, Ciliophora), with emphasis on free-living taxa and the 18S rRNA gene. Mol. Phylogenet. Evol., 59, 510–522. doi: 10.1016/j.ympev.2011.02.016.
- Yamada, S., Wirtz, D. and Kuo, S. C. (2000) Mechanics of living cells measured by laser tracking microrheology. Biophys. J., 78, 1736–1747. doi: 10.1016/S0006-3495(00)76725-7.