Initiatives in Dili of Timor-Leste for implementing traffic management using digital twin-BIM technology
2024 Volume 5 Issue 1 Pages 42-56
Details
2024 Volume 5 Issue 1 Pages 42-56
Dili, the capital of Timor-Leste, is facing the environmental and economic impacts of increasing urbanization, including traffic congestion, and a deteriorating atmospheric environment. To solve these situations, an evidence-based traffic management policy (EBTMP) based on a digital twin (DT) technology that combines geographical information and construction information modeling (BIM) is essential. This research successfully identified traffic patterns, delays, congestion hotspots, and air pol-lutants such as CO2, NOx, and PM10 in the target zone the so-called Cathedral zone. Motorcycles were found to be an important contributor to air pollution due to their widespread use. Therefore, it is important to reduce motorcycle users in the future to reduce air pollution. Besides, the most important thing is to take action to provide good public transportation facilities and infrastructure to reduce private transportation users. By doing this, Dili’s urban mobility will be improved.
As urban populations grow, the confluence of transportation and environmental issues increasingly impacts economies and livelihoods. Urban growth has a significant impact on traffic dynamics, congestion, and air pollution. Global factors such as economic shifts, evolving transportation infrastructure, and the rise of ridesharing and delivery services further complicate these challenges1),2).
Research on the economic impact of traffic congestion in U.S. metropolitan areas highlights its negative impact on job growth and productivity, underscoring the need to prioritize economically important trips or increase travel capacity3). In addition, the effectiveness of traffic management strategies (TMS) on urban air quality and pollution-related health outcomes has been studied and shows limited evidence to support emission reduction schemes such as urban road pricing and low emission zones (LEZs)4). Therefore, the effective traffic management is emerging as a critical global policy concern, crucial to avert economic losses due to lost productivity and increased air pollution from increased emissions5).
To address these challenges, innovative traffic management systems are needed, especially those that utilize Digital Twin (DT) technology. DT can analyze and visualize queue lengths and traffic flows and assess how the installation or removal of various traffic signs affects the traffic system, thereby facilitating traffic flow optimization and environmental impact assessment. DT can also be integrated with various image sensors to simulate traffic based on real-time data, predict the occurrence of traffic congestion, and reduce congestion by controlling traffic signals. By enabling the assessment of traffic conditions, DT is expected to provide quantitative insights for evidence-based traffic management policies (EBTMP) 6),7),8),9).
The Dili metropolitan area, the capital of Timor-Leste, has suffered from uncontrolled urbanization, traffic congestion, and environmental problems that have hampered economic activities due to the lack of comprehensive measures to address urban issues, in addition to the lack of social infrastructure due to rapid population growth. JICA is supporting the preparation of a comprehensive urban development master plan to address these issues in the Dili metropolitan area and is working to contribute to the formation and growth of a sustainable city with industrial vitality10).
This study aims to provide an alternative solution to the challenges of traffic management in the city of Dili through the application of digital twin technology. By using actual traffic volume data to assess traffic dynamics, bottlenecks, and emissions, the digital twin BIM technology accurately simulates peak hours, congestion, delays, and pollutants such as CO2, NOx, and PM10. As a result, digital twin - BIM technology can provide a reliable solution to the traffic challenges in Dili City, Timor-Leste.
(1) Digital twin for traffic management
Digital Twin is increasingly being used in traffic management to replicate the physical traffic network into a digital model. The Digital Twin combines real-time traffic data for simulation in order to provide a holistic understanding of traffic dynamics, enabling better decision making). The vast potential of information technology in the field of road transportation allows for the real-time integration of digital and physical road systems for traffic modeling and analysis11),12),13). This kind of integration is commonly known as the Digital Twin (DT) concept, which considers the merging of the virtual (digital) and the real world14). As such, DT applications provide viable solutions to the issue of the increasing complexity of transportation systems and the idea of tracking them throughout their lifecycle.
In the early stages of design, construction, reconstruction, traffic planning or control, and numerous other analysis purposes, real-time bi-directional interaction between the physical system and corresponding digital replicas is made possible by a continuously synchronized DT model with its physical counterpart. As a result, DT has demonstrated great promise in a number of domains and is attracting considerable attention from industry and academia15). For example, some researchers are exploring the use of digital twins in transportation, with a particular focus on the real-time synergy of simulation and traffic data streams to visualize motorway dynamics16). Where they used the Geneva Highway Digital Twin Model (DT-GM) to integrate real-time data into microscopic roadway simulations, introducing a new paradigm. The DT-GM integrates highly refined real-world traffic data through constant synchronization and calibration with the SUMO simulator, allowing simulation-based control optimization to occur while the system is in operation. Therefore, digital twins are increasingly used in traffic management to build virtual replicas of real traffic networks17), 18). With the help of these digital twins, which integrate simulation and real-time traffic data, traffic dynamics can be fully understood, allowing for improved control and decision-making. By modeling and predicting traffic conditions, they can be used to optimize cities by facilitating adjustments to traffic signals, route planning, and resource allocation. Therefore, in this study, a digital twin is used to simulate traffic management in the city of Dili, particularly in the Cathedral Zone, to provide evidence-based traffic management for decision making.
(2) BIM for traffic management
Building Information Modeling (BIM) is increasingly being used in traffic management and transportation infrastructure, providing benefits to the various stakeholders involved in the decision-making process. In civil engineering, BIM serves as a digital management system that facilitates collaborative working techniques to create, maintain, and use data and information about transportation assets throughout their lifecycle19), 20). The benefits that BIM brings to the following stakeholders include:
* Urban Planners: BIM assists urban planners analyze transportation systems and improve road design. By integrating urban traffic data, land use data, and traffic management information, BIM promotes a more efficient decision-making process related to transportation infrastructure development and urban planning.
* Transportation Engineers: BIM enables transportation engineers to create engineering-level models of transportation infrastructure to facilitate transportation system analysis, simulation, and design optimization. By providing a digital representation of the transportation network, BIM helps transportation engineers identify bottlenecks, optimize traffic flow, and evaluate the effectiveness of traffic management strategies.
* Policy Makers: BIM contributes to evidence-based decision-making for policymakers involved in traffic management and urban development. By integrating real-time traffic data and simulation technology, BIM enables policymakers to assess the impact of proposed traffic management policies and infrastructure projects before they are implemented. This enables informed decision-making and the development of effective strategies to address traffic congestion and environmental issues.
* City Administrator: BIM assists city administrators manage transportation assets and optimize urban mobility. By providing a digital twin of the urban transportation network, BIM facilitates real-time monitoring, analysis, and optimization of traffic flows. Municipalities can use BIM to make data-driven decisions to increase transportation efficiency, improve road safety, and reduce environmental impact.
As a result, BIM helps improve the decision-making process for city planners, transportation engineers, policy makers, and city administrators involved in traffic management and urban development initiatives.
This study focuses on the traffic problems in the city of Dili, the capital of Timor Leste, specifically in the Cathedral Zone as shown in Fig. 1. In this area, chronic traffic delays and congestion occur throughout the day, especially during peak hours. This reduces urban mobility and increases economic losses and air pollution. To address these challenges, it is imperative to implement Digital Twin BIM technology to help optimize traffic management.

Dili, the capital of Timor-Leste, is the country’s economic, administrative, and educational center. Since independence from Indonesia in 2002, the city has played a prominent role in the country’s affairs and has experienced rapid and sustained population growth. According to "Timor-Leste’s 2022 Population and Housing Census", Dili’s population reached 324,269 out of a total national population of 1,340,434, or 24.2% of the total population. Despite its relatively small area of 14,954 square kilometers, Dili has a population density of about 90 people per square kilometer21).
The concentration of the population in urban areas, particularly in Dili, has increased significantly in recent years. This trend is clearly visible in Fig. 2, a satellite image of Dili, which highlights the limited land in the city as a center of urbanization. Dili’s population density is extremely high at 1,177 people per square kilometer, a figure well above the national average for Timor-Leste.

As previously stated, traffic congestion not only decreases transportation mobility but also logistics productivity, economic losses, and even increases air pollution. Therefore, it is expected that the introduction of digital twin technology enables to optimize traffic management and it results in the economic growth and the decrease of the air pollution.
The development of a Digital Twin - Building Information Modeling (DT-BIM) workflow for traffic management is an important aspect of this research. Digital Twin technology involves the creation of a virtual replica of a physical system or process, enabling simulation, analysis, and optimization. Building Information Modeling (BIM), on the other hand, is a digital representation of the physical and functional characteristics of a building or infrastructure element. The integration of digital twin and BIM technologies provides a comprehensive approach to traffic management, enabling detailed simulation, analysis, and decision making. The workflow shown in Fig. 3 outlines the steps involved in developing a DT-BIM workflow for traffic management:
* Data collection (traffic counting and geometric data)

* Evaluate Average Daily Traffic (ADT)
* Evaluate the Origin-Destination matrix (OD)
* Create a base model for Digital Twin.
* Verification of the DT model
* Calibration of the DT model
* Validation of the DT model
* Traffic demand and parameters input
* Simulation of and analysis
(1) Data collection
A comprehensive traffic data collection has been initiated by a team of students from the Department of Civil Engineering of the National University of Timor-Leste. The study period was set for one week, from September 3 to 9, 2020, to study representative traffic volumes in the city of Dili. Comprehensive data collection was conducted by a team of students from the Department of Civil Engineering of the National University of Timor-Leste. Focusing on the Cathedral Zone, the downtown area of Dili, the team diligently collected important information, including traffic and geometric data. The goal of this effort was to obtain traffic data that could be used to evaluate the traffic management system in Dili, particularly in the Cathedral Zone.
Traffic data
Traffic data was collected by conducting traffic counts, focusing on the Cathedral Zone. The counting period covered seven days, starting at 7 a.m. and ending at 6 p.m., as depicted in Fig. 4. The reason why traffic counts were only conducted during the day was because traffic is usually very low at night.
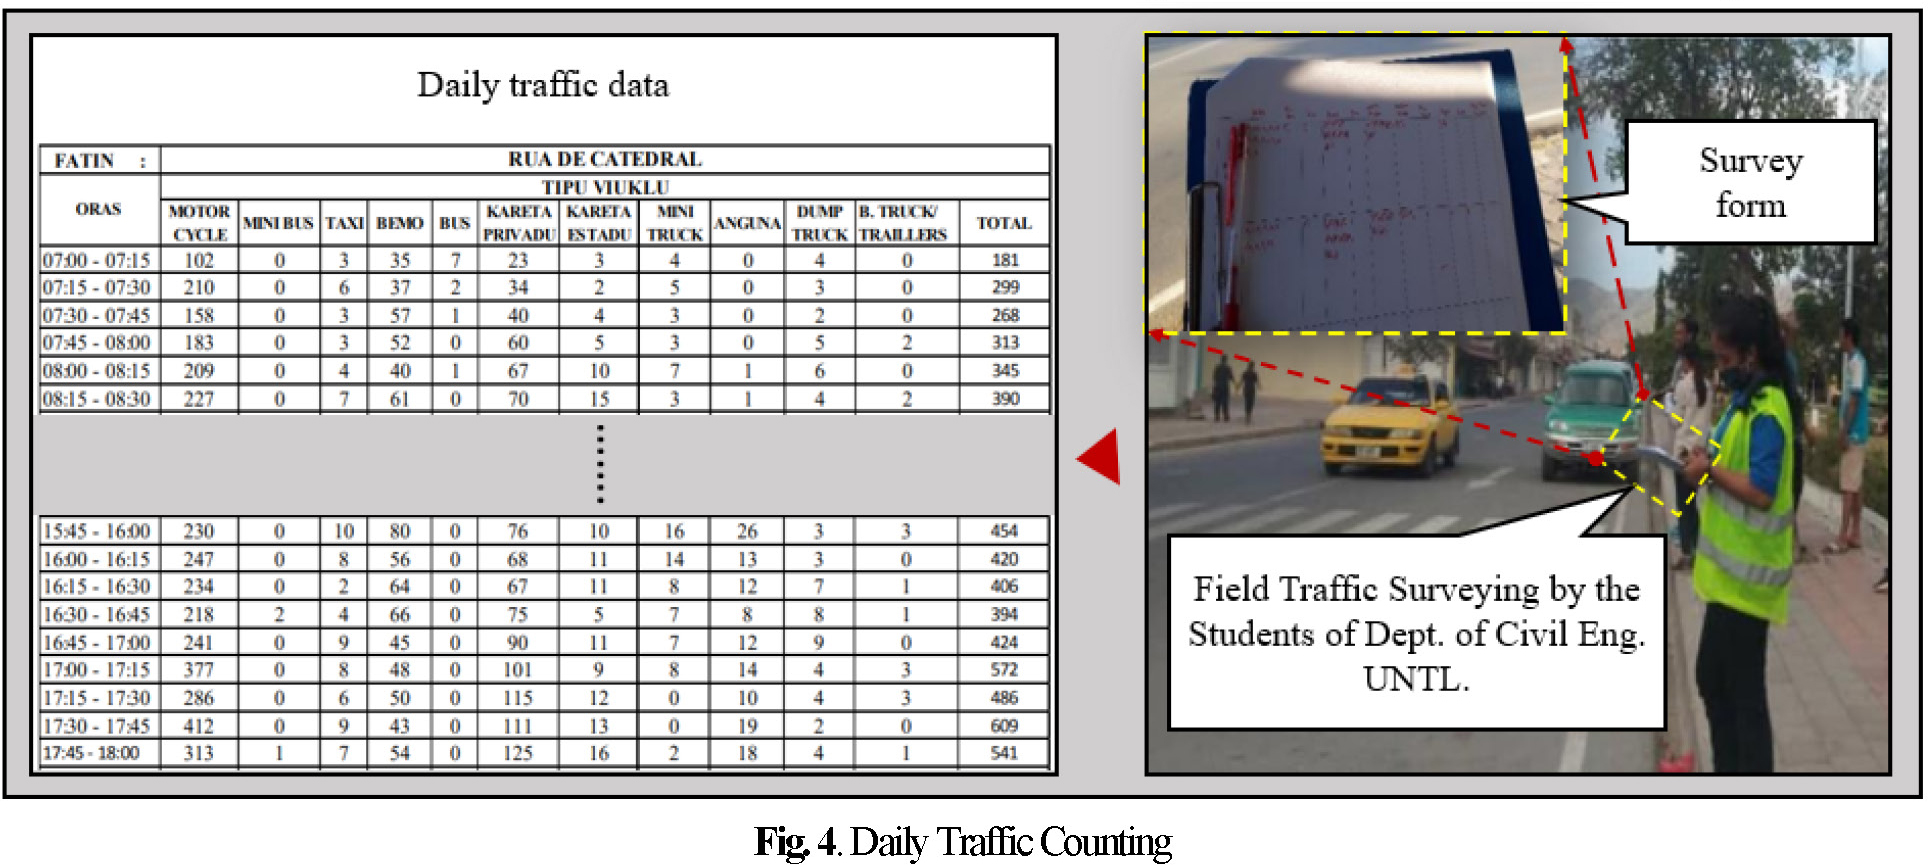
Traffic data sets were collected at 15-minute intervals for various types of vehicles commonly used in Dili, including motorcycles, minibuses, taxis, small mini-busses, buses, private cars, government cars, mini-trucks, anguna, dump trucks, and trailers. A comprehensive dataset was obtained fromten different road segments, namely Av. Villa Verde, Rua de Caju Laran, Rua de Tuana Laran, Av. 20 de Maio, Rua de Cathedral 1, Av. D. Ricardo da Silva 1, Av. D. Ricardo da Silva 2, Beco Hermanina, Av. de Colmera, and Rua de Cathedral 2, as shown in Fig. 5. Subsequently, this dataset was used to calculate the Average Daily Traffic (ADT) and determine the peak hour for each road segment.

Geometric data
Furthermore, geometric data for road segments in the Cathedral zone was collected to fully comprehend the issue of traffic flow in that zone, as illustrated in Table 1. This includes the following information presented in columns: (1) the number of road segments, (2) road segment names, (3) road types, and (4) road widths. This information is essential as the foundation for creating a base model of Digital Twin.

(2) Average daily traffic (ADT)
Once traffic data has been collected, the next task is to calculate Average Daily Traffic (ADT), a crucial step in determining peak traffic periods. ADT, also known as average daily traffic, is the average number of vehicles that pass-through a given roadway location over a brief period, usually seven days or less. It is obtained by dividing the total daily volume for a given period by the number of days in that period, as shown in Eq. 1.
;%0A%09%09%09newWindow.document.open();%0A%09%09%09newWindow.document.write('<img src=%22./Graphics/5.1_42_030.jpg%22>');%0A%09%09%09newWindow.document.close();%0A%09%09)
Where
VOLi : daily volume in the ith day, n : the number of whole days over the observation period.
In this study, Table 2 presents the Average Daily Traffic (ADT) data, with the following information arranged in columns: (1) number of vehicle types operating in the downtown Dili, (2) vehicle types and names, (3) vehicle categories, and (4) average daily traffic for different vehicle types on the 10 road segments within the designated target zones. These ADT data will be used for traffic simulation and traffic management analysis.

(3) Peak hour volume (PHV)
PHV represents the maximum number of vehicles passing a point in both directions in one hour. The equation for PHV is shown in Eq.2.
;%0A%09%09%09newWindow.document.open();%0A%09%09%09newWindow.document.write('<img src=%22./Graphics/5.1_42_031.jpg%22>');%0A%09%09%09newWindow.document.close();%0A%09%09)
Where:
* PHV is the Peak Hour Volume
* MHV is the Maximum Hourly Volume. It is the highest number of vehicles passing the point in both directions during any one-hour period.
* DS is a Directional Split. It is the number of traffic moving in a specific direction during the peak hour.
Fig. 6 illustrates the peak hour volume in the Cathedral Zone of the city of Dili, which serves as the target area for our research. In addition, we have highlighted three peak hours: morning peak hour (08:00~09:00), afternoon peak hour (12:00~13:00), and evening peak hour (17:00~18:00), which can be used in DT-BIM for simulation and analysis. Table 3 shows the selected detailed peak hour data from Fig. 6, which includes the following columns: (1) traffic sources from ten road segments in the research target zone, (2) traffic volume from each road segment for the morning peak hour, (3) traffic volume for the afternoon peak hour, and (4) traffic volume for the evening peak hour.


(4) Origin - Destination (OD) matrix.
An Origin-Destination (OD) matrix is a key method in transportation planning and management. It shows the flow of trips within a transportation network between different origin-destination pairs. The matrix represents the movement of vehicles from an origin to a destination in each zone.
The OD matrix is commonly used to study travel patterns, identify congestion hotspots, plan transportation infrastructure improvements, and optimize traffic management systems.
The general form of an OD matrix is a square matrix with rows representing origins, columns representing destinations, and cells representing the number of trips. The following mathematical formulas can be used to calculate an Origin-Destination (OD) matrix, as shown in Eq.3.
;%0A%09%09%09newWindow.document.open();%0A%09%09%09newWindow.document.write('<img src=%22./Graphics/5.1_42_032.jpg%22>');%0A%09%09%09newWindow.document.close();%0A%09%09)
Where:Tij : represents the number of trips from origin i to destination j
i : ranges from 1 to n for origins
j : ranges from 1 to n for destinations
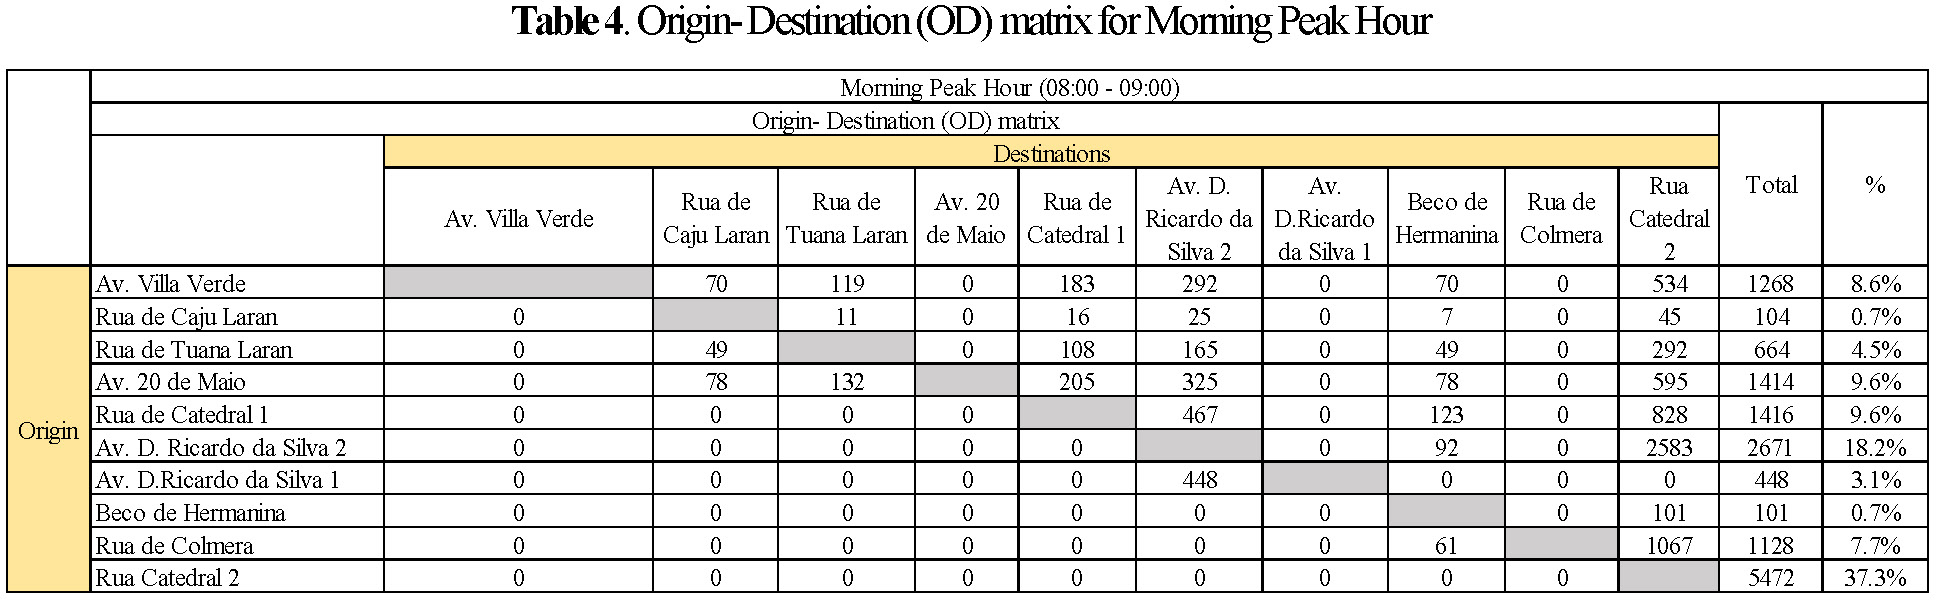
In this study, three Origin-Destination (OD) matrices are presented in Tables 4, 5, and 6, corresponding to different peak hours that can later be input into the DT-BIM model. Table 4 outlines the OD matrix for the morning peak hour, which spans from 08:00 to 09:00. Table 5 provides insight into the afternoon peak hour, covering the period from 12:00 to 13:00. Finally, Table 6 shows the OD matrix for the evening peak hour, extending from 17:00 to 18:00. In addition, the data collected to determine the number of trips from origin-destination was difficult to obtain in the field. Therefore, the percentage of traffic for each roadway segment was used to determine the OD matrix as shown in Tables 4, 5, and 6. In addition, as shown in the OD tables, some rows contain zeros. This indicates that, due to the characteristics of the roadway, vehicles did not reach those destinations. For example, the section of Av. Villa Verde is a one-way road, while Av. D. Ricardo da Silva 2 has two lanes and two directions (2/2). Thus, these matrices serve as the basis for simulations and analyses aimed at evaluating traffic issues and environmental impacts. They have played a crucial role in the development of an Evidence-Based Traffic Management Policy (EBTMP).


(5) Create a base model DT
The Digital Twin (DT) model plays an important role in traffic simulation, particularly within the Cathedral Zone in the city of Dili, Timor-Leste. By carefully replicating the actual conditions of the road and its components, using advanced Building Information Modeling tools, this process ensures accurate simulations. The application goes beyond modeling, by providing a comprehensive view of traffic congestion and environmental implications within the Cathedral Zone. The result of the digital twin model is depicted in Fig. 7. In addition, the DT model not only provides good simulation results but also makes a significant contribution to Evidence-Based Traffic Management Policy (EBTMP). The integration of traffic management principles into the Digital Twin framework does not stop at simulation but actively contributes to the improvement of traffic management practices. The insights gained from this approach provide a foundation for informed decision making, promoting sustainable and efficient urban mobility solutions that are tailored to the dynamic complexity of the target research zone and its surroundings.

(6) Calibration and Verification of the DT model
Once the DT model is created in the BIM tools, it is important to calibrate and validate the model itself to be similar to the real condition for each road section in the Cathedral Zone as shown in Fig. 8. This zone contained 10 road sections with each type as elaborated below:

* Av. Villa Verde: 2 lanes, 1 direction
* Rua Caju Laran: 2 lanes, 2 directions
* Rua de Tuana Laran: 2 lannes, 2 directions
* Avenida 20 de maio: 2 lanes, 2 directions
* Rua de Cathedral: 2 lanes, 1 direction
* Avenida D.Ricardo da Silva 2: 2 lanes , 2 directions
* Avenida D. Ricardo da Silva 1: 2 lanes, 1 direction
* Beco de Hermanina: 2 lanes, 2 directions
* Rua de Colmera: 2 lanes, 1 direction
* Ru de Cathedral 2 ( Rotunda Mandarin): 2 lanes, 1 direction.
Thus, by calibrating and verifying the DT model according to real-world conditions, later simulation and analysis results can be achieved accurately.
(7) Traffic demand and parameters input
Traffic demand refers to the number of vehicles seeking to travel, expressed as several vehicle trips in the traffic simulation tool22). Therefore, inputting actual traffic in the form of OD matrix data into the BIM tool becomes an essential step in the traffic simulation process. Subsequently, it is crucial to input and configure parameters, including intersections, traffic lights, and signalization, as shown in Fig. 1, 11, and 12, respectively. The primary goal of this data entry and parameter setting is to create a realistic traffic simulation model. This model facilitates optimal traffic outcomes and allows for easy identification of congestion points and environmental impacts in the surrounding area. Accurate simulations are essential for producing meaningful results that are essential for developing an Evidence-Based Traffic Management Policy (EBTMP) that effectively informs the decision-making process. This comprehensive approach ensures a solid foundation for urban planning, promoting sustainable solutions and informed policies to improve traffic management.


(1) Simulation theory
Car following models are theoretical frameworks used to describe and predict the behavior of individual vehicles as they travel in traffic and follow other vehicles on the road18),23). These models are essential in traffic engineering and transportation planning to understand how traffic flows arise and develop strategies to improve traffic efficiency and safety. The basic idea behind car following models is to represent the driver’s behavior in relation to the vehicle in front of him. These models usually consider factors such as vehicle speed, distance to the previous vehicle, acceleration, deceleration, driver reaction time, and other relevant variables.
Thus, traffic simulation in BIM tools is used in microscopic traffic models, which simulate individual vehicles and their interactions in the traffic flow. The BIM tools for traffic simulation contain three car-following models: Gipps, Wiedemann, and Fritzsche’s models. Both the Wiedemann and Fritzsche’s models are psycho-physical models where the driver is assumed to change his behavior at certain thresholds as shown in Fig. 13.

The Wiedemann car-following model was first introduced in 1974 and has been continuously refined ever since18),23),24),25),26). This model consists of five different driving states as follows:
* Free Driving: The driver maintains the desired speed.
* Following: The driver follows the lead vehicle, unconsciously accelerating and decelerating.
* Approaching: The driver’s speed adapts to the lower speed of the lead vehicle. Deceleration continues until the speed difference is zero, i.e. the driver has reached his desired safety distance.
* Breaking: If the desired safety distance is significantly reduced, for example, if the lead vehicle abruptly changes speed, the driver decelerates noticeably.
* Emergency: High deceleration is applied to avoid a collision with the vehicle in front.
Subsequently, the car following model develop by Fritzche in 1994 also consists of five different driving states as follows:
* Danger: The driver uses maximum deceleration to increase the distance to the leading vehicle because the distance between the vehicles is perceived to be too small.
* Closing in: The driver decelerates to match the speed of the lead vehicle when the headway equals the safe gap distance.
* Following 1: The driver takes no conscious action.
* Following 2: The driver notices that he is closing on the lead vehicle but takes no action due to the large gap.
* Free driving: The follower accelerates to achieve the desired speed. The driver’s inability to maintain a constant speed is modeled with a parameter.
These models track the movement and behavior of each vehicle separately, considering factors such as acceleration, deceleration, lane changes, and interactions with other vehicles. The Gipps model is one of the microscopic models commonly used in traffic simulation. The Gipps model, developed by Michael Gipps, describes the acceleration behavior of each vehicle as a function of the desired speed, the speed of the surrounding vehicles, and the distance to the vehicle ahead. The model aims to capture driver’s behavior in a more realistic way by considering factors such as driver anticipation and reaction time. In contrast, the Wiedemann and Fritzsche models are more often associated with mesoscopic or macroscopic approaches to traffic modeling. Mesoscopic models consider traffic flow at an intermediate level, focusing on groups of vehicles or road sections, while macroscopic models analyze traffic flow at a broader level, often using aggregate variables such as traffic density and traffic speed.
So, in this study, the microscopic traffic simulation model based on the Gipps is adopted.
(2) Results of simulation and analysis
After conducting simulations and analyses for the Cathedral Zone using peak-hour data, including the morning peak (08:00-09:00), afternoon peak (12:00-13:00), and evening peak (17:00-18:00), the traffic simulation was performed using a digital twin model based on Building Information Modeling tools, as depicted in Fig. 14. Further details of the morning peak results are illustrated in Fig. 15, and the assessment status is presented in Table 7. The traffic assessment showed that of the ten road segments within the target zone during the morning peak, eight segments were congested while only two were uncongested.
In addition, the afternoon peak hour simulation, as depicted in Fig. 16 and detailed in Table 8, indicated that nine road segment s were congested, with one segment remaining uncongested. Finally, the evening peak hour simulation in Fig. 17 and Table 9 showed that seven road segments were congested, while three were uncongested. Thus, the simulation and analysis results clearly indicate a serious traffic problem in the study area. This information is crucial for decision makers as evidence to support the development of a future Evidence-Based Traffic Management Policy (EBTMP) in Dili City Timor-Leste.


(2) Assessing the environmental impact due to traffic cong estion
Assessing the environmental impact due the traffic congestion involves evaluating the emissions of pollutants such as CO2, NOx, and PM10. These pollutants significantly contribute to air pollution, which affects public health and environmental quality. Utilizing Digital Twin Building Information Modeling (DT-BIM) technology, this assessment can be conducted by integrating traffic data and emission models. By visualizing traffic patterns and pollutant dispersion, decision-makers can be informed to take appropriate actions. The equations for estimating emissions are shown in Eq.4, Eq.5, and Eq.6, respectively.
Carbon dioxide (CO2):
;%0A%09%09%09newWindow.document.open();%0A%09%09%09newWindow.document.write('<img src=%22./Graphics/5.1_42_033.jpg%22>');%0A%09%09%09newWindow.document.close();%0A%09%09)
Where:
ECO2 : Total CO2 emissions (in parts per million)
EFCO2 : CO2 emission Factor (in grams per kilometer or per vehicle-mile traveled)
VMT : Vehicle miles traveled (in kilometers)
Vair : Volume of air (in cubic meters)
Nitrogen Oxides (NOx):
;%0A%09%09%09newWindow.document.open();%0A%09%09%09newWindow.document.write('<img src=%22./Graphics/5.1_42_034.jpg%22>');%0A%09%09%09newWindow.document.close();%0A%09%09)
Where:
ENOx : Total NOx emissions (in parts per million)
EFNOx : NOx emission factor (in grams per kilometer or per vehicle-mile traveled)
VMT : Vehicle miles traveled (in kilometers)
Particulate Matter (PM10):
;%0A%09%09%09newWindow.document.open();%0A%09%09%09newWindow.document.write('<img src=%22./Graphics/5.1_42_035.jpg%22>');%0A%09%09%09newWindow.document.close();%0A%09%09)
Where:
EPM10 : Total emissions (in parts per million)
EFPM10 : PM10 emission factor (in grams per kilometer or per vehicle-mile traveled)
VMT : Vehicle miles traveled (in kilometers)
By applying DT-BIM, the environmental impact due to traffic congestion was effectively evaluated through simulation and analysis in the digital twin BIM framework, as shown in Table 10 and depicted in Fig. 18, 19, and 20, respectively. The results indicate an increase in vehicle emissions, such as CO2, NOx, and PM10, caused by congestion and delays. In particular, motorcycles emerge as a major source of these emissions due to their higher usage compared to other types of vehicles.
Therefore, reducing the number of motorcycle users in the future is crucial to reducing air pollution. However, the most important aspect is to establish a plan that aims to improve public transportation facilities and infrastructure to discourage the use of private transportation. Thus, congestion and air pollution can be effectively reduced.


The initiative to implement Transportation Management using Digital Twin-BIM Technology in Dili, Timor-Leste, is a significant step towards addressing the growing traffic challenges in the city. Through the integration of Building Information Modeling (BIM) and Digital Twin (DT), this approach has successfully identified and analyzed traffic patterns, congestion points, and environmental impacts in the target study zone, particularly in the Cathedral area.
The Digital Twin model, built with advanced BIM tools, provides a realistic simulation environment to evaluate traffic dynamics and assess environmental implications. Evidence-based traffic management policies (EBTMP) derived from real traffic data in this framework offer a comprehensive solution to reduce congestion and improve urban mobility in Dili city.
The simulation results and traffic analysis highlighted severe congestion during peak hours, emphasizing the need for effective management policies. In addition, the environmental impact assessment of traffic congestion, particularly CO2, NOx, and PM10 emissions, underscores the importance of reducing motorcycle use and improving public transportation infrastructure.
Traffic congestion releases toxic gases such as CO2, NOx, and PM10 into the atmosphere, posing a serious risk to public health and contributing to climate change. The environmental impacts associated with increased motorcycle use are significantly greater than emissions from other vehicles, particularly since motorcycles serve as the primary mode of transportation for many people in Timor-Leste. To alleviate traffic congestion and reduce environmental pollution, it is essential to develop appropriate public transportation and road infrastructure.
Future work for this initiative envisions expanding the scope to cover the entire City of Dili. Integrating Artificial Intelligence (AI) and IoT can lead to a more sophisticated and adaptive traffic management system, optimizing mobility and urban sustainability. Continuous research and technological advances are essential to develop an efficient and data-driven traffic management model that can serve as a blueprint for Timor-Leste and beyond.
This study acknowledges the contributions of civil engineering students from the National University of East Timor in data collection and traffic surveys and appreciates their diligent efforts.