Abstract
This study presents a novel method for evaluating the stripping ratio of road lane markings using a two-step deep learning-based semantic segmentation approach. In the first step, a segmentation model identifies the lane area on the road under various conditions. The second step involves using a deep learning-based segmentation model, which processes the collected training data and annotates it using a multi-section binarization method with various data augmentation strategies to distinguish between stripping and non-stripping areas within the lane markings. Unlike traditional methods that rely heavily on manual inspection or low-robustness image processing techniques, this approach leverages smartphone cameras mounted on moving vehicles to capture and automatically analyze the stripping ratio of lane markings with high accuracy across entire road segments. The results demonstrate a high correlation (R² = 0.9827) with manual evaluations, highlighting the potential of this technique to significantly reduce labor-intensive assessments. The efficiency and effectiveness of this method could revolutionize road maintenance by providing reliable, rapid, and cost-effective assessments of road markings.
1. INTRODUCTION
Inspecting road conditions is critical for ensuring public safety. In Japan, the total length of roads has been consistently increasing, surpassing 1.28 million kilometers as of 20221). Road construction costs peaked around 1998, and since then, there has been a significant and growing need for the maintenance of road conditions. However, the aging population and declining birth rates in Japanese society have led to a decrease in the number of civil engineers available for infrastructure construction2).
Road markings, including lane markings and regulatory signs, are essential for ensuring safe and smooth traffic flow on roads by providing critical navigational information. Lane markings are particularly vital as they clearly delineate driving boundaries, aiding drivers in maintaining proper lane discipline and thus enhancing road safety. However, research shows that road markings degrade over time due to exposure to ultraviolet sunlight, adverse weather conditions, and physical wear from vehicles and pedestrians, typically within 9 to 12 months3). This degradation reduces their visibility and diminishes their effectiveness in guiding drivers’ sightlines. Even in autonomous driving, studies indicate that clearer lane markings are associated with higher recognition rates by vehicle sensors, whereas lanes with significant stripping have lower detection rates, underscoring the importance of well-maintained road lane markings for the effectiveness of autonomous vehicle technologies4). In snowy regions, road lane markings often strip significantly during winter due to frequent snow removal operations by snowplows and wear from vehicles, such as buses and trucks, using tire chains. This highlights the challenges of maintaining road visibility under harsh winter conditions5).
To standardize the maintenance of road markings, the Japan Contractors Association of Traffic Signs and Lane Markings has implemented a visual evaluation system with ranks ranging from 1 to 56). Studies have shown that the functionality of road markings significantly declines as visual evaluation ranks decrease, with critical deterioration observed at rank 3. At this stage, retroreflected luminance values fall below the thresholds necessary for safe nighttime vehicle navigation. Therefore, it is essential to repaint road markings once they degrade to visual evaluation rank 3 to ensure both navigational safety and operational effectiveness.
The visual evaluation ranks are assessed using specific measurement methods, which currently include the stripping ratio, retroreflected luminance values, and diffuse reflectance values7). Among these, the stripping ratio can be determined from images, whereas measuring retroreflected luminance and diffuse reflectance values requires specialized equipment. These metrics exhibit a high degree of correlation, showing that they collectively provide a comprehensive assessment of road lane marking conditions. The stripping ratio is considered the most desirable criterion for evaluations aimed at minimizing labor, as it allows for an efficient and straightforward assessment of road marking conditions.
2. RELATED WORKS
The correlation between visual rank, reflectance, and stripping ratio has been demonstrated in previous studies3), resulting in a repaint being necessary when the visual rank reaches 3. However, assessing visual rank and reflectance requires significant manual labor or specialized equipment, which is unsuitable for large-scale, low-cost inspections. Therefore, this paper focuses on previous studies that have explored photo collection and analysis using cameras.
In the process of calculating the stripping ratio for road lane markings, the procedure begins with capturing images of the road surface. These images are used to segment the specific locations of the lane markings. The areas within these segments are classified as damaged or undamaged. The stripping ratio is then determined by comparing the area of the damaged portions to the total area of the lane markings, or by extrapolating the results from these measurements. This approach allows for a quantifiable assessment of the lane markings’ condition.
In 2011, Aseda et al.8) developed an image-based method to calculate the stripping rate of road surfaces at 20-meter intervals. They mounted an SLR digital camera inside a vehicle and used a Sceneprofiler to record speed. They created a 256x256 pixel template of skewed lane markings for template matching to identify similar markings in driving images as the evaluation area. Using the Hough transform, they delineated boundary lines and defined the painted area. A density histogram was then used to binarize density values and extract the residual area using a threshold from discriminant analysis. However, this method struggles with unclear lane contours or low contrast between the markings and the road surface, making accurate stripping rate assessment challenging.
Besides, Aseda et al.9) shifted the focus from identifying boundary lines within the evaluation area to directly analyzing the images of the evaluation area. They developed a method to calculate generalized density histogram characteristics for this specific domain, simultaneously generating matrix features and generalized dimensions. This approach enabled the use of these characteristics to perform multiple regression analysis on each evaluation area photograph, thus directly calculating the stripping ratio. However, lane recognition methods based on the Template Matching (TM) technique are influenced by the surrounding road environment, which can result in incorrect detection of lane markings. The TM method is effective in recognizing areas without striping, dirt, debris, or shadows, and it uses this smaller area to represent a 20-meter-long segment of the stripping ratio. Moreover, because the analyzed cases have high similarity, the stripping ratio can be assessed using image feature quantities. It is challenging to calculate the stripping ratio using the same parameters on roads from different prefectures, road types, and conditions.
In 2015, Nishino et al.10) developed a methodology to estimate the stripping ratio of lane markings using in-vehicle cameras and Geographic Information System (GIS) management. The process involves capturing top-view images from video recorded in front of a vehicle, synthesizing these images through projective transformations and binary image transformations, and comparing them with a theoretical image to determine the stripping ratio. However, the method’s generalizability across different environments or conditions may be limited. Variations in road surface, lane marking materials, and weather conditions can influence the visibility and detectability of lane markings, potentially leading to inconsistent results.
In 2021, Xu et al.11) developed a method for assessing the condition of road markings using video data captured by in-vehicle cameras. This approach employs hybrid feature detectors to identify road markings and threshold-based methods for image binarization to classify and assess their condition. However, the proposed computer vision technology may face challenges in handling real-world conditions, including varying lighting, shadows, and obstructions from other vehicles, which could affect its overall efficacy.
In 2023, Lea et al.12) implemented the YOLOv5 object detection algorithm to detect and classify the condition of road lane markings from images captured by cameras mounted on vehicles. The program achieved a general prediction accuracy of 60%. However, this method may face limitations in generalizing across different environmental conditions and types of lane markings due to the fixed nature of the image-based training data. Additionally, the method may encounter challenges in maintaining consistent accuracy across varying levels of wear.
In previous studies, two primary issues are commonly encountered by researchers. Firstly, the identification of lane boundaries often lacks accuracy and robustness. Secondly, when calculating the stripping ratio, the binary method exhibits inherent limitations in handling variations in lighting or shadows. Even direct calculations of stripping ratios using color information within the region do not yield satisfactory results.
This study aims to enhance the methodology in lane area segmentation, stripping area segmentation, and stripping ratio calculations. For two-step lane stripping area detection, which includes both lane area segmentation and stripping area segmentation, deep learning-based semantic segmentation models were innovatively employed to delineate boundaries. The top-view transformation and camera calibration were implemented to maintain the physical width of each pixel. This technique ensures that the geometric properties of the images are preserved, allowing for accurate measurements and analysis directly from the transformed images.
For lane area segmentation, a large and diverse dataset was gathered for model training. For stripping area segmentation, traditional annotation methods proved unsuitable, so a multi-section binarization method was innovatively employed for data annotation. The shadow simulation techniques were used for data augmentation to enhance the robustness of the segmentation model.
The proposed approach addresses the complexities associated with varying environmental and pavement conditions such as different types of road lane stripping, ensuring more accurate segmentation and analysis results for road lane stripping areas.
3. IMAGE CAPTURE AND TOP-VIEW TRANSFORMATION
In this study, a smartphone camera was used to capture road surface data, with the device mounted inside a vehicle. As the vehicle traveled, the smartphone’s camera recorded video, and the vehicle’s GPS information was concurrently logged to calculate driving speed13). Images were extracted from the recorded video. For accurate calculation of the lane stripping ratio, a method14) was applied using calibrated camera parameters to convert rear-view images into top-view images. These calibrated parameters ensured that each pixel was physically represented as a square with equal width and height, maintaining the accurate length of the top-view images 15).
The transformation of the coordinate system for top-view imaging is shown in Fig.1. The system comprises two components: the camera coordinate system (OC - XCYCZC) and the vehicle coordinate system (Ow - XwYwZw). Through a series of calibration parameters and top-view transformation, the rear-view camera images, as shown in the image in Fig.2, are transformed into top-view images, This transformation standardizes the scale of observation across the entire image, enabling precise measurements of the lane stripping ratio. This standardization is crucial for quantifying the severity and extent of the results.
Due to the effects of shooting distance and the transformation algorithm, the upper part of the transformed photos tends to be relatively unclear, and a large amount of irrelevant black space appears at the bottom. Therefore, the top-view transformed photos were cropped for further processing. The cropped image is shown in the last image in Fig.2.
4. ROAD LANE SEGMENTATION
To achieve robust results in road lane segmentation requires careful consideration of several critical conditions in lane markings. Images were captured at different times and under various weather conditions, including rain, snow, overcast skies, and clear weather, across multiple prefectures in Japan. The dataset also includes diverse road types such as national highways, prefectural roads, and rural lanes. To enhance the robustness of the models, the dataset covered images from different vehicles, under different levels of image clarity. Diverse types of road data were gathered to bolster the robustness of segmentation results, and DeepLabV3+16), a state-of-the-art semantic segmentation model, was employed. This model is recognized for its capacity to enhance boundary delineation and deliver high-quality segmentation results across different object scales, especially in complex road conditions.
(1) Image annotation for lane area segmentation
Firstly, the images transformed to a top-view and cropped were manually annotated. To ensure the model achieves robust recognition results, road images were collected under a variety of conditions. These conditions included different data-collecting vehicles, various road types, variations in the placement angle of the smartphone, conditions such as rain or snow, different degrees of wear on the road markings, and diverse types of road markings that may confuse lane marking segmentation.
For training data, lane markings on the images were initially annotated using polygons, and binary masks were generated from these boundary polygons. Fig.3 shows an example of our annotation process. The image in Fig.3(a) is the original image, Fig.3(b) shows the annotated and converted mask image, and Fig.3(c) depicts the composite image. Within the image, the annotated road lanes are marked in green.
(2) Training of lane area segmentation model
The model training involved a dataset consisting of 24,528 images for training and 3,030 images for validation. This model uses a ResNet5017) architecture as the encoder and DeepLabV3+ as the base decoder for semantic segmentation. The encoder was initialized with weights pre-trained on the ImageNet18) dataset. The training was conducted at a learning rate of 0.0001 over 100 epochs, with a batch size of 20 images, each resized to 512x512 pixels. During training, as the loss consistently decreased, the Intersection over Union (IoU)19) continually increased. Fig.4 shows the progression of IoU changes during model training. The pixel accuracy achieved was 99.44%, with an IoU of 88.43%.
(3) Results from the trained lane area segmentation model
The best model weights were employed for image inference, and the accuracy of the lane area segmentation was tested using images not included in the model training phase. The results, shown in Fig.5, demonstrate that the model can accurately identify road lane areas, including both clear and stripped lanes. And the model exhibited excellent recognition capabilities for dotted lines and lanes obscured by obstacles. However, some examples indicate the model for improvement. As shown in Fig.6(a), due to the severe stripping of the outer lane marking, the model fails to recognize a complete lane marking. In Fig.6(b), most of the outer lane marking is obscured by weeds, preventing the lane from being recognized, leading the model to mistakenly identify a guardrail with similar visual features as a lane marking. As shown in Fig.6(c), in areas without lane markings, the model incorrectly identifies other markings with similar linear features as lane markings. These misidentifications suggest an imbalance in the dataset, highlighting the need for more training images with highly stripped lane markings and images without any lane markings to ensure the model’s robustness.


5. STRIPPING AREA SEGMENTATION AND STRIPPING RATIO CALCULATION
In advancing the segmentation of the stripping area within road lanes, our approach diverges from the methods of related works. A deep learning-based semantic segmentation method is developed for highly robust stripping area segmentation. Initially, binarization is employed for image annotation, and this foundation is built upon data augmentation to generalize to various conditions. For model selection, the Unet++20) semantic segmentation model was utilized, primarily developed for medical segmentation tasks and demonstrating excellent performance in delineating fine details. Statistical processing of the semantic segmentation results enabled the calculation of the stripping ratio for the lane markings.
(1) Image annotation for lane marking stripping segmentation model training
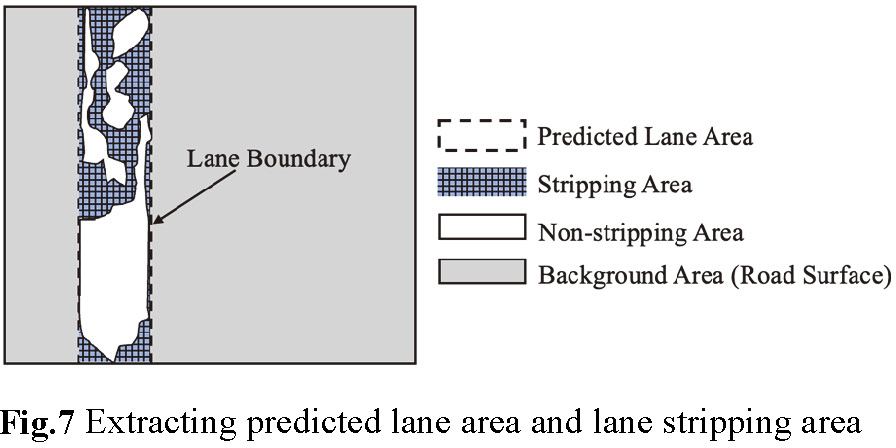
The stripping segmentation dataset was constructed with consideration for data diversity, including not only clear images but also those with lower clarity. As noted, this introduced challenges in the data annotation process. To address these challenges, annotators were trained using reference guidelines on wear levels provided by the expert guidelines6), ensuring that wear masks were accurately labeled in the images. Additionally, specialists were assigned to inspect and verify the quality of the annotated data. To achieve the high-performance lane markings stripping segmentation model, first, the lane areas identified by the road lane area segmentation model are initially cropped out. This allows the model to focus on the pixels within the lane area to separate between stripping and non-stripping areas, as shown in Fig.7. This process requires high precision in data annotation. Because it is extremely challenging to accurately distinguish between stripped and non-stripped areas at the pixel level during the annotation process, a binarization method was used to assist in this task. In our approach, a multi-section binarization method was employed for data annotation. Initially, the identified lane markings were segmented into smaller sections and converted to grayscale images. The binarization method was then applied to these grayscale images, with each section assigned a threshold to differentiate between the stripped and non-stripped areas. This method allowed for precise segmentation based on the specific conditions of each section, effectively addressing variations in visibility and stripping within the lane markings.
To enhance the training data annotation, lane marking images where stripping areas can be accurately segmented were selected to balance the dataset. Many lane markings are embedded within complex environmental conditions, such as shadows and obstructions like foliage or debris. For instance, as shown in Fig.8, shadows may vary in color depending on the time of day and shooting conditions, complicating the segmentation of lane markings overlaid with such shadows. Similarly, as shown in Fig.9, various types of obstructions or smudginess above the lane markings demonstrate that lane stripping area segmentation necessitates careful selection of binarization thresholds during the annotation process. As shown in Fig.10, during the segmentation of images into stripping and non-stripping areas, the histogram information showing the pixel values in the grayscale image aids the binarization process, helping to discern subtle variations that may not be visually distinct. In the histogram, two peaks can be observed. Between these peaks, an optimal threshold must be identified to allow the image to be perfectly segmented. Sometimes, the first peak may not be very distinct. In the provided example, a threshold value of 200 was selected.


As shown in Fig.11, a detailed training data annotation result with the zoomed-in regions reveals the inherent challenges in manually annotating training data for stripping area segmentation by drawing polygon boundaries. The absence of clear boundary lines complicate the annotation process. Particularly for lane markings that are partially stripped off, traditional data annotation methods using polygons do not provide sufficiently accurate segmentation results due to the unclear boundaries of the stripping areas. As shown in the binarized image (right side of Fig.11), our annotation method results in pixel-level inaccuracies in the segmentation of lane stripping areas.
(2) Data augmentation to enhance dataset robustness
During the annotation of training data, the dataset lacked enough lane images with partial shadows to achieve precise model inference results. To balance these limitations and enhance the robustness of model training, shadow simulation, and various data augmentation techniques were employed.
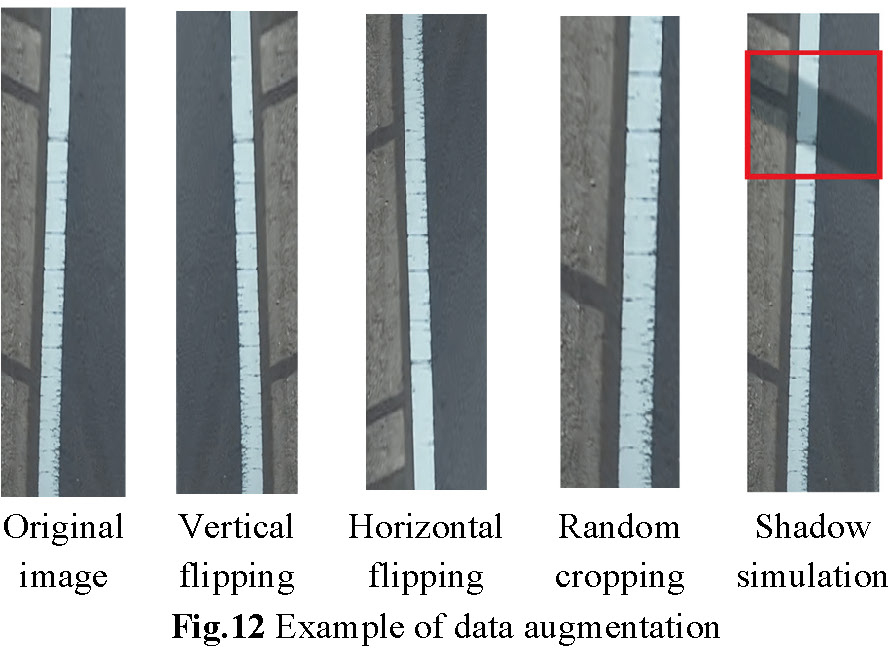
For shadow simulation, controlled and rotated rectangular shadows were added within random bounds on the images. Besides, random cropping, random horizontal flipping, and vertical flipping were applied to the lane marking images to further diversify the dataset and improve the model’s ability to generalize across different conditions. Each type of data augmentation was applied with a random probability in any batch, ensuring that each image could appear differently during the training process, and multiple augmentation methods could be applied to the same image. The examples of data augmentation are shown in Fig.12, where the area of the lane markings in the images has been expanded for better visualization of the data augmentation results.
(3) Training of lane stripping area segmentation model
A lane segmentation model incorporating a ResNet1817) architecture as the encoder and Unet++ as the base semantic segmentation model was employed. The encoder was initialized with weights pre-trained on the ImageNet dataset to leverage pre-existing feature representations. The model was trained over 50 epochs with a learning rate of 0.001, using a batch size of 32. Each image was cropped or padded to a target size of 928x64 pixels to suit the model’s input requirements. This configuration was chosen to optimize processing efficiency while maintaining high accuracy in segmenting lane markings under varying conditions.
The training process is shown in Fig.13, which shows the gradual improvement in the model’s Validation Pixel Accuracy as the number of epochs increases. In the end, the best model achieved a Validation Pixel Accuracy of 98.41%. This progression underscores the effectiveness of the chosen model configuration and training parameters in enhancing the model’s ability to accurately segment lane markings, highlighting the robustness and precision of the training regimen implemented in this study. Fig.14 shows inference results for several lane stripping area segmentation cases. Each set of images displays the original images on the left side and the segmented results on the right side. The segmentation process involves first segmenting the lane area and then the lane stripping area, with the results composited into the original image. In the composited images, blue indicates non-stripping areas, while red indicates stripping areas. The first set of images showcases a lane marking that is severely worn. The lane stripping segmentation model accurately distinguishes between the stripping and non-stripping areas. The second set of images shows a lane marking under the shadow of a utility pole, where the model effectively segments the stripping areas, confirming its robustness under shadowed conditions. The third set shows an image where the lane marking is obscured by fallen leaves. The model precisely infers the stripping and non-stripping areas. These examples highlight the model’s capability to deliver high-accuracy segmentation across various challenging conditions.


(4) Stripping ratio calculation
When the raw images were transformed using top-view transformation with camera calibration, that ensured each pixel in the photo represented equal length. The vehicle’s travel distance, calculated using GPS, ensures that each original photo extracted from the video captures the same length. The central 2 meters of each image were cropped to conduct statistical calculations for the stripping ratio. The stripping ratio is calculated by dividing the total area of the stripping area by the predicted lane area. The formula is represented in Eq. (1) to Eq. (3). Let cl represent the predicted lane area, cs denote the stripping area, and SR is the stripping ratio. At the same time, we can calculate the SR rank of the lane markings based on the current SR values and the SR rank evaluation criteria shown in Table 18).
6. EXPERIMENTAL CASE RESULT
To establish ground truth values for various stripping ratio (SR) cases, field inspections were conducted by professional personnel, who also collected data. The experiment was carried out in October 2023, under clear weather conditions, on a 250-meter section of a prefectural road in Tsukuba, with measurements taken at 10-meter intervals. When comparing these ground truth values with the predictions made using the techniques proposed in our study, it was found that the predicted SR closely aligns with the ground truth SR. As shown in Fig. 15, the R-squared (R²) value reached as high as 0.9827 across 25 cases. Additionally, we conducted a comparison using Mean Absolute Error (MAE). The overall MAE between the two data sets was 4.70%. Among the ranks, rank 3 had the largest error with a difference of 12.06%, while rank 2 had an error of 5.71%. The errors for all other ranks were below 5%, with rank 5 being the most accurate, showing only a 0.33% error. This demonstrates that our method can effectively determine the stripping ratio of lane markings with high accuracy and reliability.

During the calculation of the SR, it was noted that some cases were manual evaluated result slightly higher than expected through our proposed method. This might be attributed to the initial step of locating lane markings, where some regions were not perfectly segmented as part of the lane area, leading to incomplete lane markings being considered in the step of stripping area segmentation and stripping ratio calculation. Additionally, for the lane marking stripping area segmentation model, the quantity of the dataset needs to be increased. Despite these challenges, our accuracy still reached 76%. Considering the tolerances for error as per standard norms, the accuracy could effectively be adjusted to 100%.
7. CONCLUSION
Current evaluation methods for lane marking stripping often rely on visual inspection or traditional image recognition algorithms combined with simple binarization. This study introduces an innovative approach utilizing photo-derived top-view transformation and a two-step deep learning-based semantic segmentation method to accurately determine the stripping ratio for lane marking maintenance. This method involves mounting a smartphone within a moving vehicle and using the video recorded by the smartphone camera to precisely calculate the road lane’s stripping ratio. Given the extensive manual labor typically required to identify the lane marking stripping ratio, this approach proves to be highly efficient.
The results of the predicted and calculated stripping ratio, compared with the reference values of manual identification, demonstrate a high similarity in the stripping ratio, with an R2 value of 0.9827. By calculating the rank of stripping, high accuracy is also achieved.
Future research will focus on improving the segmentation accuracy of both models to further enhance prediction accuracy. Furthermore, the experiment highlighted the need for more comparative data. In future work, manual measurements will be conducted on roads with varying lighting conditions, stripping levels, and driving scenarios to further explore the generalizability of our method.
References
- 1) Ministry of Land, Infrastructure, Transport and Tourism: Road Statistics Annual Report 2022, 2022.
- 2) Ministry of Internal Affairs and Communications: labor force survey.
- 3) Japan Contractors Association of Traffic Signs and Lane Markings: Road Markings and Traffic Safety, pp. 17, 2008. (In Japanese)
- 4) Suganuma, N., Yoneda, K., Yanase, R., Kuramoto, A., Yamashita, T., Fujiyoshi, H., and Meguro, J.: Research on the Recognition Technology Required for Automated Driving Technology (Levels 3 and 4), 2nd Phase SIP-adus Mid-Term Results Report, Contents. 3, pp. 79-85, 2018-2020.
- 5) Hirasawa, M., Takemoto, A., and Kasai, S.: A study of repainting criteria for pavement markings in Hokkaido, Proceedings of infrastructure planning, Vol. 38, No. 268, 2010. (In Japanese)
- 6) Japan Contractors Association of Traffic Signs and Lane Markings: About the durability of road markings, 2015. (In Japanese)
- 7) Japan Contractors Association of Traffic Signs and Lane Markings: On decisions regarding the repainting of road markings, 2011. (In Japanese)
- 8) Asada, T., Kameyama, S., Ishida, S., Kawabata, S., and Kasahara, A.: Development of evaluation method of stripping ratio of road markings using image analysis, The 11th International Conference on Asphalt Pavements, Vol. 5, No. 274, 2010.
- 9) Asada, T., Honda, S., and Kameyama, S.: Development of estimation method of the stripping ratio of road markings using image features. Journal of Japan Society of Civil Engineers. Ser. E1, Pavement Engineering, Vol. 67, No. 1, pp. 10-21, 2011. (In Japanese)
- 10) Nishino, S., Wakayama, K., Bhuiyan, M. S., Kawanaka, H., and Koji, O.: Measurement and management of the lane markings’ stripping ratio from in-vehicle camera image, IEEE 18th International Conference on Intelligent Transportation Systems, pp. 1755-1760, 2015.
- 11) Xu, S., Wang, J., Wu, P., Shou, W., Wang, X., and Chen, M.: Vision-based pavement marking detection and condition assessment-A case study, Applied Sciences, Vol. 11, Iss. 7, No. 3152, 2021.
- 12) Bronuela-Ambrocio, L. B., Antes, E. R. D., and De Leon, M. D. S.: Assessment of longitudinal pavement marking conditions based on deep learning, Philippine Engineering Journal, Vol. 44, No. 1, pp. 65-88, 2023.
- 13) Chen, J., Xue, K., and Nagayama, T.: Vehicle trajectory estimation in GPS-blocked environments using inertial measurement units, estimated drive speed, and bidirectional Kalman filters, Structural Safety and Reliability: Proceedings of the Japan Conference on Structural Safety and Reliability (JCOSSAR), The 10th Japan Conference on Structural Safety and Reliability, pp.23-30, 2023.
- 14) Geda, J. M. G., Xue, K., Nagayama, T., Zhao, B., and Naka, M.: Estimation of pavement crack ratio by top-view transformation of in-vehicle smartphone camera and deep learning-based classification, Artificial Intelligence and Data Science, Vol. 3, No. 3, pp. 26-39, 2022.
- 15) Gao, W., Xue, K., Nagayama, T., Zhao, B., and Su, D.: Rut depth estimation by distortion analysis of images taken by an in-vehicle camera, Life-Cycle of Structures and Infrastructure Systems, CRC Press, pp. 3832-3839, 2023.
- 16) Chen, L. C., Zhu, Y., Papandreou, G., Schroff, F., and Adam, H.: Encoder-decoder with atrous separable convolution for semantic image segmentation, The European Conference on Computer Vision (ECCV), pp. 801-818, 2018.
- 17) He, K., Zhang, X., Ren, S., and Sun, J.: Deep residual learning for image recognition, The IEEE Conference on Computer Vision and Pattern Recognition (CVPR), pp. 770-778, 2016.
- 18) Deng, J., Dong, W., Socher, R., Li, L. J., Li, K., and Fei-Fei, L.: Imagenet: A large-scale hierarchical image database, 2009 IEEE conference on computer vision and pattern recognition, pp. 248-255, 2009.
- 19) Liu, J., Dang, J., and Chun, P.: Bridge corrosion damage detection using deeplabv3+ model and performance boosting, Intelligence, Informatics and Infrastructure, Vol. 3 No. J2, pp. 802-810, 2022. (In Japanese)
- 20) Zhou, Z., Rahman Siddiquee, M. M., Tajbakhsh, N., and Liang, J.: Unet++: A nested u-net architecture for medical image segmentation, Deep Learning in Medical Image Analysis and Multimodal Learning for Clinical Decision Support: 4th International Workshop, Vol. 11045, pp. 3-11, 2018.
- 21) Japan Contractors Association of Traffic Signs and Lane Markings: The road sign handbook, 1998. (In Japanese)