Trials of Night-Time 4K-Camera-based Human Action Recognition in Riverine Environments with Multimodal and Object Detection Technologies
2024 Volume 5 Issue 2 Pages 87-94
Details
2024 Volume 5 Issue 2 Pages 87-94
At present, the Ministry of Land, Infrastructure, Transport, and Tourism (i.e., MLIT) has installed about 3,000 CCTV cameras in rivers throughout Japan. Initially, these devices were installed to monitor water levels during floods and visually inspect damage after earthquakes. Moreover, the riverine environment management researchers (i.e., “the researchers” in the following content) have been trying to survey the situation of rivers and embankments through patrolling. In addition, night-time patrols are carried out only in certain areas at certain times of the year for certain purpose. It is difficult for the researchers to monitor the status of riverine areas 24 hours a day. In recent years, researchers have conducted river space utilization surveys (i.e., RSUS) using camera images and machine learning. However, in the case of nocturnal RSUS, there is no detailed research on this topic. Therefore, the authors of this study (i.e., “the authors” in the following content) aim to understand the number and behavior of humans using river space at night, and confirm the performance of the models depending on the brightness difference in the images.
Currently, the Ministry of Land, Infrastructure, Transport and Tourism (i.e., MLIT) has installed about 3,000 CCTV cameras in the rivers nationwidely. The original purpose of installing these devices are used to monitor the water level during floods and check the damage after earthquakes visually.
In addition, the riparian environment management researchers (i.e., “the researchers” in the following content) attempted to grasp the situation of rivers and levees by patrolling, and to detect illegal and nuisance activities such as illegal dumping of garbage and golf1).
Furthermore, due to the burden on surveyors and work hours, night-time patrols are carried out only in specific areas and at certain times of each year2). It is difficult for the researchers to grasp the status of river spaces 24 hours every day.
In recent years, researcher have conducted on river space utilization surveys (i.e., RSUS) using camera images and machine learning3). But in the case of the night-time RSUS, there are not detailed research about this topic. Therefore, for deeply understanding the utilization situation of the infrastructure, the authors in this research (i.e., “the authors” in the following content) had a trial to understand the number and behavior of human using the river space at night.
And for evaluating the models’ night-time detection/recognition ability, the authors also attempt to confirm the performance of the models when the brightness changes. Based on the performance of the model, the authors attempt to understand the minimum brightness value for the available inference (i.e., confidence value is over 0.5).
(1) Study Site
In Fig.1, the study site is an area around the Ichinoarate Weir, which is located at the branches of the Okayama-flow-through Asahi and Hyakken Rivers. Near the study site, there are several infrastructures nearby, i.e., baseball field, park and pond. Bicycles-riding students, children-taking human and dog walkers have been seen several times in this area. In addition, since the separation levee is an extension of the Asahi and Hyakken Rivers running track, some joggers were also seen in this area.

(2) Device
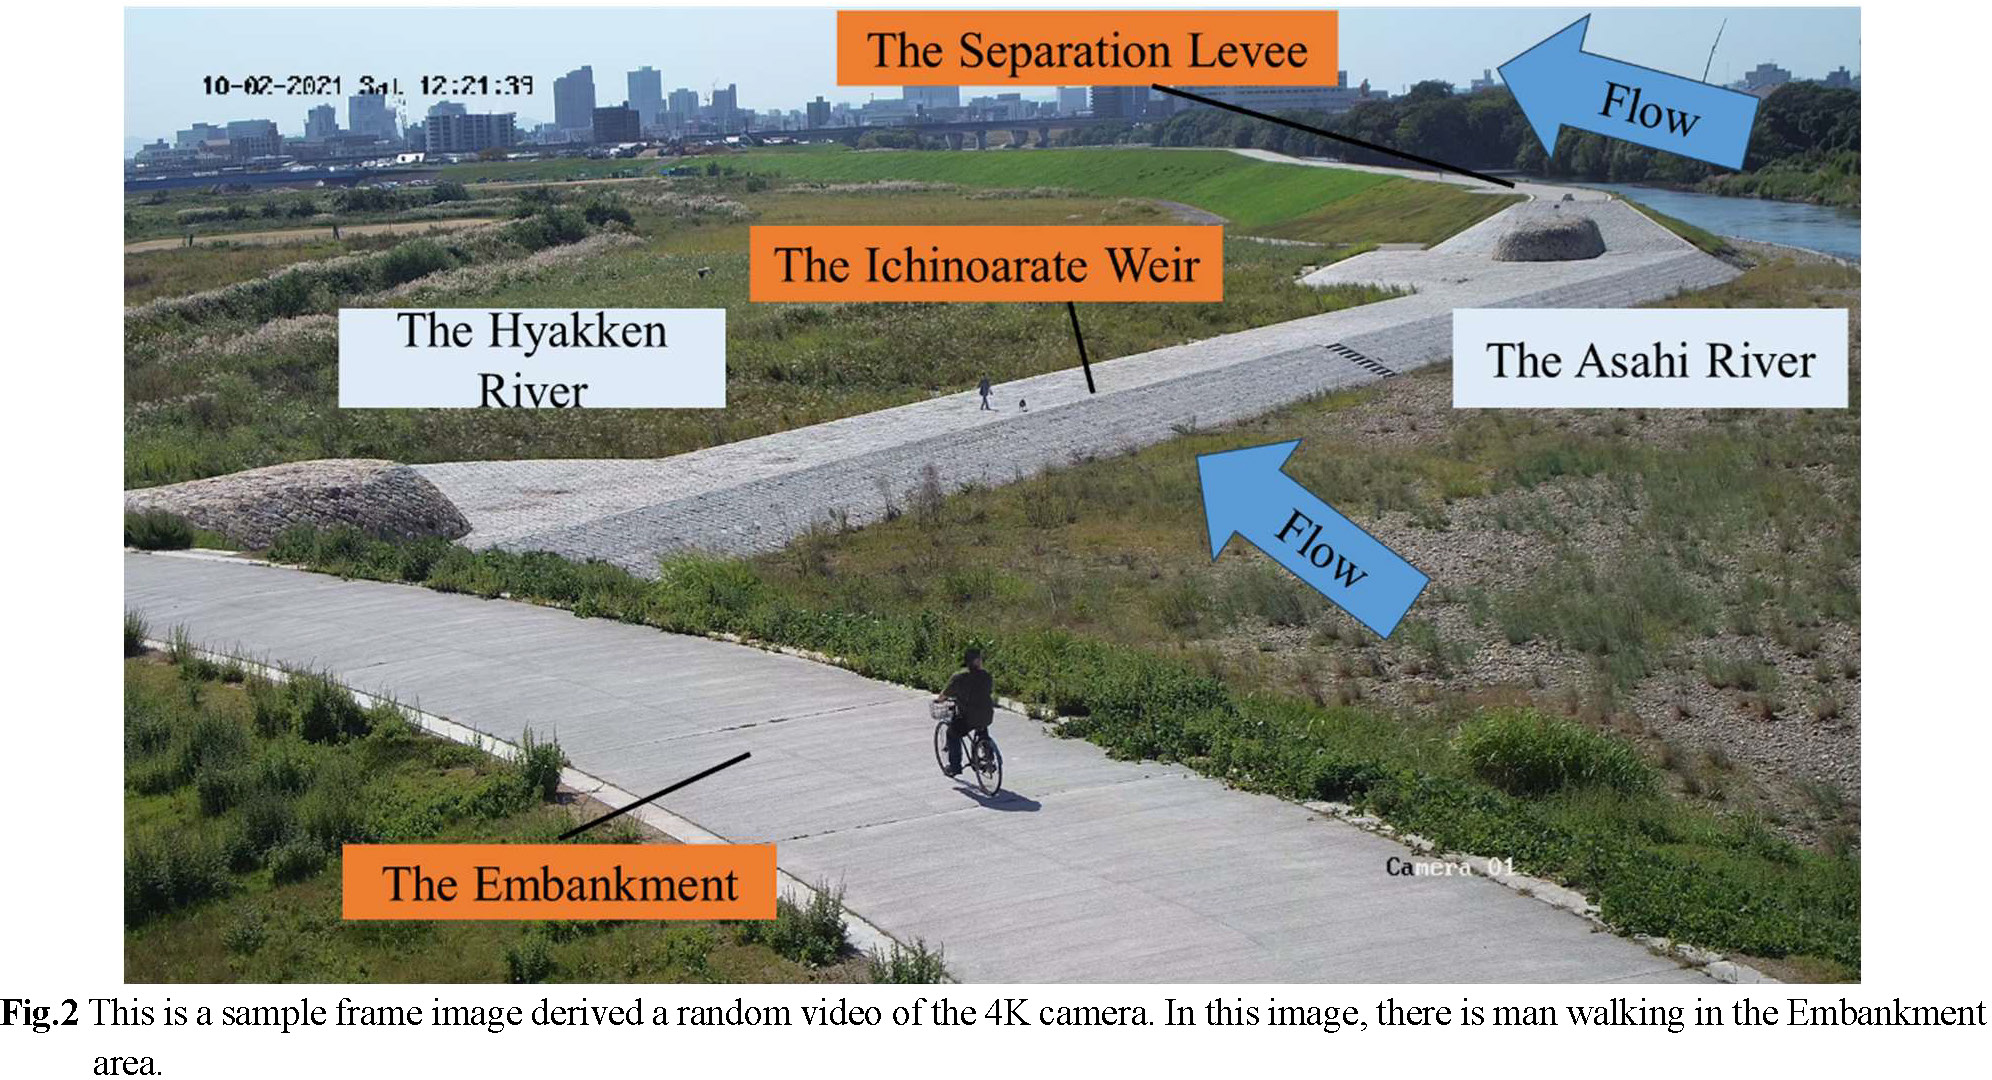
A 4K camera in Fig.2 was installed by the MLIT on a pillar near Ichinoarate to capture high quality videos. The frame rate of the 4K camera was set to 30 fps and the resolution to 3840 × 2160 px. The video-recording period was from August 3rd to December 28th, 2021. The areas used by human can be divided into three main areas in the frame image: the Embankment in the foreground, the Ichinoarate Weir in the middle, and the Separation Levee at the further area.
(3) Models
In this study, the object detection model, You Only Look Once version 8, YOLOv84) and the large-scale multimodal model, Large Language-and-Vision Assistant version 1.5, LLaVA-1.55) were used.
YOLOv8 is an advanced object detection algorithm that balances speed and accuracy in practical real-time object detection tasks. In terms of ease of use, the YOLO algorithm boasts simplicity over other algorithms and is especially suitable for users who have used previous versions. When the version renews, the users with previous YOLO-related experiences can use the existing dataset directly in the newest version without any modification. Based on the mentioned reasons, the authors chose YOLOv8 as the model for the detection in this research. During selecting the model size of YOLOv8, x was selected for this study because of its optimized trade-off between accuracy and inference speed on real-time object detection tasks across different application areas (comparing with the instance segmentation task, YOLOv8x-seg).
LLaVA-1.5 is a type of Large Multimodal Model (i.e., LMM), which can understand and generate information across different types of data, i.e., multiple modalities. The first version was released in April 2023, and version 1.5 was released in October 2023. The textual instructions input by the users are called “prompts,” and by adjusting or changing the prompts, it is possible to elicit the information the user is looking for.
(4) Workflow
As shown in Fig.3, Step-1 and Step-2 are set as the procedures of this study. In Step 1, images are extracted from the video recorded by a 4K camera in the Asahikawa watershed. Then, the images are input to YOLO and LLaVA, and the inference results are compared to see how much difference there is in the number of human detected depending on the brightness in the image (Fig.3). And, it is assumed that both the image and the prompt are input to LLaVA. Next, in Step-2, some images in the B-Box (i.e., bounding box) area are extracted from the results inferred by YOLO in Step-1, and these are input to LLaVA to verify the degree to which human actions can be discriminated.

(5) Analysis conditions
In Step-1, the frames images for analysis were extracted from a video of a fireworks display at the Separation Levee on September 29th, 2021, and used for inference. Sixty frames of images were extracted between 19:00:50 and 19:00:52, numbered from 1 to 60, and inference was performed using YOLO and LLaVA, respectively. As shown in Fig.4, this scene was captured between during the fireworks, and the brightness in the image was darkened with the passage of time. The YOLO model “YOLOv8x-seg.pt” was used. The confidence value for inference was set to 0.5, and the classes to be detected were set as “person”, “bicycle”, “car”, “motorcycle”, “dog”, “backpack”, “umbrella”, and “handbag”. In the case of using LLaVA, the prompt was set as “This is a picture taken at night. How many people are there at least?”, this prompt guided the LLaVA-1.5 model to adjust its processing and focus on features relevant to low-light conditions.

In Step-2, Firstly, from the image with the detection by YOLOv8 in Step-1, samples are cut out from the detection rectangular. The cut-out images are then input to LLaVA for inference. In order to verify what kind of differences can be observed from different brightness, comparisons have been performed using the same action under both day and night time. The prompt to be entered into LLaVA was “Please describe in detail what the person in the picture is doing.”
Fig.5 shows the inference results for YOLO and LLaVA. The correct number of the human existed in the image was 27, and the number was checked by several researchers with counting experience. The histogram function of the image editing software “GIMP” 6) was used to obtain the mean, central and standard deviation of brightness in the area (3840 × 1260 px) of 60 images containing human in Fig.6. The measurement area was limited to the YOLO detection rectangular.


In the case of Fig.5, brightness value is expressed in the range of 0 to 1, with darker colors having smaller values and lighter colors having larger values. The maximum value of RGB values is directly proportional to the brightness value. For example, if there is a green color called RGB (50, 200, 128), the maximum value is 200, so 200/255 ≈ 0.78. This means that the brightness value is 0.78. YOLO and LLaVA have detected/recognized most human (i.e., 18-, 15- humans using YOLO and LLaVA, respectively, out of approximate total 25 humans in one image) with a mean value of 0.546 and a central value (median value) of 0.537, respectively. Gradually, when the mean and central values become lower, the detection count decreased (the detection under worst condition can be 0).
Comparing the results of YOLO and LLaVA, these two models have one common part that the accuracy of human-number inference decreased with reducing brightness in the image. This is mainly derived from the human shadows effected by the light, which increased the difficulty of capturing human features when the entire image becomes darker. Therefore, to improve detection accuracy at night, it is considered to place a light source (e.g. street lamp) nearby to decrease the effect derived from the shadow.
The detection accuracy cannot be improved with highest mean or central values of brightness comparing with the values between approximate 0.5 and 0.6. Due to the fact, too high brightness causes a phenomenon similar to white skipping, whereby the bright areas of the image lose their color range and the boundary between the object and the background disappear. Thus, the outline of the objects cannot be determined.
In order to verify the differences when inferring from different brightness, Fig.7 selected 4 samples from night- (i.e., No.1 & 3) and day-time (i.e., No.2 & 4). Fig.8 shows the results of LLaVA inference based on the 4 samples in Fig.7: No.1, wearing a long dress; No.2, wearing a bag; No.3 playing golf (incorrect); No.4, looking up to the sky. The reason of misclassifying No.3 may be derived from that the both-arms raising gesture resembles a golf swinging pose, and the light from the smartphone at night is misidentified as a golf ball. Comparing with the smartphone user at day-time (i.e., No.4), even the same act, No.3 cannot be detected as the same results derived from the light generated from the smartphone.


As shown in Fig.9, the pose estimations of No.1 & 3 are both derived from the back-views, which can show all the key points of the body clearly. No.1 & 3’s confidence value suddenly decreases at around Frame Image Number 41, the reason is derived from the brightness value change (i.e., less than 0.1). The averaged confidence value of all the detected objects also decreased to under 0.65 when the brightness value becomes under 0.1.

For understanding the relationship of contrast value (i.e., brightness value difference between back area and mask area) and confidence value, as shown in Fig.10, the authors separated the detected results into three main areas. After the calculation as Equation (1), the authors dedicated the positive correlation between contrast value and confidence value in Fig.11. From the staring of the trial, the authors did not considerate whether the Mean Value or Central Value have the correlation with confidence value or not. The reason of selecting these two index are mainly based on the ease of obtaining from the image processing software. Derived from the results, both Mean Value and Central Value are matching positive correlation with Confidence Value (0.2818, 0.2714, 0.3207 and 0.3043 R2), so in the future research, just contrast value will be in consideration for the comparison.


As the comparison with No.1 & 3, No.2 & 4 shown in Fig.12 were collected at day-time with the high confidence value. As shown in Fig.13, for improving the results of the images around Frame Image Number 41 (i.e., upper side), the authors selected the area that cannot be detected (i.e., No.1) and increased the contrast and brightness value of the selected area. Comparing with the result derived from area in the Frame Image Number 41, the focused area in Fig.13 >can be detected over 0.5 confidence value. Contrast/Brightness value increasing did not improve the confidence value a lot.


In Step 1, YOLO and LLaVA showed a common trend that the accuracy of inferring the number of human decreases as the brightness of the image decreases. It was also confirmed that the detection accuracy was highest when the brightness was between 0.5 and 0.6. In the future, it is necessary to investigate whether the detection accuracy can be improved by adding image brightness and contrast as post-processing.
In Step 2, the authors confirmed that LLaVA can detect walking from still images during the day. In addition, it was confirmed that LLaVA could misidentify light as a white object at night.
As the supplement, the pose estimation gave a reference for the authors to select the objects. In this research, if the key points in the pose estimation are clear, when brightness value is over 0.1, the inference result with over 0.5 confidence value is possible. The contrast value and confidence value derived from No.1 & 3 have the positive correlation. If the area for inference can be focused, the confidence value can also be improved.
This work was supported by JST SPRING, Grant Number JPMJSP2126, and YR 2024 Scholarships for Students of Graduate School of Environmental and Life Sciences, Okayama University. The data collections were authorized by Okayama River Management Office, MLIT, Japan.