Abstract
Bradyrhizobium japonicum strains that have the nosZ gene, which encodes N2O reductase, are able to mitigate N2O emissions from soils (15). To examine the distribution of nosZ genotypes among Japanese indigenous soybean bradyrhizobia, we isolated bradyrhizobia from the root nodules of soybean plants inoculated with 32 different soils and analyzed their nosZ and nodC genotypes. The 1556 resultant isolates were classified into the nosZ+/nodC+ genotype (855 isolates) and nosZ−/nodC+ genotype (701 isolates). The 11 soil samples in which nosZ− isolates significantly dominated (P < 0.05; the χ2 test) were all Andosols (a volcanic ash soil prevalent in agricultural fields in Japan), whereas the 17 soil samples in which nosZ+ isolates significantly dominated were mainly alluvial soils (non-volcanic ash soils). This result was supported by a principal component analysis of environmental factors: the dominance of the nosZ− genotype was positively correlated with total N, total C, and the phosphate absorption coefficient in the soils, which are soil properties typical of Andosols. Internal transcribed spacer sequencing of representative isolates showed that the nosZ+ and nosZ− isolates of B. japonicum fell mainly into the USDA110 (BJ1) and USDA6 (BJ2) groups, respectively. These results demonstrated that the group lacking nosZ was dominant in Andosols, which can be a target soil type for an N2O mitigation strategy in soybean fields. We herein discussed how the nosZ genotypes of soybean bradyrhizobia depended on soil types in terms of N2O respiration selection and genomic determinants for soil adaptation.
Denitrification by the soybean endosymbiont Bradyrhizobium japonicum generally requires four enzymes: periplasmic nitrate reductase (Nap), nitrite reductase (Nir), nitric oxide reductase (Nor), and N2O reductase (Nos) (3, 11, 12, 33). These enzymes are encoded by the napA, nirK, norCB, and nosZ genes, respectively (3, 18, 20). Sameshima-Saito et al. (27) found two major sets of denitrification genes in indigenous soybean bradyrhizobia: a complete denitrifying group (nosZ+ strains) with napA, nirK, norCB, and nosZ, and an incomplete denitrifying group (nosZ− strains) with napA, nirK, and norCB. Thus, the presence of nosZ is variable in the genomes of soybean bradyrhizobia, although most strains possess napA, nirK, and norCB as core genes for denitrification from nitrate (NO3−) to nitrous oxide (N2O) (27). This difference was supported by comparative genomics of B. japonicum strains USDA110 (nosZ+) and USDA6 (nosZ−) (17).
N2O is a greenhouse gas and is also involved in the destruction of the ozone layer (21). N2O is emitted largely from agricultural lands (7, 8, 39, 40) via microbial denitrification and nitrification processes (1, 22, 30, 35). In the soybean rhizosphere, a large proportion of N2O is emitted during degradation of the root nodules (9, 10). On the other hand, soybean roots nodulated with the nosZ+ strains of B. japonicum are able to scavenge N2O, even at very low concentrations (26). This offers a promising strategy for the mitigation of N2O emissions from soybean fields in which native bradyrhizobia lack the nosZ gene (nosZ− strains) (8, 26). Inoculations with the nosZ+ strains of B. japonicum or nosZ++ (mutant strains with increased N2O reductase activity) (13) were found to significantly decrease N2O emissions from soybean rhizosphere dominated by the nosZ− strains of soybean bradyrhizobia (15). Although recent studies have proposed that B. japonicum could be subdivided into B diazoefficiens and B. japonicum (6), the conventional genus and species names of B. japonicum are used here (14, 15).
Genetic diversity among indigenous soybean (brady)rhizobia is influenced by soil conditions such as pH (34, 41) and by latitude (32), and analyses of the ITS (internal transcribed spacer) region between the 16S and 23S rRNA genes revealed that latitude (through its effects on temperature) is one of the main factors determining their geographical distribution in Japan (24) and the USA (31). The effects of temperature were partially verified by soil microcosm and nodulation experiments under different temperatures (23, 31). However, the relationships between soil properties, including soil type, and the diversity of indigenous soybean bradyrhizobia have not yet been elucidated in detail.
To facilitate the bradyrhizobia inoculation in soybean fields in order to mitigate N2O emissions (15), it is crucial to identify what determines the dominance of nosZ− strains in field soils. Therefore, we systematically surveyed the distributions of nosZ+ and nosZ− strains indigenous to the soils of agricultural fields in Japan, and analyzed the incidence of nosZ genotypes in each of the fields sampled together with soil and climate metadata. The results obtained clearly showed that nosZ− strains dominated in Andosol, a volcanic ash soil prevalent in Japan.
Materials and Methods
Soil samples
We collected 32 soil samples from agricultural fields throughout Japan (Tables 1, S2). The soil types were Andosols, Gleysols, and Fluvisols, based on the FAO soil classification (http://www.fao.org/soils-portal/soil-survey/soil-classification/en/). Fluvisols generally develop from alluvial deposits, and many Fluvisols under natural conditions are flooded periodically (16). Gleysols are wetland soils that, unless drained, are saturated with groundwater for long periods (16). Fluvisols and Gleysols in many cases generally develop from alluvial soils. We collected 32 soil samples to balance the number of Andosol and alluvial soil samples (Table 1). These soil samples were stored at 4°C until use.
Table 1
Soils used in the present study.
| Soil |
Soil type |
Prefecture |
Latitude (°N) |
Longitude (°E) |
Soil sampling date |
Cultivation historya |
Source |
| HK1 |
Fluvisol |
Hokkaido |
43.07 |
141.35 |
Feb-08 |
Rotation, +NPK |
T. Ezawa |
| HK2 |
Fluvisol |
Hokkaido |
43.07 |
141.35 |
Feb-08 |
Rotation, −N |
T. Ezawa |
| HK3 |
Fluvisol |
Hokkaido |
43.07 |
141.35 |
Feb-08 |
Rotation, −P |
T. Ezawa |
| HK4 |
Andosol |
Hokkaido |
42.91 |
143.05 |
Sep-07 |
Yam |
T. Kaji |
| HK5 |
Andosol |
Hokkaido |
43.08 |
142.84 |
Aug-07 |
Carrot |
T. Kaji |
| HK6 |
Andosol |
Hokkaido |
43.08 |
142.84 |
Aug-07 |
Carrot |
T. Kaji |
| HK7 |
Andosol |
Hokkaido |
42.99 |
143.20 |
Aug-07 |
Onion |
T. Kaji |
| HK9 |
Andosol |
Hokkaido |
42.99 |
143.20 |
Sep-07 |
Asparagus |
T. Kaji |
| HK10 |
Andosol |
Hokkaido |
42.99 |
143.20 |
Sep-07 |
Asparagus |
T. Kaji |
| KW1 |
Andosol |
Miyagi |
38.74 |
140.76 |
Jul-09 |
Soybean |
M. Saito |
| KW2 |
Andosol |
Miyagi |
38.74 |
140.76 |
Jul-09 |
No cultivation |
M. Saito |
| KS1 |
Gleysol |
Miyagi |
38.46 |
141.09 |
Oct-07 |
Soybean |
M. Itakura |
| KS2 |
Gleysol |
Miyagi |
38.46 |
141.09 |
Oct-07 |
Paddy field |
M. Itakura |
| YM1 |
Gleysol |
Yamagata |
38.24 |
140.37 |
Aug-07 |
Soybean |
H. Shiono |
| YM2 |
Gleysol |
Yamagata |
38.24 |
140.37 |
Aug-07 |
Soybean |
H. Shiono |
| YM3 |
Gleysol |
Yamagata |
38.24 |
140.37 |
Aug-07 |
Soybean |
H. Shiono |
| NG |
Gleysol |
Niigata |
37.44 |
138.87 |
Sep-07 |
Soybean |
Y. Shiratori |
| TS1 |
Gleysol |
Ibaraki |
36.03 |
140.11 |
Aug-07 |
Soybean |
M. Hayatsu |
| TS2 |
Gleysol |
Ibaraki |
36.03 |
140.11 |
Aug-07 |
Upland rice |
M. Hayatsu |
| TS3 |
Gleysol |
Ibaraki |
36.03 |
140.11 |
Aug-07 |
Paddy rice |
M. Hayatsu |
| TS4 |
Andosol |
Ibaraki |
36.03 |
140.11 |
Oct-08 |
Soybean |
M. Hayatsu |
| TS5 |
Andosol |
Ibaraki |
36.03 |
140.11 |
Oct-08 |
Soybean |
M. Hayatsu |
| FK1 |
Gleysol |
Fukuoka |
33.61 |
130.46 |
Jun-09 |
Soybean |
T. Yamakawa |
| FK2 |
Gleysol |
Fukuoka |
33.21 |
130.43 |
Jun-09 |
Soybean, Wheat |
M. Araki |
| KM1 |
Gleysol |
Kumamoto |
32.89 |
130.77 |
Jun-09 |
Soybean |
H. Mizukami |
| KM2 |
Gleysol |
Kumamoto |
32.89 |
130.77 |
Jun-09 |
Soybean |
H. Mizukami |
| KM3 |
Andosol |
Kumamoto |
32.89 |
130.77 |
Jun-09 |
Soybean |
M. Matsumori |
| KM4 |
Gleysol |
Kumamoto |
32.76 |
130.76 |
Jun-09 |
Paddy rice |
N. Gunjikake |
| MY1 |
Gleysol |
Miyazaki |
32.00 |
131.47 |
Jun-09 |
Soybean |
Y. Saeki |
| MY2 |
Andosol |
Miyazaki |
31.83 |
131.41 |
Jun-09 |
Soybean |
Y. Saeki |
| KG1 |
Gleysol |
Kagoshima |
31.39 |
130.38 |
Jun-09 |
Paddy rice |
T. Mochida |
| KG2 |
Andosol |
Kagoshima |
31.44 |
130.92 |
Jun-09 |
Soybean |
T. Mochida |
a Rotation: Crop rotation of soybean, corn, oats, beets, and sunflower. +NPK: N, P and K fertilizers were fully applied to the upland field as macronutrients. −N: without N fertilizer. −P: without P fertilizer.
Two strains of B. japonicum, USDA110 (nosZ+ genotype) and T9 (nosZ− genotype), were used as standard strains (14). The cells were grown at 30°C in HM medium (5) supplemented with 0.1% arabinose and 0.025% (w/v) yeast extract (Difco, Detroit, MI, USA). HM medium was further supplemented with trace metals (HMM medium) for the denitrification assay (26, 28).
Isolation of soybean bradyrhizobia
Surface-sterilized soybean seeds (Glycine max cv. Enrei) were germinated in sterile vermiculite for 2 d at 25°C (9, 10). Each seedling was then transplanted into a Leonard jar (one plant per jar) that contained sterile vermiculite and nitrogen-free nutrient solution (9, 10). The seedlings were then each inoculated with 1 g of soil. Plants were grown in a phytotron (Koito Industries, Tokyo, Japan) providing photosynthetically active radiation (PAR, 400–700 nm) at a photon flux density of 270 μmol m−2 s−1 for 30 d at 25/20°C with a 16-h light/8-h dark photoperiod. A nitrogen-free sterilized nutrient solution was periodically supplied to the pots (9, 10). Between 18 and 138 nodules (average 51 nodules, Table S1) were separated from the roots inoculated with each soil 30 d after the inoculation, and were surface-sterilized with 0.5% NaOCl solution. The nodules were then cut in half with sterilized razor blades, and the inner bacteroid cells were streaked on HM agar medium. After the HM agar plates had been incubated for 10 d at 30°C, single colonies were picked up from respective nodules (one colony per nodule), and transferred onto fresh HM agar plates for the following PCR analyses. Using this procedure, we collected 1639 isolates from 32 different soil samples.
PCR analysis targeting nosZ and nodC genes
The total DNA lysate from the cultured cells was prepared as described previously (14). nosZ and nodC primers were used to detect B. japonicum nosZ and nodC (15). The primer sequences were nosZ-f, 5′-GACGGCGATACCATGAAAGT; nosZ-r, 5′-TTCTTCACTGCCTCCTCGAT; nodC-f, 5′-CTCCTCGCCATTTCATCACT; and nodC-r, 5′-CAGATATTGATCGGCGTGTG (15). The total DNA lysate was directly used as the template DNA. Ex Taq DNA polymerase (Takara, Osaka, Japan) was used for PCR amplification. The reaction mixture was incubated at 94°C for 5 min; then 30 cycles of 94°C for 30 s, 57°C for 30 s, and 72°C for 30 s; and a final 72°C for 7 min (15).
Determination of the ITS (internal transcribed spacer) sequence
To determine the ITS sequence of representative isolates from the 32 different soil samples, we randomly selected 245 isolates from the 1556 isolates to include both nosZ+/− isolates based on the incidence of the nosZ genotype (Fig. S1, Table S3). The total DNA lysate was used as the template DNA in a 50-μL reaction mixture for PCR using ExTaq DNA polymerase. In the ITS amplification, the ITS primer set and PCR cycle conditions were the same as those described previously (23). Amplified DNA fragments were purified using the Wizard SV 96 PCR Clean-Up System and Vac-Man 96 Vacuum Manifold (Promega, Madison, WI, USA). The sequencing of amplified DNA fragments was performed by the Dragon Genomics Center at TAKARA BIO INC. (Otsu, Japan). The BigDye Terminator v3.1 Cycle Sequencing Kit (Applied Biosystems, Foster City, CA, USA) was used for the sequencing reaction, and DNA sequencing was then carried out on an ABI 3730xl DNA Analyzer (Applied Biosystems).
Phylogenetic analysis
Sequences were aligned by CLUSTALW (38). On the basis of that alignment, a distance matrix was constructed using the DNADIST program from PHYLIP v. 3.66 (http://evolution.genetics.washington.edu/phylip.html) with default parameters. In order to define operational taxonomic units (OTUs) for conducting the clustering analysis, the default mothur (19) settings were used with threshold values of 99% sequence identity. In the phylogenetic analysis, sequences were aligned by CLUSTALW (38), and the neighbor-joining method was used to build a phylogenetic tree (25). The PHYLIP-format tree output was obtained by bootstrapping (http://evolution.genetics.washington.edu/phylip.html) using 1000 bootstrap trials. The trees were constructed by MEGA v. 4.0 software (37). Phylogenetic analysis used the reference strains B. japonicum USDA110 (Accession number AB100749), USDA122 (AB100751), USDA123 (AB100752), USDA124 (AB100753), USDA38 (AB100743), USDA6 (AB100741), T9 (AB278129), and T7 (AB278128); B. elkanii USDA76 (AB100747); and Mesorhizobium loti MAFF 303099 (BA000012).
Physical and chemical analyses of soils
We analyzed the chemical and physical properties of soils including soil texture, pH (H2O), pH (KCl), total nitrogen (T-N), total carbon (T-C), C/N ratio, phosphate absorption coefficient (PAC) and available phosphate (Truog-P).
Soil samples were air-dried and passed through a 2-mm sieve. Soil particle size distribution was determined by the method of the International Society of Soil Science. Each soil sample was assigned to one of three soil coarse texture groups: 1, 2 and 3, on the basis of its position in the soil texture triangle: sandy loam (SL), loamy sand (LS), and sand (S) as group 3; sandy clay (SC), clay loam (CL), sandy clay loam (SCL), and loam (L) as group 2; and silt loam (SiL), heavy clay (HC), light clay (LiC), silty clay (SiC), and silty clay loam (SiCL) as group 1 (4).
Soil was mixed with water or 1M KCl solution at a ratio of 1 part soil (dry weight) to 2.5 parts liquid (volume); the suspension was stirred for 1 h and allowed to settle for 20 min; pH was then measured with a pH meter. T-N and T-C were measured using an NC analyzer (Sumigraph NC-220F; Sumika Chemical Analysis Service, Osaka, Japan). The C/N ratio was calculated as T-C ÷ T-N. PAC, which is used as a criterion for defining the Andosol group in the Japanese soil classification system (36), was determined by the ammonium phosphate method: In this method, 25 g of soil (dry weight) and 50 mL of 25 g L−1 ammonium phosphate solution (pH = 7) were placed in a 100-mL flask and shaken for 24 h. After centrifugation at 2380xg and filtration (Filter paper No. 5B; ADVANTEC, Tokyo, Japan), the concentration of residual phosphate in the filtrate was then determined by colorimetry. Available phosphate was analyzed by the Truog method: 0.5 g of soil (dry weight) and 400 mL 0.001 M sulfuric acid were placed in a 200-mL flask, shaken for 30 min, and then filtered. The concentration of phosphate in the filtrate was determined by colorimetry.
Environmental metadata
We collected environmental data including temperature, precipitation, and latitudes at the soil sampling sites. Temperature was the mean annual temperature, and precipitation was the mean annual precipitation (Japan Meteorological Agency; http://www.jma.go.jp/jma/menu/menureport.html). Latitudes at the soil sampling sites were expressed in decimal format.
Principal component analysis
PCA was performed with Canoco 4.5 software for Windows (Microcomputer Power, Ithaca, NY, USA). The ordination of soil samples was performed using soil analysis data and other environmental data as variables. Logarithms of the respective values of T-N, T-C, C/N, PAC, Truog-P, temperature, and precipitation were analyzed by PCA.
Determination of N2O reductase activity
The 245 representative isolates were grown in HM broth at 30°C for 7 d. Five milliliters of each cell culture (~109 cells mL−1) was then centrifuged at 10,000xg for 3 min. Collected cells were resuspended with sterilized distilled water and collected by centrifugation again. This step was repeated 3 times, and the cells were then resuspended in HMM broth at 109 cells mL−1 in a test tube. The test tube was sealed with a butyl rubber stopper, and the headspace gas was replaced with N2. N2O gas was introduced into the headspace at a final concentration of 0.10% (v/v).
N2O reductase activity was determined 10 h later from the concentration of N2O. If the rate of N2O reduction was >15%, the isolates were regarded as having positive N2O reductase activity. N2O concentrations were measured by a gas chromatograph (GC-17A; Shimadzu, Kyoto, Japan) equipped with a 63Ni electron capture detector and CP-PoraBOND Q capillary column (internal diameter, 0.32 mm; length, 25 m; Varian, Palo Alto, CA, USA) as described previously (27, 28).
Accession numbers of DNA sequences
The DDBJ/EMBL/GenBank accession numbers of the 16S-23S rRNA ITS regions of the isolates in the present study were from AB983890 to AB984104 and from AB985604 to AB985606 (Table S3).
Results
nosZ genotypes of indigenous soybean bradyrhizobia
A total of 1639 indigenous bradyrhizobia were isolated from the soybean nodules that formed following the inoculation with the 32 soil samples (Tables 1 and S1). PCR analysis specific to nodC of B. japonicum (15) suggested that 1556 isolates were nodC-possessing bradyrhizobia that were able to nodulate soybean plants (Fig. 1, Table S1). The subsequent diagnostic nosZ-specific PCR clearly showed the nosZ genotype because the quality of the DNA lysates had been verified by nodC PCR amplification (15). The isolates were classified as the nosZ+/nodC+ genotype (855 isolates) or nosZ−/nodC+ genotype (701 isolates) (Table S1).

Results were expressed as the incidence (percentage) of nosZ− and nosZ+ isolates among the total isolates tested in each soil sample (Fig. 2). The incidence depended largely on the soil sample: six soil samples (MY2, TS5, KW2, HK5, HK7, and HK9; all Andosols) exclusively harbored nosZ− isolates, while four samples (MY1, TS2, TS1, and KS2; all Gleysols) harbored only nosZ+ isolates. The eleven soil samples in which nosZ− isolates significantly dominated (P < 0.05, by the χ2 test; indicated by * in Fig. 2) were all classified as Andosols. On the other hand, most of the soil samples significantly dominated by nosZ+ isolates (17 samples, indicated by # in Fig. 2) were classified as Gleysols (15 samples) and Fluvisols (1 sample).
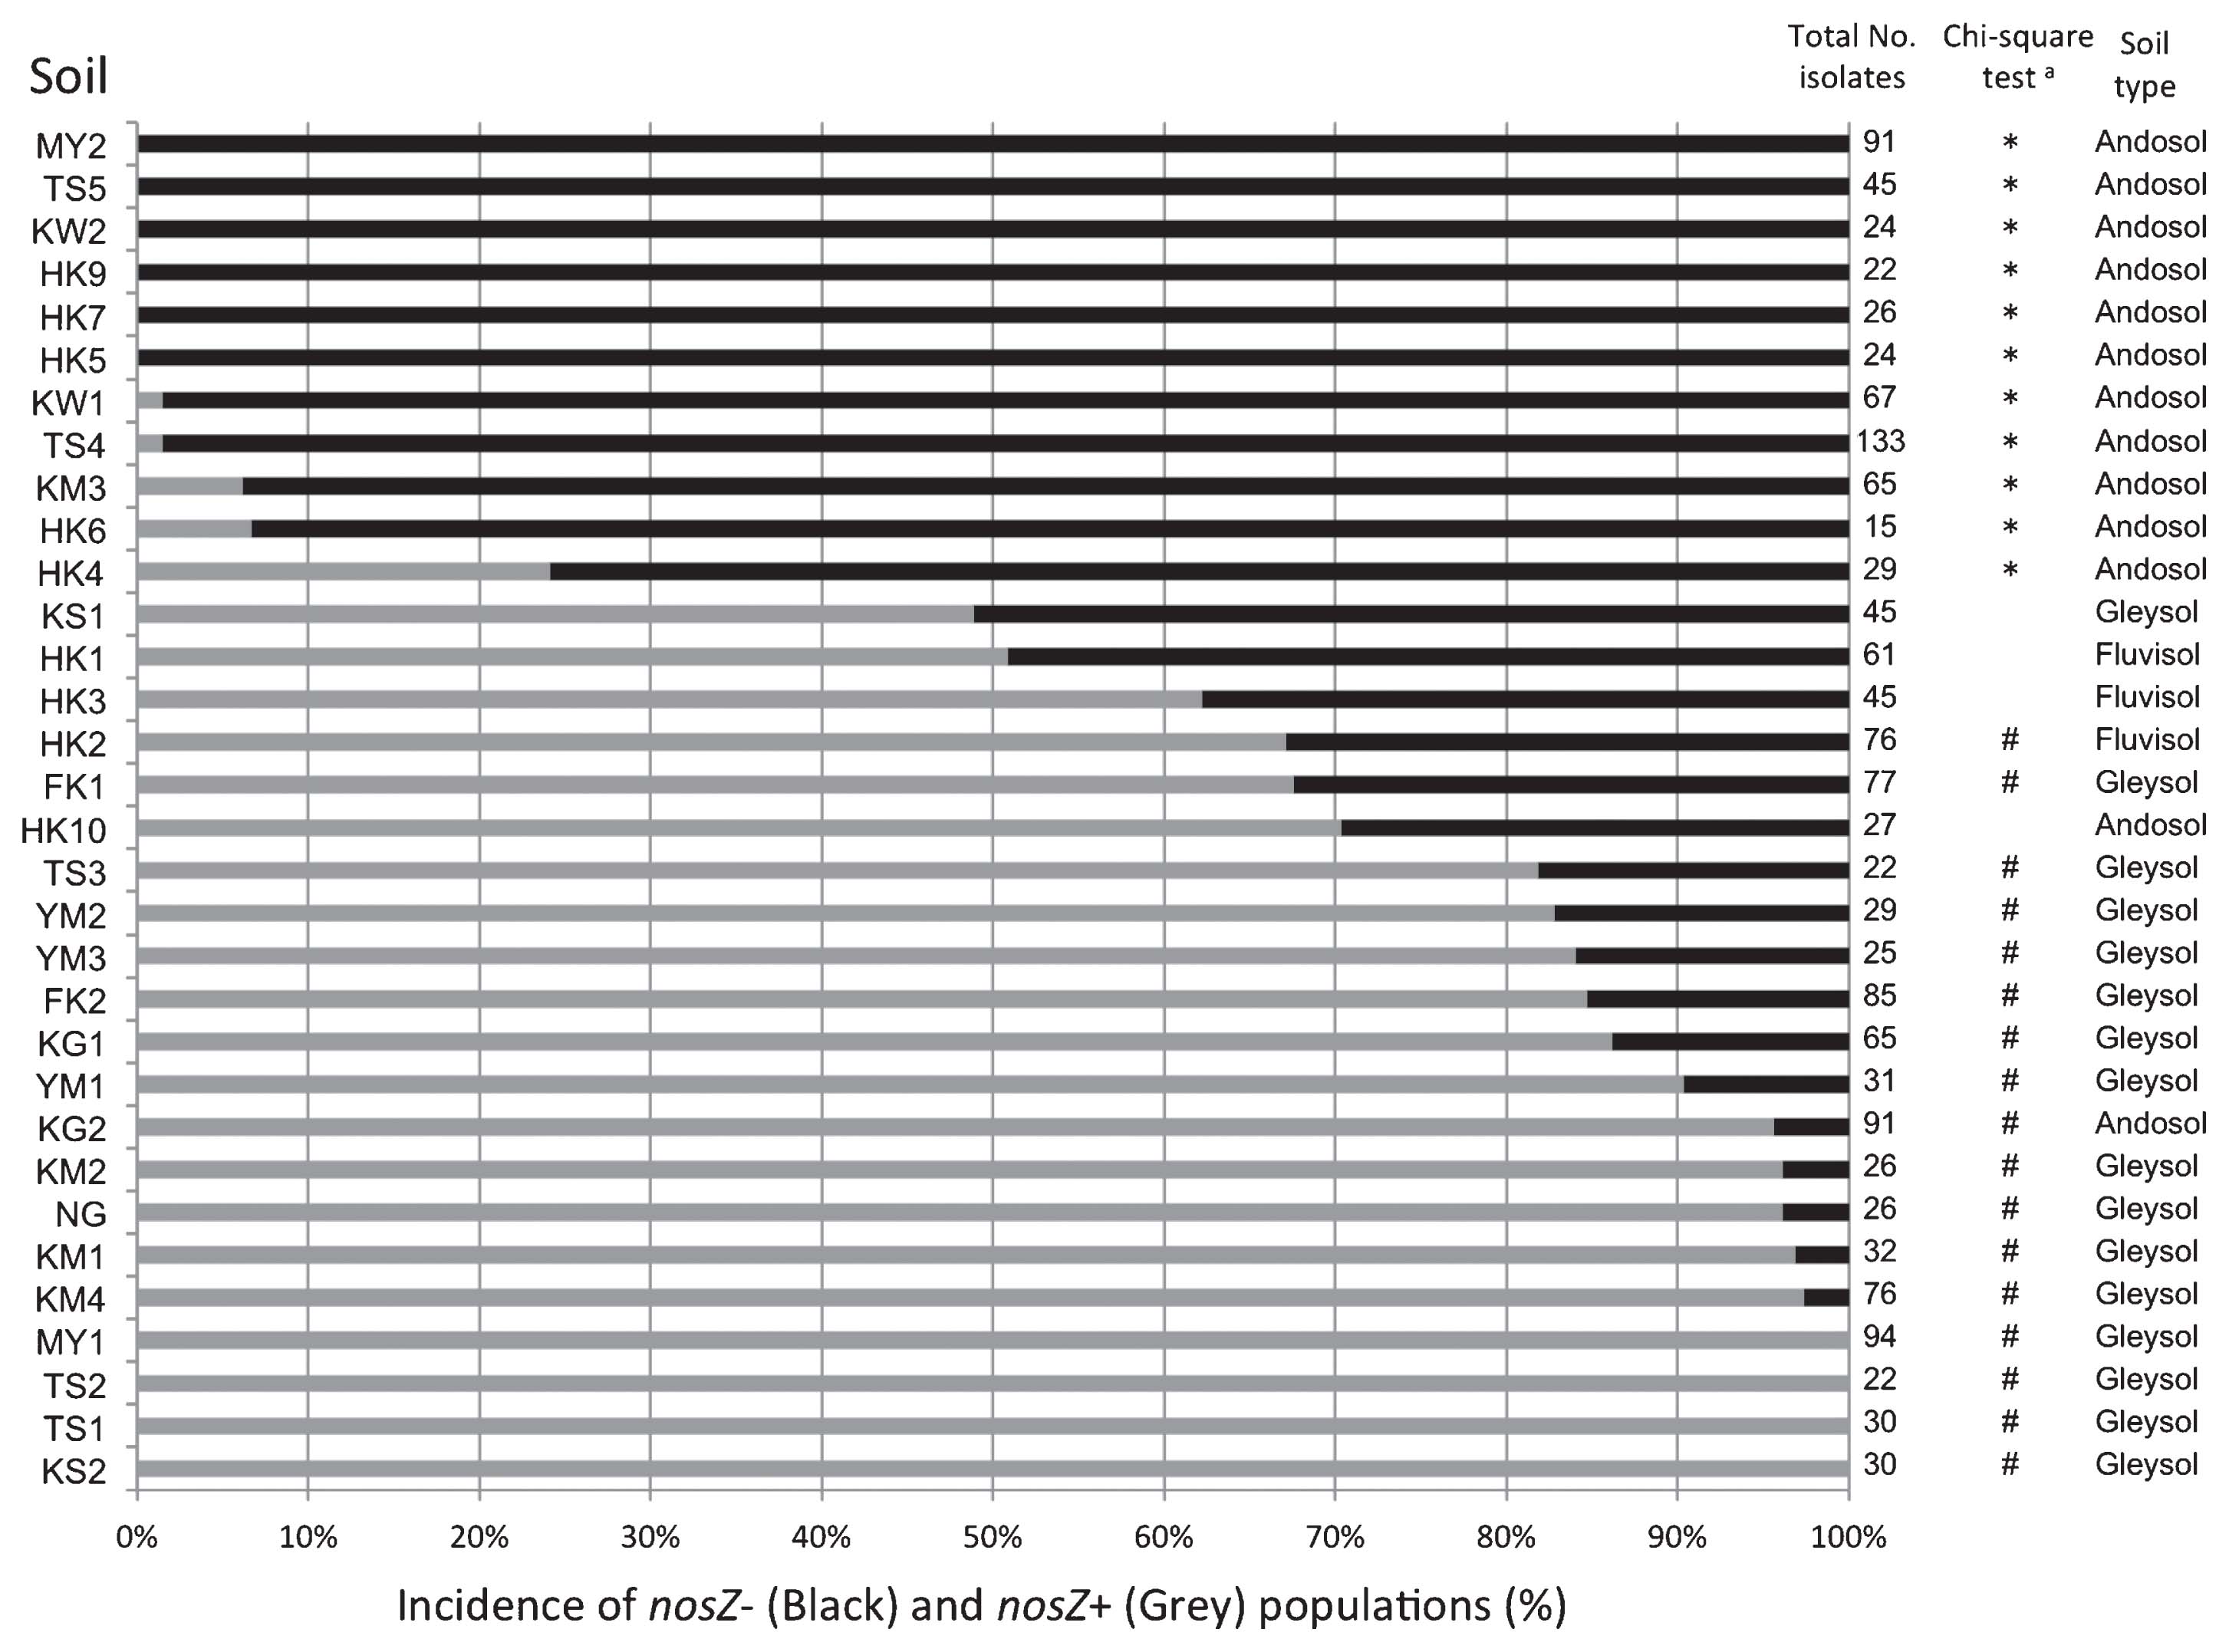
Andosols, developed from volcanic ash, generally show properties distinct from other soils such as alluvial soils; e.g., they are black with high water permeability, low bulk density, high carbon (humus) content, high PAC, and low pH, especially non-allophanic Andosols (36). Therefore, it is possible that the differences observed in the nosZ genotypes of soybean bradyrhizobia could be attributed to these soil properties because bacteria survive as soil microorganisms when host plants are absent.
Environmental factors correlated with the nosZ genotype
To explore the soil properties and other environmental factors that correlated with the incidence of nosZ genotypes, we conducted a Principal component analysis (PCA) using nosZ genotype data (Fig. 2) and soil & environmental metadata for each of the soil samples (Table S2). Among the 32 soil samples tested, the 11 samples dominated by nosZ− (Fig. 2) formed a discrete cluster (solid black dots enclosed by a dashed ellipse; Fig. 3). In the correlations between the nosZ− genotype with soil & environmental variables (shown by arrows in Fig. 3), the directions and lengths of the arrows indicated that T-N, T-C, and PAC were major factors that contributed to the dominance of the nosZ− genotype of soybean bradyrhizobia in the soil (Fig. 3). It is also likely that pH (H2O), pH (KCl), and C/N ratio were minor factors that contributed to its dominance.

Andosols possess high T-C and T-N contents owing to their high humus content and have a high PAC (36). The PCA results also supported Andosols favoring nosZ− strains.
Phylogenetic analysis
A phylogenetic tree was constructed from the ITS sequences of the 245 representative isolates along with several reference strains (Figs. 4 and S1, Table S3). The ITS sequences of the 245 isolates generated 11 operational taxonomic units (OTUs) with ≥99% homology. A total of 237 isolates with OTUs S1 to S7 belonged to B. japonicum, and 8 isolates with OTUs S8 to S11 belonged to B. elkanii (Figs. 4 and S1). Therefore, most isolates were B. japonicum (97%) possibly because our primers were designed for B. japonicum and had a few mismatches against the ITS regions of B. elkanii (15). B. japonicum members were subdivided into the clusters BJ1 (USDA110 group) and BJ2 (USDA6 group) (13). A recent study proposed that the members in clusters BJ1 and BJ2 could be reclassified as B. diazoefficiens and B. japonicum, respectively (6). A comparison with the reference strains USDA110 (BJ1), USDA122 (BJ1), USDA6 (BJ2), T7 (BJ2), and T9 (BJ2) indicated that the isolates with OTU S1 fell exclusively into cluster BJ1 (Fig. 4). The isolates with OTUs S2 to S7 belonged to cluster BJ2 (Fig. 4).

Cluster BJ1 comprised 145 isolates: 125 nosZ+ isolates (86%) and 20 nosZ− isolates (14%). In cluster BJ2, all 92 isolates (100%) showed the nosZ− genotype. Therefore, nosZ+ isolates were confined to BJ1 (B. diazoefficiens) (6). Regarding the nosZ genotypes, 125 nosZ+ and 112 nosZ− isolates of B. japonicum fell into clusters BJ1 and BJ2: 125 of the nosZ+ isolates (100%) fell into BJ1 and 92 of the nosZ− isolates (82%) fell into BJ2 (Fig. 4). These results showed that the nosZ+ and nosZ− isolates of B. japonicum fell mainly into the BJ1 and BJ2 groups, respectively.
By focusing on soil types, we found that alluvial soils mainly carried members of the BJ1 cluster of B. japonicum with nosZ, whereas Andosols mainly contained members of the BJ2 cluster without nosZ.
N2O reductase activity
In the test tube assay to determine the N2O reductase activities (NosZ phenotype) of the 245 representative isolates (Fig. 1, Table S3), this activity was not detected in any of the 120 isolates showing the nosZ− genotype as determined by nosZ-specific PCR (black squares in Fig. S1). On the other hand, activity was detected in 122 of the 125 isolates showing the nosZ+ genotype (Fig. S1, Table S3). Three isolates carried nosZ, but did not show N2O reductase activity by the test tube assay, which may have been due to their very low activities or low expression of the nos gene cluster. However, the NosZ phenotype correlated well with the nosZ genotype in most isolates (242 of the 245 isolates tested; 99%).
Discussion
Soybean bradyrhizobia with the nosZ gene are able to mitigate N2O emissions from soils (15). Our primary objective was to examine how frequently the nosZ− genotype appeared in soybean fields and determine whether soil properties and environmental factors affected the nosZ genotype of indigenous soybean bradyrhizobia. The B. japonicum populations lacking both nosZ and N2O reductase activity were dominant in Andosols (Figs 2 and 3). On the other hand, nosZ+ populations were mainly dominant in alluvial soils (Gleysols and Fluvisol) (Figs 2 and 3). Therefore, Andosol could be a target soil type for a Bradyrhizobium-based N2O mitigation strategy, at least in soybean fields in Japan (2).
We proposed two possible explanations for how the soil type (Andosol vs. alluvial soil) significantly changed the incidence of nosZ+ and nosZ− populations in indigenous B. japonicum: (i) selection by N2O respiration and (ii) genomic determinants for soil adaptation.
N2O respiration in B. japonicum USDA110 occurs under anaerobic conditions and supports anaerobic growth by using N2O as an electron acceptor (13, 28). In alluvial soils such as Gleysols, anaerobic environments form easily between soil particles following precipitation, and because the bulk density of Andosols is lower than that of alluvial soils, Andosols often provide a more aerobic soil environment (36). Thus, selection by N2O respiration would be more severe in alluvial soils than in Andosols because N2O respiration is induced under anaerobic conditions (28). Therefore, selection for N2O respiration may confer advantages to nosZ+ populations in terms of energy acquisition for their growth in alluvial soils. On the other hand, N2O respiration confers little or no advantage on Andosols, resulting in the dominance of nosZ− populations in Andosols.
The second explanation is the presence of unknown determinants for adaptation to different soil types. Although the sequence and gene compositions of symbiosis islands are well conserved within soybean bradyrhizobia, the core genome compositions of USDA110 (BJ1) and USDA6 (BJ2) were previously reported to differ (17). In addition, in soil microcosm experiments, a BJ1 strain (A1017ks) survived better in Fluvisol than in Andosol (19). To examine the hypothesis of “determinants for soil adaptation”, soil microcosm experiments are needed for comparisons between nosZ+ and nosZ− strains of B. japonicum in the future.
Phylogenetically, the nosZ+ and nosZ− isolates of B. japonicum fell mainly into BJ1 and BJ2 clusters, respectively (Fig. 4). These results were consistent with previous findings (14, 27). Genomic comparisons between USDA110 (BJ1) and USDA6 (BJ2) indicated that the position of the nos gene cluster (nosRZDFYLX) on the USDA110 genome corresponded to a typical genomic island flanking to trnS-GGA on the USDA6 genome, suggesting that the nos gene cluster is a mobile genomic island on the USDA110 genome (17). In the present study, the nosZ+ genotype was confined to the BJ1 cluster (Fig. 4). Thus, the presumptive “nos genomic island” was likely to have been acquired during the evolution of the BJ1 lineage.
In the present study, we systemically obtained and characterized many isolates of soybean bradyrhizobia. Sanchez et al. (28) recently found that the nitrate-sensing NasST system controlled nosZ gene expression in B. japonicum: Artificial nasS mutations both induced nosZ expression and enhanced the N2O reductase activity of B. japonicum via NasT (28). Our culture collection of soybean bradyrhizobia may be used for screening of nasS natural mutations. In addition to contributing to research on denitrification genes and their regulatory genes, this culture collection will contribute to research on the interactions between soybean plants and bradyrhizobia as a bioresource.
Acknowledgements
This study was supported by the Bio-oriented Technology Research Advancement Institution (BRAIN) of the Ministry of Agriculture, Forestry and Fisheries of Japan, and by Grants-in-Aid for Scientific Research (A) 23248052 and 26252065 from the Ministry of Education, Culture, Sports, Science and Technology in Japan. We deeply thank T. Ezawa (Hokkaido University), T. Kaji (Tokachi Agricultural Cooperative Association), M. Saito (Tohoku University), H. Shiono (Yamagata Integrated Agricultural Research Center), Y. Shiratori (Niigata Agricultural Research Institute), H. Mizukami (Kumamoto Prefectural Agricultural Research Center), T. Yamakawa (Kyushu University), M. Araki (Fukuoka Agricultural Research Center), M. Matsumori (Kumamoto Prefectural Agricultural Research Center), N. Gunjikake (Kumamoto Prefectural Agricultural Research Center), T. Mochida (Kagoshima Prefectural Institute for Agricultural Development), and K. Yagi (National Institute for Agro-Environmental Science) for providing field soils and information.
References
- 1. Baggs, EM. 2011. Soil microbial sources of nitrous oxide: recent advances in knowledge, emerging challenges and future direction. Curr Opin Env Sust. 3:321-327.
- 2. Bao, Z, Y Ikunaga, Y Matsushita, et al. 2012. Combined analyses of bacterial, fungal and nematode communities in andosolic agricultural soils in Japan. Microbes Environ. 27:72-79.
- 3. Bedmar, EJ, EF Robles, and MJ Delgado. 2005. The complete denitrification pathway of the symbiotic, nitrogen-fixing bacterium Bradyrhizobium japonicum. Biochem Soc Trans. 33:141-144.
- 4. Brady, NC. 1990. The Nature and Properties of Soils (10th ed). Macmillan Publishing Co, New York, USA.
- 5. Cole, MA, and GH Elkan. 1973. Transmissible resistance to penicillin G, neomycin, and chloramphenicol in Rhizobium japonicum. Antimicrob Agents Chemother. 4:248-253.
- 6. Delamuta, JR, RA Ribeiro, E Ormeño-Orrillo, IS Melo, E Martínez-Romero, and M Hungria. 2013. Polyphasic evidence supporting the reclassification of Bradyrhizobium japonicum group Ia strains as Bradyrhizobium diazoefficiens sp. nov. Int J Syst Evol Microbiol. 63:3342-3351.
- 7. Hayatsu, M. 2014. A novel function of controlled-release nitrogen fertilizers. Microbes Environ. 29:121-122.
- 8. Hénault, C, A Grossel, B Mary, M Roussel, and J Leonard. 2012. Nitrous oxide emission by agricultural soils: a review of spatial and temporal variability for mitigation. Pedosphere. 22:426-433.
- 9. Inaba, S, K Tanabe, S Eda, S Ikeda, A Higashitani, H Mitsui, and K Minamisawa. 2009. Nitrous oxide emission and microbial community in the rhizosphere of nodulated soybeans during the late growth period. Microbes Environ. 24:64-67.
- 10. Inaba, S, F Ikenishi, M Itakura, M Kikuchi, S Eda, N Chiba, C Katsuyama, Y Suwa, H Mitsui, and K Minamisawa. 2012. N2O emission from degraded soybean nodules depends on denitrification by Bradyrhizobium japonicum and other microbes in the rhizosphere. Microbes Environ. 27:470-476.
- 11. Ishii, S, S Ikeda, K Minamisawa, and K Senoo. 2011. Nitrogen cycling in rice paddy environments: Past achievements and future challenges. Microbes Environ. 26:282-292.
- 12. Isobe, K, and N Ohte. 2014. Ecological perspectives on microbes involved in N-cycling. Microbes Environ. 29:4-16.
- 13. Itakura, M, K Tabata, S Eda, H Mitsui, K Murakami, J Yasuda, and K Minamisawa. 2008. Generation of Bradyrhizobium japonicum mutants with increased N2O reductase activity by selection after introduction of a mutated dnaQ gene. Appl Environ Microbiol. 74:7258-7264.
- 14. Itakura, M, K Saeki, H Omori, et al. 2009. Genomic comparison of Bradyrhizobium japonicum strains with different symbiotic nitrogen-fixing capabilities and other Bradyrhizobiaceae members. ISME J. 3:326-339.
- 15. Itakura, M, Y Uchida, H Akiyama, et al. 2013. Mitigation of nitrous oxide emissions from soils by Bradyrhizobium japonicum inoculation. Nat. Clim Change. 3:208-212.
- 16. IUSS Working Group WRB. 2006. World reference base for soil resources 2006. World Soil Resources Reports No. 103. FAO, Rome.
- 17. Kaneko, T, H Maita, H Hirakawa, N Uchiike, K Minamisawa, A Watanabe, and S Sato. 2011. Complete genome sequence of the soybean symbiont Bradyrhizobium japonicum strain USDA6T. Genes (Basel). 2:763-787.
- 18. Kondo, K, K Yoshimatsu, and T Fujiwara. 2012. Expression, and molecular and enzymatic characterization of Cu-containing nitrite reductase from a marine ammonia-oxidizing gammaproteobacterium, Nitrosococcus oceani. Microbes Environ. 27:407-412.
- 19. Menyah, MK, and K Sato. 1996. Survival of inoculant Bradyrhizobium japonicum in an Andosol. Biol. Fertil Soils. 23:105-109.
- 20. Okubo, T, T Tsukui, H Maita, et al. 2012. Complete genome sequence of Bradyrhizobium sp. S23321: Insights into symbiosis evolution in soil oligotrophs. Microbes Environ. 27:306-315.
- 21. Ravishankara, AR, JS Daniel, and RW Portmann. 2009. Nitrous oxide (N2O): the dominant ozone-depleting substance emitted in the 21th century. Science. 326:123-125.
- 22. Ryuda, N, T Hashimoto, D Ueno, K Inoue, and T Someya. 2011. Visualization and direct counting of individual denitrifying bacterial cells in soil by nirK-targeted direct in situ PCR. Microbes Environ. 26:74-80.
- 23. Saeki, Y, S Ozumi, A Yamamoto, Y Umehara, M Hayashi, and GC Sigua. 2010. Changes in population occupancy of bradyrhiozbia under different temperature regimes. Microbes Environ. 25:309-312.
- 24. Saeki, Y, S Shiro, T Tajima, A Yamamoto, R Sameshima-Saito, T Sato, and T Yamakawa. 2013. Mathematical ecology analysis of geographical distribution of soybean-nodulating bradyrhizobia in Japan. Microbes Environ. 28:470-478.
- 25. Saitou, N, and M Nei. 1987. The neighbor-joining method: a new method for reconstructing phylogenetic trees. Mol Biol Evol. 4:406-425.
- 26. Sameshima-Saito, R, K Chiba, J Hirayama, M Itakura, H Mitsui, S Eda, and K Minamisawa. 2006. Symbiotic Bradyrhizobium japonicum reduces N2O surrounding the soybean root system via nitrous oxide reductase. Appl Environ Microbiol. 72:2526-2532.
- 27. Sameshima-Saito, R, K Chiba, and K Minamisawa. 2006. Correlation of denitrifying capability with the existence of nap, nir, nor and nos genes in diverse strains of soybean bradyrhizobia. Microbes Environ. 21:174-184.
- 28. Sanchez, C, M Itakura, T Okubo, T Matsumoto, H Yoshikawa, A Gotoh, M Hidaka, T Uchida, and K Minamisawa. 2014. The nitrate-sensing NasST system regulates nitrous oxide reductase and periplasmic nitrate reductase in Bradyrhizobium japonicum. Environ Microbiol. 16:3263-3274.
- 29. Schloss, PD, SL Westcott, T Ryabin, et al. 2009. Introducing mothur: open-source, platform-independent, community-supported software for describing and comparing microbial communities. Appl Environ Microbiol. 75:7537-7541.
- 30. Shimomura, Y, S Morimoto, Y Takada-Hoshino, Y Uchida, H Akiyama, and M Hayatsu. 2012. Comparison among amoA primers suited for quantification and diversity analyses of ammonia-oxidizing bacteria in soil. Microbes Environ. 27:94-98.
- 31. Shiro, S, A Yamamoto, Y Umehara, M Hayashi, N Yoshida, A Nishiwaki, T Yamakawa, and Y Saeki. 2012. Effect of Rj genotype and cultivation temperature on the community structure of soybean-nodulating bradyrhizobia. Appl Environ Microbiol. 78:1243-1250.
- 32. Shiro, S, S Matsuura, R Saiki, GC Sigua, A Yamamoto, Y Umehara, M Hayashi, and Y Saeki. 2013. Genetic diversity and geographical distribution of indigenous soybean-nodulating bradyrhizobia in the United States. Appl Environ Microbiol. 79:3610-3618.
- 33. Sugawara, M, and MJ Sadowsky. 2013. Influence of elevated atmospheric carbon dioxide on transcriptional responses of Bradyrhizobium japonicum in the soybean rhizoplane. Microbes Environ. 28:217-227.
- 34. Suzuki, K, H Oguro, T Yamakawa, A Yamamoto, S Akao, and Y Saeki. 2008. Diversity and distribution of indigenous soybean-nodulating rhizobia in the Okinawa Islands, Japan. Soil Sci Plant Nutr. 54:237-246.
- 35. Tago, K, S Ishii, T Nishizawa, S Otsuka, and K Senoo. 2011. Phylogenetic and functional diversity of denitrifying bacteria isolated from various rice paddy and rice-soybean rotation fields. Microbes Environ. 26:30-35.
- 36. Takahashi, T, and S Shoji. 2002. Distribution and classification of volcanic ash soils. Global Environ Res. 6:83-97.
- 37. Tamura, K, J Dudley, M Nei, and S Kumar. 2007. MEGA4: Molecular Evolutionary Genetics Analysis (MEGA) software version 4.0. Mol Biol Evol. 24:1596-1599.
- 38. Thompson, JD, DG Higgins, and TJ Gibson. 1994. CLUSTAL W: improving the sensitivity of progressive multiple sequence alignment through sequence weighting, position-specific gap penalties and weight matrix choice. Nucleic Acids Res. 22:4673-4680.
- 39. Yoshida, M, S Ishii, S Otsuka, and K Senoo. 2010. nirK-harboring denitrifiers are more responsive to denitrification-inducing conditions in rice paddy soil than nirS-harboring bacteria. Microbes Environ. 25:45-48.
- 40. Yoshida, M, S Ishii, D Fujii, S Otsuka, and K Senoo. 2012. Identification of active denitrifiers in rice paddy soil by DNA- and RNA-based analyses. Microbes Environ. 27:456-461.
- 41. Zhang, YM, YJ Li, WF Chen, ET Wang, CF Tian, QQ Li, YZ Zhang, XH Sui, and WX Chen. 2011. Biodiversity and biogeography of rhizobia associated with soybean plants grown in the North China Plain. Appl Environ Microbiol. 77:6331-6342.
