Abstract
Carbonyl sulfide (COS) is one of the major sources of stratospheric sulfate aerosols, which affect the global radiation balance and ozone depletion. COS-degrading microorganisms are ubiquitous in soil and important for the global flux of COS. We examined the sulfur isotopic fractionation during the enzymatic degradation of COS by carbonyl sulfide hydrolase (COSase) from Thiobacillus thioparus THI115. The isotopic fractionation constant (34ɛ value) was −2.2±0.2‰. Under experimental conditions performed at parts per million by volume level of COS, the 34ɛ value for intact cells of T. thioparus THI115 was −3.6±0.7‰, suggesting that, based on Rees’ model, the 34ɛ value mainly depended on COS transport into the cytoplasm. The 34ɛ value for intact cells of T. thioparus THI115 was similar to those for Mycobacterium spp. and Williamsia sp., which are known to involve the conserved region of nucleotide sequences encoding the clade D of β-class carbonic anhydrase (β-CA) including COSase. On the other hand, the 34ɛ value was distinct from those for bacteria in the genus Cupriavidus. These results provide an insight into biological COS degradation, which is indispensable for estimating the COS global budget based on the isotope because of the significant contribution of COS degradation by microorganisms harboring β-CA family enzymes.
Carbonyl sulfide (COS) is the most abundant sulfur compound in the troposphere at nearly 500 parts per trillion by volume (pptv) (8, 53). Due to its chemical stability, some COS in the troposphere is transported to the stratosphere and is ultimately converted to sulfate by photolysis or a reaction with O or OH radical (7, 9). The resultant sulfate is one of the major sources of the stratospheric sulfate aerosols influencing the Earth’s radiation balance and ozone depletion (9, 75). On the other hand, COS has been proposed as a promising tracer to estimate gross primary production by plants (5, 70, 77). Thus, it is imperative to understand the global budget of COS in order to estimate climate change by stratospheric sulfate aerosols in the future. However, estimates of COS emission and uptake values remain unclear (42).
Major sinks of atmospheric COS are vegetation and soil, and soil microorganisms, such as bacteria and fungi, are considered to play an important role in COS degradation in soil because many isolates belonging to diverse taxonomic groups exhibit strong COS-degrading abilities (48, 56). β-class carbonic anhydrase (β-CA, EC 4.2.1.1) (57), COSase (55), and carbon disulfide (CS2) hydrolase (EC 4.4.1.27) (71, 72) exhibit high COS-degrading activities and belong to the β-CA family of enzymes, which have similar amino acid sequences and X-ray crystal structures. Among these enzymes, COSase purified from Thiobacillus thioparus THI115 is the only bacterial enzyme with characterized catalytic properties and an elucidated X-ray crystal structure (55). T. thioparus is a chemolithoautotrophic sulfur-oxidizing bacterium that widely inhabits soil and freshwater (37). T. thioparus THI115 was isolated from activated sludge used for the wastewater treatment of a coke-oven factory, and can grow using thiocyanate, which is an ingredient in the wastewater, as a sole energy source (34). During thiocyanate degradation, COS is produced as a reaction product of thiocyanate hydrolase (EC 3.5.5.8), and the resultant COS is then hydrolyzed to hydrogen sulfide and carbon dioxide by COSase, with COS ultimately being oxidized to sulfate (34, 35, 38, 55). Thus, COSase is an important enzyme in energy production by T. thioparus THI115.
An isotope analysis represents a promising tool for tracing the global dynamics of atmospheric trace gases that influence the Earth’s climate (4, 27). In order to apply an isotope analysis and interpret changes in isotopic compositions on an observational scale, the assessment of isotopic fractionation in chemical/biological processes is an essential step. In this context, studies examining isotopic fractionation in each process have involved incubation experiments with isolates or natural environmental samples. However, large variabilities have been reported in isotopic fractionation factors, even for the same reactions, due to differences in the experimental conditions used (e.g. [32, 83] for sulfur oxidation). Thus, the examination of isotopic fractionation via isolated enzymes is important for comparing and discussing the factors controlling it. To the best of our knowledge, the study of isotopic fractionation by isolated enzymes involved in biogeochemical reactions has been limited to enzymes such as RubisCO for photosynthesis (59), glycolate oxidase for photorespiration (18), nitrate reductase (33) and nitric oxide reductase (81) for denitrification, hydroxylamine oxidoreductase (81) for nitrification, nitrogenase (76) for nitrogen fixation, and glutamate dehydrogenase (80) and glutamine synthetase (82) for ammonium assimilation. In the case of biogeochemical sulfur cycles, isotopic fractionation has only been examined using dissimilatory sulfite reductase (DsrAB), one of the important enzymes in microbial sulfate reduction (43). Although previous studies reported isotopic fractionation using isolates and/or natural samples (6, 13–16, 19, 26 [cited from 6 and 83], 28–32, 41 [cited from 83], 50, 51 [cited from 6 and 83], 54, 79, 83), an enzyme level analysis has not yet been conducted on isotopic fractionation for sulfur oxidation.
Online gas chromatograph-isotope-ratio mass spectrometry (GC-IRMS) for COS sulfur isotopic measurement was recently developed and has the ability to measure sulfur isotopic compositions at nanomole COS levels (22). By using this method, isotopic fractionation constants for COS degradation at 4,000 parts per million by volume (ppmv) COS were assessed using chemoorganotrophic COS-degrading soil bacteria (36) isolated by Kato et al. (29). Four strains of Mycobacterium spp., Williamsia sp., and two strains of Cupriavidus spp. showed a preference for the degradation of CO32S over CO34S, with isotopic fractionation constant (34ɛ) values of −3.99 to −3.56‰, −3.74‰, and −2.38 to −2.09‰, respectively. Although the number of isolates used in these experiments was limited, these findings suggest that the differences observed in 34ɛ values among the isolated bacteria are highly dependent on the genus. Although experiments at very low concentrations, such as atmospheric COS, cannot be conducted for technical reasons, elucidating the mechanisms controlling isotopic fractionation will contribute to estimations of isotopic fractionation by microbial COS degradation in natural environments. Therefore, the isotopic fractionation constants of COSase, which is a unique enzyme for COS degradation identified in the chemolithoautotrophic sulfur-oxidizing bacterium of T. thioparus THI115, as well as those of intact cells of this bacterium were assessed in the present study.
We examined the sulfur isotopic fractionation of COS by COSase in consideration of the importance of β-CA family enzymes to the global COS budget. Furthermore, sulfur isotopic fractionation in COS degradation by intact cells of T. thioparus THI115 was investigated in order to clarify the details of isotopic fractionation for the transport of COS into the cytoplasm and its degradation by COSase. The mechanisms underlying isotopic fractionation in bacterial COS degradation are also discussed using isotopic fractionation constants in addition to those of chemoorganotrophic bacteria reported previously (29).
Materials and Methods
Purification of COSase
COSase used in the present study was prepared as described previously (55), except that glutathione S-transferase (GST)-fused COSase bound to Glutathione Sepharose 4B (GE Healthcare, Chicago, IL, USA) was rinsed thoroughly, and the enzyme solution was filtered with a membrane filter before being applied to an ion exchange column. Briefly, the GST-fused COSase expression vector pCQQ15, a COSase gene-inserted pGEX-6P-1 (GE Healthcare), was transformed into Escherichia coli Rosetta-gami B (Merck Millipore, Billerica, MA, USA). The expression of GST-fused COSase was induced by the addition of isopropyl β-d-1-thiogalactopyranoside to the liquid culture, and cells were lysed by lysozyme. GST-fused COSase was captured by Glutathione Sepharose 4B, precipitated at 500×g at 4°C, and rinsed thoroughly with Factor Xa Cleavage/Capture Buffer (50 mM Tris-HCl, 100 mM NaCl, 5 mM CaCl2, pH 8.0) (Merck Millipore). After the digestion by Factor Xa (Merck Millipore) and capture of Factor Xa by Xarrest Agarose (Merck Millipore), the enzyme solution was filtered using a membrane filter with a pore size of 0.45 μm (Millex-HV Durapore PVDF membrane; Merck Millipore), then applied to a HiTrap Q HP column (1 mL, GE Healthcare). The purified enzyme solution was desalted and concentrated with 50 mM Tris-HCl, pH 8.5 using an Amicon Ultra-15 Centrifugal Filter Unit (Merck Millipore). Protein concentrations were estimated using Lowry’s method with bovine serum albumin as the standard (46).
COS-degrading experiment by COSase
A 68-mL vial (V-50; Nichiden-Rika Glass, Kobe, Japan) was sealed with a butyl rubber stopper, the headspace was replaced with nitrogen, and 3.43 mL of COS (104,000 ppmv with N2 as the balance gas; Taiyo Nippon Sanso, Tokyo, Japan) was then added via a gastight microsyringe to make approximately 5,000 ppmv COS. After stabilizing the inside pressure using a needle, 2 mL of the enzyme solution containing 50 μg of COSase in 50 mM Tris-HCl, pH 8.5 was added to the vial and incubated at 30°C in triplicate. A control without COSase was prepared in order to monitor the non-enzymatic degradation of COS in duplicate. Sampling of the headspace gas was started 5 min after the addition of COSase in order to avoid the disturbance of the headspace gas by the addition of the enzyme solution. Sampling of the headspace gas was performed with a gastight microsyringe, and 30 μL or 50 μL and 1 mL, 2 mL, or 3 mL of the gas was used for the estimation of COS concentrations and GC-IRMS measurements, respectively. The sample for GC-IRMS was transferred into a 5-mL serum bottle (V-5B; Nichiden-Rika Glass) filled with ultrahigh purity He (>99.99995%; Taiyo Nippon Sanso).
Bacterial culture
Fully grown T. thioparus THI115 (NBRC 105750) was prepared in a flask containing 10 mL of mTC10 liquid medium, mineral salts medium supplemented with thiocyanate as its sole energy source, with reciprocal shaking at 120 rpm at 30°C (34, 55). A loopful of precultured cells was inoculated on 10 mL of mTC10 agar slant medium in a glass test tube (20 cm in length, 2 cm in inner diameter). It is important to discriminate COS degradation by T. thioparus THI115 from the abiotic hydrolysis of COS with water (10, 12). Therefore, slant, not liquid medium was employed for the cultivation of the bacterium in order to reduce abiotic effects on the added COS as described below. After an incubation at 30°C for 25 d to achieve full growth, the COS-degrading experiment was performed.
COS-degrading experiment by T. thioparus THI115
After the full growth of T. thioparus THI115, the silicon sponge cap was changed to a butyl rubber stopper to seal the tube in triplicate. Based on the chemolithoautotrophic characteristics of this bacterium, the headspace of 40 mL of the tube was replaced with 80% nitrogen, 20% oxygen, and 0.03% carbon dioxide. An uninoculated control was prepared to compare COS degradation in duplicate. Tubes were incubated at 30°C and the COS-degrading reaction was initiated by injecting 104,000 ppmv COS into the headspace via a gas-tight microsyringe to make approximately 4,000 ppmv COS. Sampling of the headspace gas using a gas-tight microsyringe was started 20 min after the addition of COS in order to prevent the disturbance of the headspace gas by the addition of COS. After approximately 70% of the initially added COS was degraded, the number of cells that grew on slant medium was counted. The rate constant k (h−1) of COS degradation was defined based on fitting the degradation curve to the exponential function C(t)=C0e−kt, where C(t) is the concentration of COS at time t (h) and C0 is the initial COS concentration.
COS concentration measurements
COS concentrations were estimated by directly injecting the headspace gas into a gas chromatograph (GC-14B; Shimadzu, Kyoto, Japan) as described previously (29). Briefly, the gas chromatograph was equipped with a flame photometric detector and glass column (2.0 mm in length, 3.0 mm in inner diameter) packed with Sunpak-S (Shimadzu). N2 gas (Ichimura Sanso, Tokyo, Japan) was used as the carrier gas at a flow rate of 100 mL min−1. The temperatures for the injector, column, and detector were 190°C, 60°C, and 190°C, respectively. COS concentrations were corrected by taking into account decreases caused by sampling. The relative standard deviation was within 3%.
Stable isotope measurement
The sulfur isotopic composition of COS was measured using online GC-IRMS with measurements of the fragment ion S+ from COS, as developed previously (22). Briefly, the carrier gas was He (>99.99995% purity; Taiyo Nippon Sanso) treated with a 5 A Molecular Sieve (Sigma-Aldrich, Tokyo, Japan) to remove any trace contaminants. An aliquot (an amount larger than 8 nmol) of COS in a 5-mL serum bottle was initially trapped in a stainless-steel tube chilled with liquid N2. COS was then desorbed by bringing back to room temperature and transferred by a He flow to a capillary tube chilled with liquid N2. Preconcentrated COS was desorbed by removing the tube from liquid N2 and introduced into the GC equipped with a capillary column (30 m in length, 0.32 mm in inner diameter, and with a thickness of 10 μm, HP-PLOT Q; Agilent Technologies, Santa Clara, CA, USA), and then IRMS (MAT 253; Thermo Fisher Scientific, Bremen, Germany) was performed to measure the fragment ions 32S+, 33S+, and 34S+. Approximately 11 ppmv of COS (Japan Fine Products, Kawasaki, Japan) was used to confirm the accuracy and precision of measurements and the standard deviations for δ33S, δ34S, and Δ33S values of the triplicate measurements were within 0.1‰, 0.1‰, and 0.1‰ during the experimental period of COSase, and 0.6‰, 0.3‰, and 0.5‰ during the experimental period of T. thioparus THI115, respectively.
Cell number
Living and dead cells were enumerated microscopically after live/dead staining (LIVE/DEAD BacLight Bacterial Viability Kit for microscopy; Thermo Fisher Scientific), as described previously (29). Briefly, cells on slant medium were suspended in 0.85% NaCl, collected by centrifugation at 10,000×g for 15 min, and then rinsed twice as described. The pellet was resuspended in 0.85% NaCl and Live/Dead reagent was added to 1 mL of the diluted cell suspension. After 15 min, the cell suspension was filtered onto a polycarbonate black filter (0.2 μm pore size and 25 mm in diameter; Advantec Toyo Kaisha, Tokyo, Japan) treated with 0.01% poly-l-lysine (P8920; Sigma-Aldrich). The cell number was enumerated under a fluorescence microscope (BZ-8000; KEYENCE, Osaka, Japan).
Definition
The isotopic compositions of 33S and 34S values were expressed in δ notations as
|
δ
S
x
=
R
sample
/
R
reference
-
1 |
where Rsample and Rreference are the isotope ratios (xS/32S, where x=33 or 34) of residual COS at the times indicated and initial COS, respectively. In addition, Δ33S value was used to distinguish between mass-dependent fractionation (MDF) and mass-independent fractionation (MIF; or non-mass-dependent fractionation) and defined as deviations from the MDF line, as expressed in the following equation:
|
Δ
S
33
=
δ
S
33
-
[
(
δ
S
34
+
1
)
0.515
-
1
] |
The magnitude of isotopic fractionation during a single unidirectional reaction was expressed using the isotopic fractionation factor α,
where xk (x=33 or 34) and 32k are the reaction rates for the heavy and light isotopes, respectively. The isotopic fractionation constant xɛ (x=33 or 34) is defined as follows:
On the other hand, xɛ can be estimated from the Rayleigh equation according to Mariotti et al. (47),
|
δ
S
x
-
δ
S
x
initial
=
ɛ
x
ln
f |
where f is defined as the ratio of the residual COS concentration at the times indicated divided by the initial COS concentration. MIF can be described as a deviation from MDF in 33S (33E) defined by the MDF law (1, 24), as follows:
Statistical analysis
The rate constant k of COS degradation was calculated using the function SLOPE from Excel for Mac 2011 (version 14.7.2, Microsoft, Redmond, WA, USA). Free software R (version 3.4.1) (R Core Team. 2017. R: A Language and Environment for Statistical Computing. R Foundation for Statistical Computing, Vienna, Austria. URL https://www.R-project.org/) was used to calculate and analyze statistics for the ɛ and 33E values for COS degradation by COSase and T. thioparus THI115. The slope between δ33S or δ34S values and lnf shows the ɛ value, and the ɛ value±SD was calculated based on the least square method passing through an origin using the function summary from R. The resultant values were shown as the mean±SD in triplicate. A t-test was performed for the comparison of ɛ values between COSase and T. thioparus THI115 using the function t.test from R. P values<0.05 were considered to indicate significance.
Results and Discussion
Sulfur isotopic fractionation for COS degradation by COSase
COSase degraded more than 70% of the initially supplemented COS within 2 h under the experimental conditions employed (Fig. 1A). Degradation curves fit the exponential function and the rate constant was 0.79±0.10 h−1 (r2=1.00), indicating that COS degradation by COSase was a first order reaction within the range of the COS concentrations used in the present study (Fig. 1A and Table 1). On the other hand, control batches without COSase showed slight variations in COS concentrations (Fig. 1A). Since no H2S was detected, we attributed these variations to experimental errors, not chemical hydrolysis. COS degradation by COSase relative to the control batches was very fast; therefore, variations were not considered to affect the assessment of isotopic fractionation. The δ33S and δ34S values in residual COS increased during COS degradation, and the slope between δ33S or δ34S values and lnf showed that 33ɛ and 34ɛ values were −1.0±0.1‰ and −2.2±0.2‰, respectively (Fig. 1B and C, and Table 1).
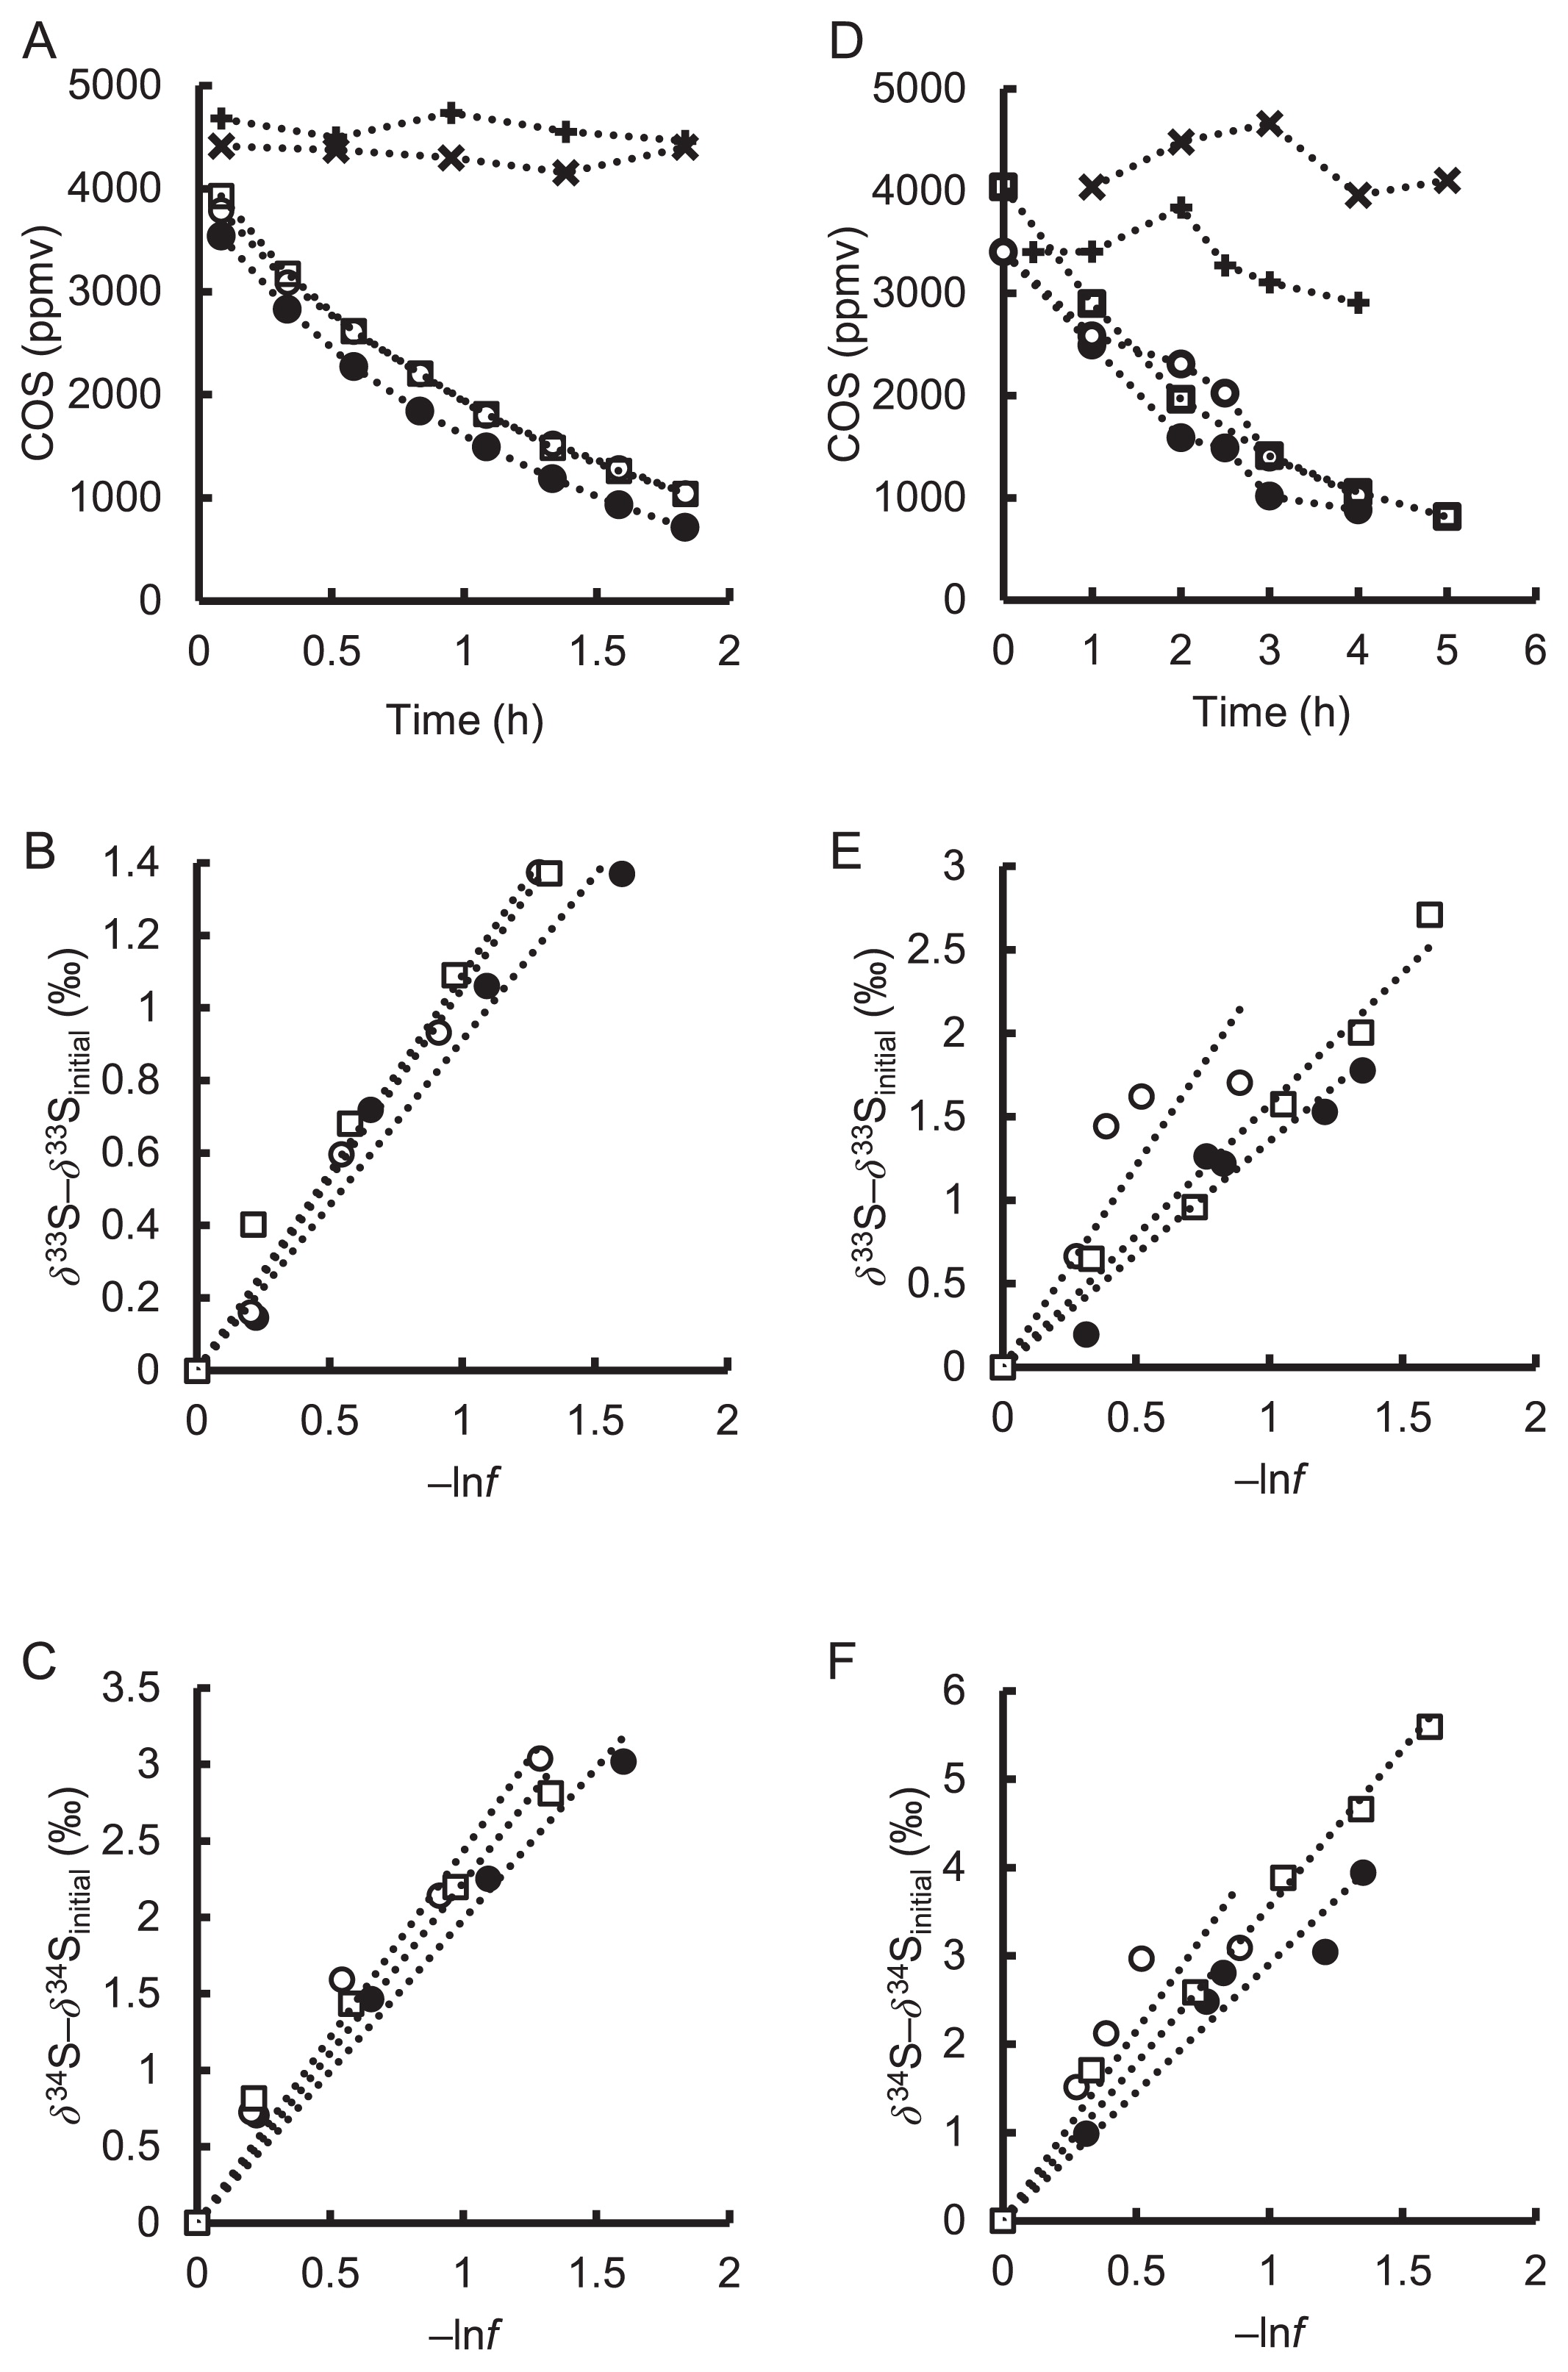
Table 1
Sulfur isotopic fractionations in COS degradation by COSase and
T. thioparus THI115.
a
|
Batch |
Isotope sampling times |
Rate constant (h−1) |
Living cell number (×109 cell) |
Cell specific activity (×10−10 h−1 cell−1) |
33ɛ |
34ɛ |
|
|
|
|
| (‰) |
r2 |
P value |
(‰) |
r2 |
P value |
33E (‰) |
| COSase |
1 |
5 |
0.90 |
— |
— |
−0.9±0.1 |
0.99 |
2.8×10⁻⁵ |
−2.0±0.2 |
0.99 |
2.2×10⁻⁵ |
0.1 |
| 2 |
5 |
0.72 |
— |
— |
−1.1±0.0 |
1.00 |
7.6×10⁻⁷ |
−2.4±0.2 |
0.99 |
2.6×10⁻⁵ |
0.2 |
| 3 |
5 |
0.75 |
— |
— |
−1.1±0.1 |
0.99 |
4.1×10⁻⁵ |
−2.2±0.3 |
0.99 |
4.0×10⁻⁵ |
0.1 |
| Averageb |
— |
0.79±0.10 |
— |
— |
−1.0±0.1 |
— |
—c |
−2.2±0.2 |
— |
—c |
0.1±0.1 |
|
| T. thioparus |
1 |
6 |
0.36 |
4.7 |
0.76 |
−1.4±0.2 |
0.99 |
9.1×10⁻⁶ |
−2.9±0.3 |
0.99 |
4.8×10⁻⁶ |
0.1 |
| THI115 |
2 |
5 |
0.30 |
2.0 |
1.51 |
−2.4±0.8 |
0.93 |
2.0×10⁻³ |
−4.3±1.3 |
0.94 |
1.2×10⁻³ |
−0.2 |
| 3 |
6 |
0.33 |
ND |
ND |
−1.6±0.1 |
0.99 |
1.3×10⁻⁶ |
−3.6±0.3 |
1.00 |
3.9×10⁻⁷ |
0.3 |
| Averageb |
— |
0.33±0.03 |
3.3±1.9 |
1.14±0.53 |
−1.8±0.6 |
— |
—c |
−3.6±0.7 |
— |
—c |
0.1±0.2 |
b Indicated mean±SD calculated based on the value of each batch.
c P values for
ɛ values between COSase and
T. thioparus THI115 were 0.08 for the
33ɛ value and 0.03 for the
34ɛ value.
The purified enzymes studied to date in sulfur isotopic fractionation have only been DsrAB and s-triazine hydrolase (TrzN) (43, 67), and reported 34ɛ values were −15.3‰ and −16‰ for sulfite reduction by DsrAB from Desulfovibrio vulgaris and Archaeoglobus fulgidus, respectively. The 34ɛ value for TrzN from Arthrobacter aurescens was −14.7‰ for the substitution of the thiomethyl group in the herbicide ametryn to a hydroxyl group. In contrast to these enzymes, COSase showed smaller isotopic fractionation. The active site of TrzN had a similar X-ray crystal structure to that of α-CA; however, their amino acid sequences and overall folding structures were different (69). The conformations of the active site between β-CA including COSase and α-CA are similar to each other; however, the COS-degrading activity of α-CA is lower than that of β-CA (20, 39, 57). Although the substrates for COSase and TrzN differ, a common reaction mechanism has been proposed for these enzyme proteins, as follows: a nucleophilic attack to the carbon atom by the hydroxide ion coordinated with the zinc ion at the active site, followed by cleavage of the C-S bond in the substrate (55, 67). Schürner et al. (67) proposed that C-S bond cleavage, which was rate-limiting for the energetic barrier, was the reason for the large sulfur isotope effect by TrzN. On the other hand, a computational model in the reaction of COS with ([H3N]3ZnOH)+, a biomimetic complex used to mimic the active site of α-CA, showed that the rate-limiting step was the nucleophilic attack (66). Therefore, we hypothesize that the factor controlling isotopic fractionation by COSase may be the rate-limiting reaction by the nucleophilic attack to the carbon atom of COS. In other words, since cleavage of the C-S bond in COS was not the rate-limiting step in the hydrolysis of COS, cleavage mostly proceeded and did not show isotopic fractionation for the cleavage reaction itself.
COS degradation by T. thioparus THI115
T. thioparus THI115 degraded approximately 70% of initial COS in 4 h (Fig. 1D). Cell numbers on slant medium in culturing tubes supplemented with COS were in the range of 4.7×10⁹ to 2.0×10⁹ cells tube−1 for living cells and 4.8×10⁹ to 1.3×10⁹ cells tube−1 for dead cells. Cell numbers in the COS free slant tube were in the range of 3.1×10⁹ to 3.2×10⁹ cells tube−1 for living cells and 8.1×10⁸ to 1.8×10⁹ cells tube−1 for dead cells, suggesting that cells were not negatively affected by the COS treatment. Degradation curves were fit to the exponential function and the rate constants were 0.33±0.03 h−1 (r2≥0.94), showing that COS degradation is a first order reaction (Fig. 1D and Table 1). The cell-specific activities (rate constant divided by cell number) of T. thioparus THI115 were in the range of 0.76 to 1.51×10⁻¹⁰ h−1 cell−1 (Table 1). Among bacteria examined to date, T. thioparus THI115 has exhibited the highest COS-hydrolyzing activity; the specific activities of bacterial isolates already examined have been in the range of 0.07 to 1.12×10⁻¹⁰ h−1 cell−1 (29). On the other hand, uninoculated control batches showed variations in COS concentrations, as did control batches for COS degradation by COSase. However, H2S was not observed in this case, and the reason for the variations observed beyond the measurement error currently remains unclear. The isotopic fractionation of an abiotic decrease in COS was not assessed because COS degradation by T. thioparus THI115 was markedly faster than that by the control batches.
T. thioparus THI115 is a sulfur-oxidizing bacterium that degrades COS and H2S as the chemolithotrophic energy source. This bacterium also tolerates high concentrations of COS because the addition of 1,500 ppmv and 25,000 ppmv of COS did not negatively affect the degradation of thiocyanate or COS, respectively (38). The high activity observed by T. thioparus THI115 is appropriate because the COS-degrading reaction is associated with the energy production pathway for this bacterium. On the other hand, the physiological functions of the COS-degrading activity of various chemoorganotrophic bacteria (36, 55) and fungi (44, 48) have not yet been elucidated in detail. Approximately half of these bacteria contain a gene of clade D of β-CA, one of four clades into which β-CA is phylogenetically classified (73, 74). COS degradation may only accompany the reversible hydration of CO2, the natural substrate of β-CA, to HCO3− and H+ by β-CA because COS is a structural analog of CO2.
Sulfur isotopic fractionation for T. thioparus THI115
δ33S and δ34S values for residual COS increased during COS degradation by T. thioparus THI115, as was also the case for COSase (Fig. 1E and F). The 33ɛ and 34ɛ values estimated from the slope were −1.8±0.6‰ and −3.6±0.7‰, respectively (Fig. 1E and F, and Table 1), while 33E values were 0.1±0.1‰ for COSase and 0.1±0.2‰ for T. thioparus THI115 (Table 1). We herein demonstrated for the first time that 34ɛ values for T. thioparus THI115 and COSase were different (P value<0.05). Most errors in isotope ratio measurements were caused by MDF, and variations in 33E values were less than those for 33ɛ and 34ɛ values (Table 1). Since the interpretation of 33E values will be discussed in the next section, we only focused on the 34ɛ values for T. thioparus THI115 and COSase in this section.
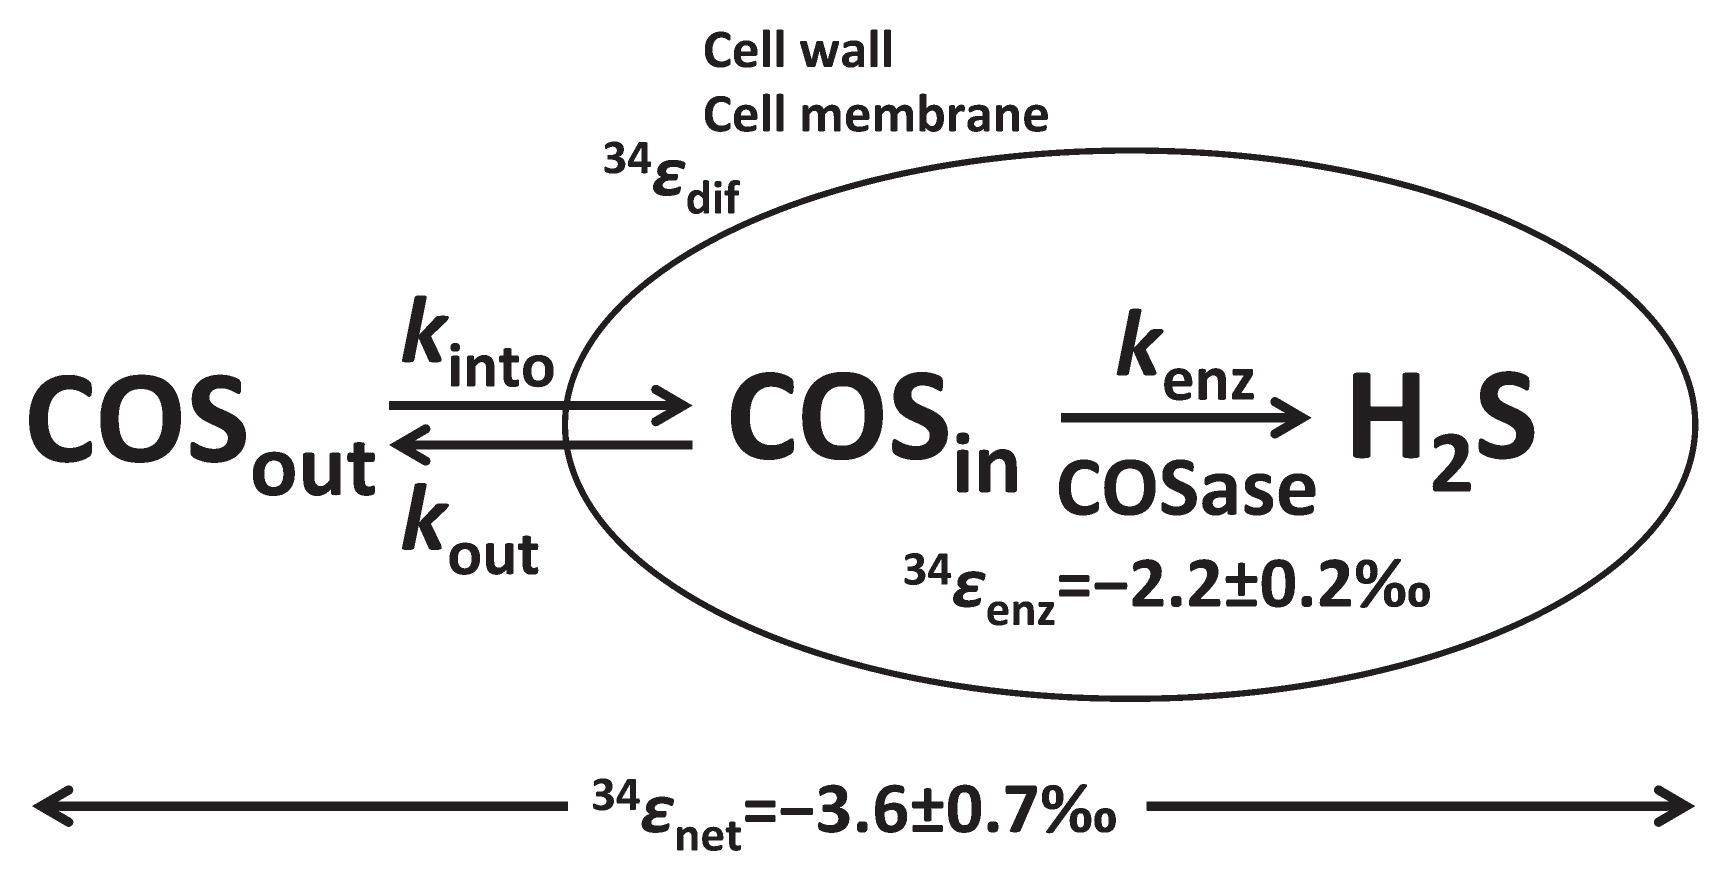
In order to elucidate the mechanisms and factors controlling sulfur isotopic fractionation for COS degradation, we considered Rees’ model (62). The cell membrane is one of the important factors for isotopic fractionation by diffusion and/or active transport (21, 58). Based on Rees’ model, isotopic fractionation in COS degradation by intact T. thioparus THI115 reflects effects on COS transport into the cytoplasm, the hydrolysis of COS by COSase, and the ratio of efflux to influx [kout/(kout+kenz) or kout/kinto] (Fig. 2). This relationship can be expressed using Rees’ model (62), as follows:
|
ɛ
net
=
ɛ
dif
+
(
ɛ
enz
-
ɛ
dif
)
k
out
/
(
k
out
+
k
enz
) |
where ɛnet, ɛdif, and ɛenz are isotopic fractionation constants for the overall net, transport into the cytoplasm, and the enzyme reaction, respectively. kinto, kout, and kenz are rate constants for transport into and out of the cell and for COS degradation by an enzyme, respectively. Transport is regarded as diffusion into and out of the cytoplasm through the cell wall and cell membrane because COS is a gaseous sulfur compound and the cytoplasm is in the liquid phase. Diffusivity in the liquid phase of one gas in another is noted as DT, and is calculated as follows (52):
|
D
T
=
(
(
m
1
m
2
)
(
m
1
+
m
2
)
)
-
1
2
. |
In this equation, m1 and m2 represent the masses of a gas and liquid, respectively. Thus, D(CO32S) and D(CO34S) can be calculated based on the masses of CO32S, CO34S, and H2O. The 34ɛdif value for COS diffusion in liquid water is calculated as D(CO34S)/D(CO32S)−1, and the value is −3.7‰. Thus, the model shows the upper limit of 34ɛnet=−3.7‰ when the ratio of efflux to influx is equivalent to 0 (i.e. kout<<kenz), while the lower limit of 34ɛnet=−2.2‰, 34ɛ value of COSase, when the ratio of efflux to influx is equal to 1 (i.e. kout>>kenz). Thus, the 34ɛnet value of −3.6±0.7‰ obtained in the present experiment using T. thioparus THI115 suggests that the ratio of efflux to influx of this experiment was 0.07, kinto was 0.35 h−1, and kenz (0.33 h−1) was much higher than kout (0.02 h−1). In other words, the main factor controlling the 34ɛ value of bacterial COS degradation was not the enzyme, but diffusion/transport into the cytoplasm. We are the first to show kinto and kout needed in order to estimate influx and efflux for COS degradation by T. thioparus THI115.
In the present study, we employed a higher concentration of COS than the atmosphere because the IRMS analysis required more than 8 nmol COS for technical reasons (22). Based on the emission rate of 13 pmol m−2 s−1 COS from a wheat farm after harvesting (49, 78), Sun et al. (78) estimated that the COS concentration in the soil was approximately 10 parts per billion by volume (ppbv). The highest COS flux in the soil environment reported to date was ~50 pmol m−2 s−1 and was observed at a wheat farm (2); therefore, COS concentrations are presumed to be within an order of ppbv. Isotopic fractionation for T. thioparus THI115 was defined by ɛ values for the transport of COS into the cytoplasm, the enzyme reaction by COSase, and the ratio of efflux to influx. We assumed that the 34ɛnet value for T. thioparus THI115 under very low COS concentrations, such as the atmosphere, was close to the value obtained under high COS concentrations because the ratio of efflux to influx is almost 0, and also that 34ɛnet value was very close to −3.7‰ based on Rees’ model (62).
We previously reported 34ɛ values for seven strains of bacteria isolated from soil. 34ɛ values for four isolates of Mycobacterium spp. and Williamsia sp. THI410, both of which belong to the phylum Actinobacteria, were −3.99‰ to −3.56‰ and −3.74‰, respectively. 34ɛ values for Cupriavidus spp. THI414 and THI415, bacteria belonging to the phylum Proteobacteria, were −2.09‰ and −2.38‰, respectively (29). The reason why the 34ɛ value for T. thioparus THI115 was closer to those for the five isolates of Actinobacteria may be explained by similarities in the function of COS transport into the cytoplasm, enzymes, and the resultant ratio of efflux to influx, which are factors affecting isotopic fractionation based on Rees’ model (62).
It is important to note that different enzymes for COS degradation may also partially explain the difference in 34ɛ values among different species. COSase examined here belongs to clade D of β-CA (55). Genome information on Mycobacterium spp. THI401, THI402, THI404, and THI405 and Williamsia sp. THI410 suggests that these bacteria have clade D of β-CA because these strains have similar partial nucleotide sequences to that of the gene encoding clade D of β-CA (56). In contrast, these sequences were not detected in the genome of Cupriavidus spp. THI414 or THI415 (56, unpublished data for Cupriavidus sp. THI414). In addition, NCBI’s CD-Search, a search tool for conserved domains, indicated that only 2 out of 245 CAs of Cupriavidus spp. searched from the NCBI’s protein database were classified to clade D of β-CA, suggesting that Cupriavidus spp. THI414 and THI415 do not have β-CA classified in clade D. Although the number of bacterial isolates examined here was limited, our results suggest that the 34ɛ value for bacteria is closely related to the presence of relevant enzymes.
COS-degrading ability is widespread not only in bacteria (36, 56) and archaea (71), but also in plants (61), fungi (44, 48), and algae (3, 60). Due to high COS-degrading activities (55, 57, 71, 72) and the distribution of β-CA family enzymes, which include COSase and CS2 hydrolase, in phylogenetically diverse organisms (73, 74), COS degradation by these organisms appears to mainly be mediated by β-CA family enzymes. Therefore, isotopic fractionation for COS-degrading organisms is considered to be similar to COSase at the enzyme level, indicating that the lower limit of the 34ɛ value for these organisms is also similar to that for COSase.
On the other hand, the presence of other COS-degrading enzymes needs to be considered. It is unlikely that T. thioparus THI115 possesses other β-CA family enzymes because a Southern blotting analysis using the COSase gene showed the presence of only one copy of the COSase gene in the genome (55). However, we are still unable to rule out the possible effects of other COS-degrading enzymes such as α-CA (20), nitrogenase (68), CO dehydrogenase (11), and RubisCO (45), which exhibit low COS-degrading activities. The recently elucidated draft genome of T. thioparus DSM 505 indicated that there are nucleotide sequences annotated to β-CA, carboxysome CA, γ-CA, and RubisCO (25). The X-ray crystal structures of the active sites of carboxysome CA and γ-CA were similar to those of β-CA and α-CA, respectively (23, 40, 65). The genome sequencing of T. thioparus THI115 is in progress in order to obtain information on the involvement of these enzymes.
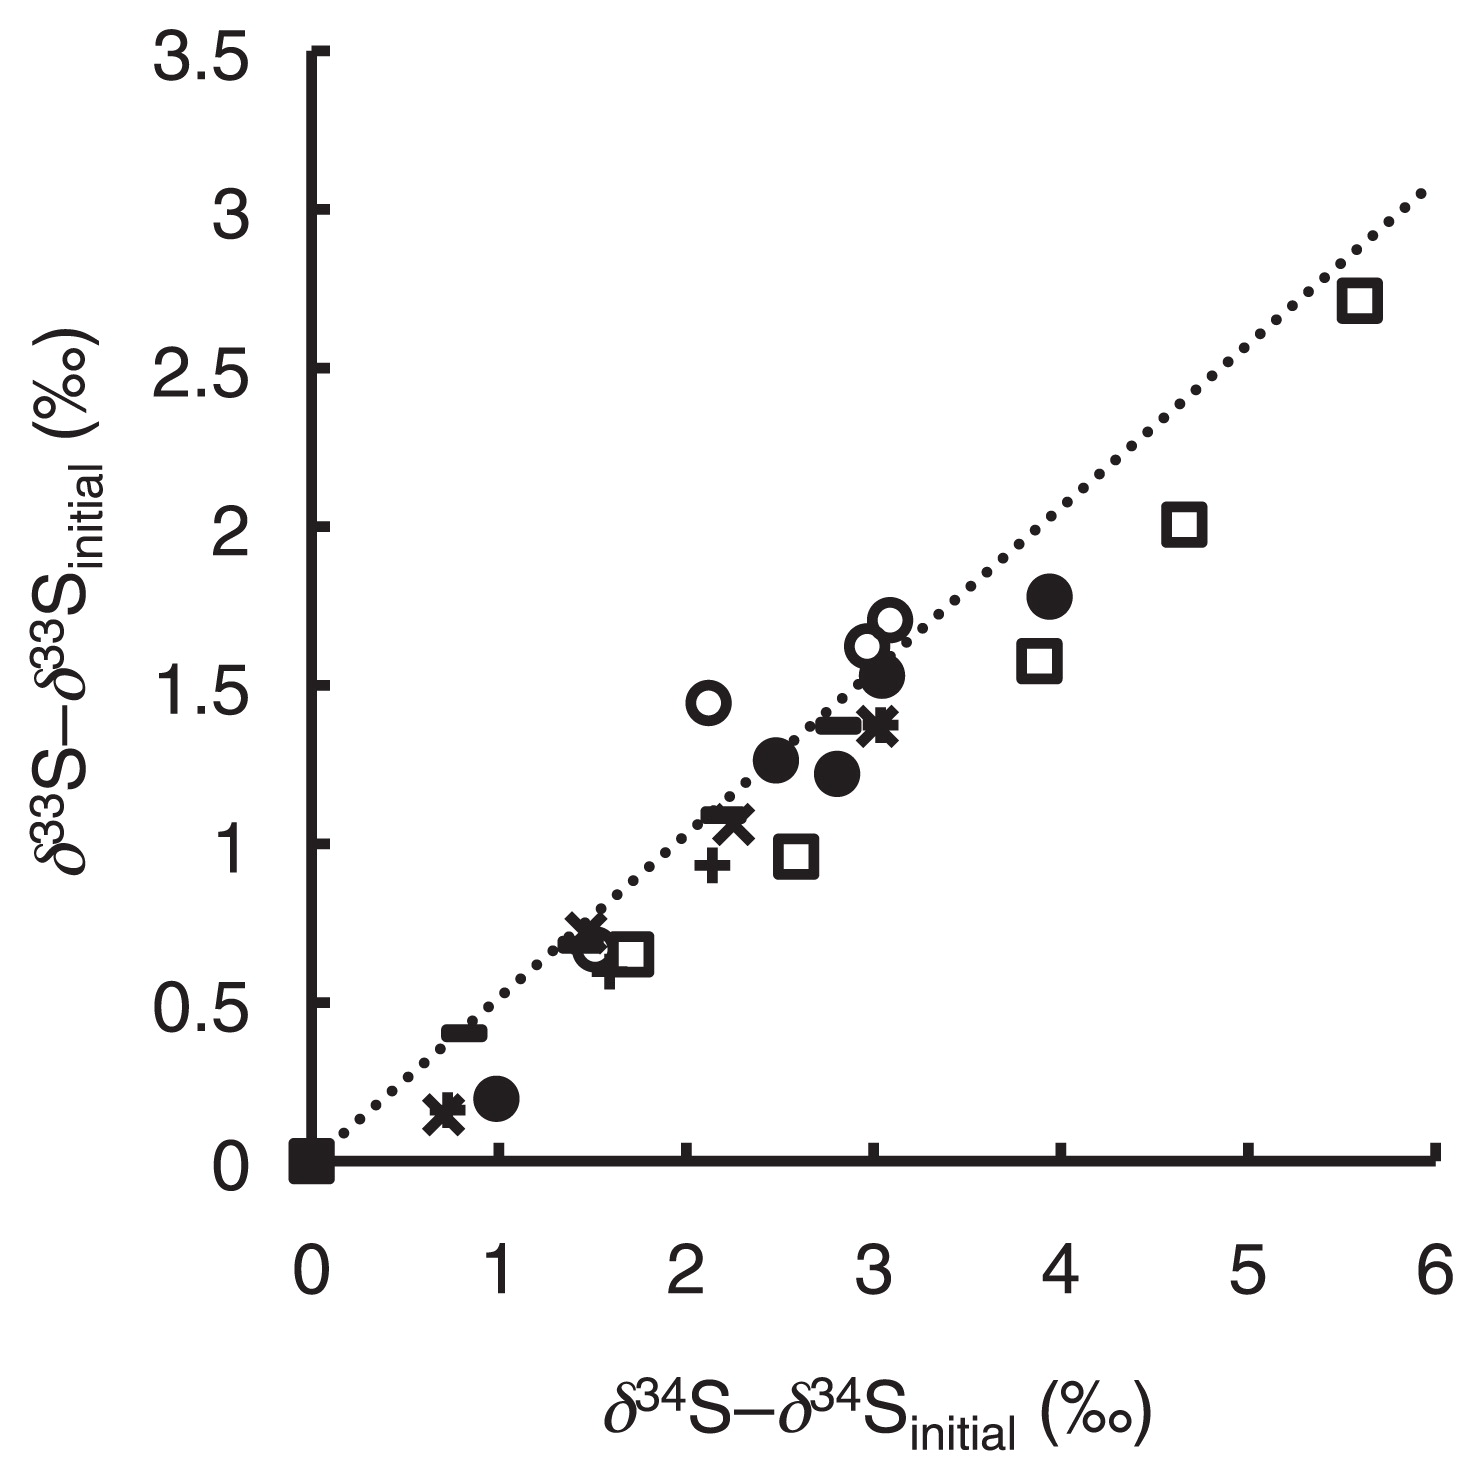
Three-isotope plot for COS degradation by COSase and T. thioparus THI115
Fig. 3 shows a three-isotope plot represented from the results of the present study, and slopes ranged between 0.43 and 0.56. Since most errors in isotope ratio measurements were caused by MDF, variations in 33E values were less than those for 33ɛ and 34ɛ values (Table 1). 33E values were 0.1±0.1‰ for COSase and 0.1±0.2‰ for T. thioparus THI115 (Table 1), showing no significant difference.
Sulfur isotope anomalies originating from the MIF process have been observed in aerosols from the troposphere and in snow pits and ice cores in which aerosols from the stratosphere have been deposited (17, 63, 64). The reactions by COSase and T. thioparus THI115 as well as chemoorganotrophic bacteria reported previously did not show MIF, which confirmed that these reactions do not contribute to sulfur isotope anomalies in the atmosphere (17, 63, 64).
Conclusion
Isotopic fractionation for COSase and T. thioparus THI115 in the present study indicated biological effects on δ34S value of tropospheric COS and provides insights into biological COS degradation, which is important for estimating the COS global budget. In the present study, we used a purified enzyme of COSase and intact cells of T. thioparus THI115 in order to obtain a clearer understanding of isotopic fractionation in COS degradation by bacteria. Based on Rees’ model, we assumed that isotopic fractionation by T. thioparus THI115 was mainly influenced by the transport of COS into the cytoplasm during the degradation of COS, even at very low concentrations such as atmospheric COS.
Further studies with a focus on isotopic fractionation by plants, another major sink of atmospheric COS, are indispensable for distinguishing COS fluxes between soil and plants. Moreover, measurements at low COS concentrations, such as atmospheric concentrations, are needed for soil, the second largest sink of COS, and COS-degrading organisms in order to clarify the COS dynamics operating between the troposphere and soil or organisms (42). Therefore, a rapid and simple analytical method with the ability to measure isotopic fractionation at atmospheric COS levels needs to be developed.
Acknowledgements
We would like to thank M. Odaka (Graduate School of Engineering and Resource Science, Akita University) and K. Noguchi (Instrumentation Analysis Center, Tokyo University of Agriculture and Technology) for their fruitful discussions. This work was supported in part by Grants-in-Aid for Scientific Research (no. 18310020, no. 23310051, no. 16H05884, no. 17H06105, no. 17J08979) from the Ministry of Education, Culture, Sports, Science and Technology, Japan.
References
- 1. Bigeleisen, J., and M.G. Mayer. 1947. Calculation of equilibrium constants for isotopic exchange reactions. J Chem Phys. 15:261-267.
- 2. Billesbach, D.P., J.A. Berry, U. Seibt, K. Maseyk, M.S. Torn, M.L. Fischer, M. Abu-Naser, and J.E. Campbell. 2014. Growing season eddy covariance measurements of carbonyl sulfide and CO2 fluxes: COS and CO2 relationships in Southern Great Plains winter wheat. Agric For Meteorol. 184:48-55.
- 3. Blezinger, S., C. Wilhelm, and J. Kesselmeier. 2000. Enzymatic consumption of carbonyl sulfide (COS) by marine algae. Biogeochemistry. 48:185-197.
- 4. Brenninkmeijer, C.A.M., C. Janssen, J. Kaiser, T. Röckmann, T.S. Rhee, and S.S. Assonov. 2003. Isotope effects in the chemistry of atmospheric trace compounds. Chem Rev. 103:5125-5161.
- 5. Campbell, J.E., G.R. Carmichael, T. Chai, et al. 2008. Photosynthetic control of atmospheric carbonyl sulfide during the growing season. Science. 322:1085-1088.
- 6. Chambers, L.A., and P.A. Trudinger. 1979. Microbiological fractionation of stable sulfur isotopes: A review and critique. Geomicrobiol J. 1:249-293.
- 7. Chin, M., and D.D. Davis. 1993. Global sources and sinks of OCS and CS2 and their distributions. Global Biogeochem Cycles. 7:321-337.
- 8. Chin, M., and D.D. Davis. 1995. A reanalysis of carbonyl sulfide as a source of stratospheric background sulfur aerosol. J Geophys Res: Atmos. 100:8993-9005.
- 9. Crutzen, P.J. 1976. The possible importance of CSO for the sulfate layer of the stratosphere. Geophys Res Lett. 3:73-76.
- 10. Elliott, S., E. Lu, and F.S. Rowland. 1989. Rates and mechanisms for the hydrolysis of carbonyl sulfide in natural waters. Environ Sci Technol. 23:458-461.
- 11. Ensign, S.A. 1995. Reactivity of carbon monoxide dehydrogenase from Rhodospirillum rubrum with carbon dioxide, carbonyl sulfide, and carbon disulfide. Biochemistry. 34:5372-5381.
- 12. Ferm, R.J. 1957. The chemistry of carbonyl sulfide. Chem Rev. 57:621-640.
- 13. Fry, B., H. Gest, and J.M. Hayes. 1984. Isotope effects associated with the anaerobic oxidation of sulfide by the purple photosynthetic bacterium, Chromatium vinosum. FEMS Microbiol Lett. 22:283-287.
- 14. Fry, B., H. Gest, and J.M. Hayes. 1985. Isotope effects associated with the anaerobic oxidation of sulfite and thiosulfate by the photosynthetic bacterium, Chromatium vinosum. FEMS Microbiol Lett. 27:227-232.
- 15. Fry, B., J. Cox, H. Gest, and J.M. Hayes. 1986. Discrimination between 34S and 32S during bacterial metabolism of inorganic sulfur compounds. J Bacteriol. 165:328-330.
- 16. Fry, B., H. Gest, and J.M. Hayes. 1988. 34S/32S fractionation in sulfur cycles catalyzed by anaerobic bacteria. Appl Environ Microbiol. 54:250-256.
- 17. Guo, Z., Z. Li, J. Farquhar, A.J. Kaufman, N. Wu, C. Li, R.R. Dickerson, and P. Wang. 2010. Identification of sources and formation processes of atmospheric sulfate by sulfur isotope and scanning electron microscope measurements. J Geophys Res: Atmos. 115:D00K07.
- 18. Guy, R.D., M.L. Fogel, and J.A. Berry. 1993. Photosynthetic fractionation of the stable isotopes of oxygen and carbon. Plant Physiol. 101:37-47.
- 19. Habicht, K.S., D.E. Canfield, and J. Rethmeier. 1998. Sulfur isotope fractionation during bacterial reduction and disproportionation of thiosulfate and sulfite. Geochim Cosmochim Acta. 62:2585-2595.
- 20. Haritos, V.S., and G. Dojchinov. 2005. Carbonic anhydrase metabolism is a key factor in the toxicity of CO2 and COS but not CS2 toward the flour beetle Tribolium castaneum [Coleoptera: Tenebrionidae]. Comp. Biochem. Physiol., Part C: Toxicol. Pharmacol. 140:139-147.
- 21. Harrison, A.G., and H.G. Thode. 1958. Mechanism of the bacterial reduction of sulphate from isotope fractionation studies. Trans Faraday Soc. 54:84-92.
- 22. Hattori, S., A. Toyoda, S. Toyoda, S. Ishino, Y. Ueno, and N. Yoshida. 2015. Determination of the sulfur isotope ratio in carbonyl sulfide using gas chromatography/isotope ratio mass spectrometry on fragment ions 32S+, 33S+, and 34S+. Anal Chem. 87:477-484.
- 23. Hewett-Emmett, D., and R.E. Tashian. 1996. Functional diversity, conservation, and convergence in the evolution of the α-, β-, and γ-carbonic anhydrase gene families. Mol Phylogenet Evol. 5:50-77.
- 24. Hulston, J.R., and H.G. Thode. 1965. Variations in the S33, S34, and S36 contents of meteorites and their relation to chemical and nuclear effects. J Geophys Res. 70:3475-3484.
- 25. Hutt, L.P., M. Huntemann, A. Clum, et al. 2017. Permanent draft genome of Thiobacillus thioparus DSM 505T, an obligately chemolithoautotrophic member of the Betaproteobacteria. Stand Genomic Sci. 10.1186/s40793-017-0229-3
- 26. Ivanov, M.V., G.I. Gogotova, A.G. Matrosov, and A.M. Zyakun. 1976. Fractionation of sulfur isotopes by phototrophic sulfur bacteria Ectothiorhodospira shaposhnikovii. Mikrobiologiia. 45:655-659.(In Russian with an English abstract)..
- 27. Johnson, M.S., K.L. Feilberg, P. von Hessberg, and O.J. Nielsen. 2002. Isotopic processes in atmospheric chemistry. Chem Soc Rev. 31:313-323.
- 28. Jones, G.E., and R.L. Starkey. 1957. Fractionation of stable isotopes of sulfur by microorganisms and their role in deposition of native sulfur. Appl Microbiol. 5:111-118.
- 29. Kamezaki, K., S. Hattori, T. Ogawa, S. Toyoda, H. Kato, Y. Katayama, and N. Yoshida. 2016. Sulfur isotopic fractionation of carbonyl sulfide during degradation by soil bacteria. Environ Sci Technol. 50:3537-3544.
- 30. Kaplan, I.R., and T.A. Rafter. 1958. Fractionation of stable isotopes of sulfur by Thiobacilli. Science. 127:517-518.
- 31. Kaplan, I.R., and S.C. Rittenberg. 1962. Fractionation of isotopes in relation to the problem of elemental sulphur transport by micro-organisms. Nature. 194:1098-1099.
- 32. Kaplan, I.R., and S.C. Rittenberg. 1964. Microbiological fractionation of sulphur isotopes. J Gen Microbiol. 34:195-212.
- 33. Karsh, K.L., J. Granger, K. Kritee, and D.M. Sigman. 2012. Eukaryotic assimilatory nitrate reductase fractionates N and O isotopes with a ratio near unity. Environ Sci Technol. 46:5727-5735.
- 34. Katayama, Y., Y. Narahara, Y. Inoue, F. Amano, T. Kanagawa, and H. Kuraishi. 1992. A thiocyanate hydrolase of Thiobacillus thioparus: a novel enzyme catalyzing the formation of carbonyl sulfide from thiocyanate. J Biol Chem. 267:9170-9175.
- 35. Katayama, Y., T. Kanagawa, and H. Kuraishi. 1993. Emission of carbonyl sulfide by Thiobacillus thioparus grown with thiocyanate in pure and mixed cultures. FEMS Microbiol Lett. 114:223-228.
- 36. Kato, H., M. Saito, Y. Nagahata, and Y. Katayama. 2008. Degradation of ambient carbonyl sulfide by Mycobacterium spp. in soil. Microbiology. 154:249-255.
- 37. Kelly, D.P., A.P. Wood, and E. Stackebrandt. 2015. Thiobacillus, p.1-10. In W.B. Whitman (ed.), Bergey’s manual of systematics of archaea and bacteria. Wiley & Sons, Hoboken.
- 38. Kim, S.-J., and Y. Katayama. 2000. Effect of growth conditions on thiocyanate degradation and emission of carbonyl sulfide by Thiobacillus thioparus THI115. Water Res. 34:2887-2894.
- 39. Kimber, M.S., and E.F. Pai. 2000. The active site architecture of Pisum sativum β-carbonic anhydrase is a mirror image of that of α-carbonic anhydrases. EMBO J. 19:1407-1418.
- 40. Kisker, C., H. Schindelin, B.E. Alber, J.G. Ferry, and D.C. Rees. 1996. A left-handed β-helix revealed by the crystal structure of a carbonic anhydrase from the archaeon Methanosarcina thermophila. EMBO J. 15:2323-2330.
- 41. Kondrat’eva, E.N., V.L. Mekhtieva, and R.S. Sumarokova. 1966. Concerning the directionality of the isotope effect in the first steps of sulphide oxidation by purple bacteria. Vest Mosk Univ Ser VI. VI:45-48.(In Russian).
- 42. Launois, T., P. Peylin, S. Belviso, and B. Poulter. 2015. A new model of the global biogeochemical cycle of carbonyl sulfide—Part 2: Use of carbonyl sulfide to constrain gross primary productivity in current vegetation models. Atmos Chem Phys. 15:9285-9312.
- 43. Leavitt, W.D., A.S. Bradley, A.A. Santos, I.A.C. Pereira, and D.T. Johnston. 2015. Sulfur isotope effects of dissimilatory sulfite reductase. Front Microbiol. 6:1392.
- 44. Li, X.S., T. Sato, Y. Ooiwa, A. Kusumi, J.-D. Gu, and Y. Katayama. 2010. Oxidation of elemental sulfur by Fusarium solani strain THIF01 harboring endobacterium Bradyrhizobium sp. Microb Ecol. 60:96-104.
- 45. Lorimer, G.H., and J. Pierce. 1989. Carbonyl sulfide: An alternate substrate for but not an activator of ribulose-1,5-bisphosphate carboxylase. J Biol Chem. 264:2764-2772.
- 46. Lowry, O.H., N.J. Rosebrough, A.L. Farr, and R.J. Randall. 1951. Protein measurement with the Folin phenol reagent. J Biol Chem. 193:265-275.
- 47. Mariotti, A., J.C. Germon, P. Hubert, P. Kaiser, R. Letolle, A. Tardieux, and P. Tardieux. 1981. Experimental determination of nitrogen kinetic isotope fractionation: Some principles; illustration for the denitrification and nitrification processes. Plant Soil. 62:413-430.
- 48. Masaki, Y., R. Ozawa, K. Kageyama, and Y. Katayama. 2016. Degradation and emission of carbonyl sulfide, an atmospheric trace gas, by fungi isolated from forest soil. FEMS Microbiol Lett. 363:fnw197.
- 49. Maseyk, K., J.A. Berry, D. Billesbach, J.E. Campbell, M.S. Torn, M. Zahniser, and U. Seibt. 2014. Sources and sinks of carbonyl sulfide in an agricultural field in the Southern Great Plains. Proc Natl Acad Sci U S A. 111:9064-9069.
- 50. McCready, R.G.L., and H.R. Krouse. 1982. Sulfur isotope fractionation during the oxidation of elemental sulfur by thiobacilli in a solonetzic soil. Can J Soil Sci. 62:105-110.
- 51. Mekhtieva, V.L., and E.N. Kondrat’eva. 1966. Fractionation of stable isotopes of sulfur by photosynthesizing purple sulfur bacteria Rhodopseudomonas sp. Dokl Akad Nauk SSSR. 166:80-83.(In Russian).
- 52. Mills, R., and K.R. Harris. 1976. The effect of isotopic substitution on diffusion in liquids. Chem Soc Rev. 5:215-231.
- 53. Montzka, S.A., P. Calvert, B.D. Hall, J.W. Elkins, T.J. Conway, P.P. Tans, and C. Sweeney. 2007. On the global distribution, seasonality, and budget of atmospheric carbonyl sulfide (COS) and some similarities to CO2. J Geophys Res Atmos. 112:D09302.
- 54. Nakai, N., and M.L. Jensen. 1964. The kinetic isotope effect in the bacterial reduction and oxidation of sulfur. Geochim Cosmochim Acta. 28:1893-1912.
- 55. Ogawa, T., K. Noguchi, M. Saito, et al. 2013. Carbonyl sulfide hydrolase from Thiobacillus thioparus strain THI115 is one of the β-carbonic anhydrase family enzymes. J Am Chem Soc. 135:3818-3825.
- 56. Ogawa, T., H. Kato, M. Higashide, M. Nishimiya, and Y. Katayama. 2016. Degradation of carbonyl sulfide by Actinomycetes and detection of clade D of β-class carbonic anhydrase. FEMS Microbiol Lett. 363:fnw223.
- 57. Ogée, J., J. Sauze, J. Kesselmeier, B. Genty, H. Van Diest, T. Launois, and L. Wingate. 2016. A new mechanistic framework to predict OCS fluxes from soils. Biogeosciences. 13:2221-2240.
- 58. O’Leary, M.H. 1988. Carbon isotopes in photosynthesis: Fractionation techniques may reveal new aspects of carbon dynamics in plants. BioScience. 38:328-336.
- 59. Park, R., and S. Epstein. 1960. Carbon isotope fractionation during photosynthesis. Geochim Cosmochim Acta. 21:110-126.
- 60. Protoschill-Krebs, G., C. Wilhelm, and J. Kesselmeier. 1995. Consumption of carbonyl sulphide by Chlamydomonas reinhardtii with different activities of carbonic anhydrase (CA) induced by different CO2 growing regimes. Bot Acta. 108:445-448.
- 61. Protoschill-Krebs, G., C. Wilhelm, and J. Kesselmeier. 1996. Consumption of carbonyl sulphide (COS) by higher plant carbonic anhydrase (CA). Atmos Environ. 30:3151-3156.
- 62. Rees, C.E. 1973. A steady-state model for sulphur isotope fractionation in bacterial reduction processes. Geochim Cosmochim Acta. 37:1141-1162.
- 63. Romero, A.B., and M.H. Thiemens. 2003. Mass-independent sulfur isotopic compositions in present-day sulfate aerosols. J Geophys Res: Atmos. 108:4524.
- 64. Savarino, J., A. Romero, J. Cole-Dai, S. Bekki, and M.H. Thiemens. 2003. UV induced mass-independent sulfur isotope fractionation in stratospheric volcanic sulfate. Geophys Res Lett. 30:2131.
- 65. Sawaya, M.R., G.C. Cannon, S. Heinhorst, S. Tanaka, E.B. Williams, T.O. Yeates, and C.A. Kerfeld. 2006. The structure of β-carbonic anhydrase from the carboxysomal shell reveals a distinct subclass with one active site for the price of two. J Biol Chem. 281:7546-7555.
- 66. Schenk, S., J. Kesselmeier, and E. Anders. 2004. How does the exchange of one oxygen atom with sulfur affect the catalytic cycle of carbonic anhydrase? Chem - Eur J. 10:3091-3105.
- 67. Schürner, H.K.V., J.L. Seffernick, A. Grzybkowska, A. Dybala-Defratyka, L.P. Wackett, and M. Elsner. 2015. Characteristic isotope fractionation patterns in s-triazine degradation have their origin in multiple protonation options in the s-triazine hydrolase TrzN. Environ Sci Technol. 49:3490-3498.
- 68. Seefeldt, L.C., M.E. Rasche, and S.A. Ensign. 1995. Carbonyl sulfide and carbon dioxide as new substrates, and carbon disulfide as a new inhibitor, of nitrogenase. Biochemistry. 34:5382-5389.
- 69. Seffernick, J.L., E. Reynolds, A.A. Fedorov, E. Fedorov, S.C. Almo, M.J. Sadowsky, and L.P. Wackett. 2010. X-ray structure and mutational analysis of the atrazine chlorohydrolase TrzN. J Biol Chem. 285:30606-30614.
- 70. Seibt, U., J. Kesselmeier, L. Sandoval-Soto, U. Kuhn, and J.A. Berry. 2010. A kinetic analysis of leaf uptake of COS and its relation to transpiration, photosynthesis and carbon isotope fractionation. Biogeosciences. 7:333-341.
- 71. Smeulders, M.J., T.R.M. Barends, A. Pol, et al. 2011. Evolution of a new enzyme for carbon disulphide conversion by an acidothermophilic archaeon. Nature. 478:412-416.
- 72. Smeulders, M.J., A. Pol, H. Venselaar, T.R.M. Barends, J. Hermans, M.S.M. Jetten, and H.J.M. Op den Camp. 2013. Bacterial CS2 hydrolases from Acidithiobacillus thiooxidans strains are homologous to the archaeal catenane CS2 hydrolase. J Bacteriol. 195:4046-4056.
- 73. Smith, K.S., C. Jakubzick, T.S. Whittam, and J.G. Ferry. 1999. Carbonic anhydrase is an ancient enzyme widespread in prokaryotes. Proc Natl Acad Sci U S A. 96:15184-15189.
- 74. Smith, K.S., and J.G. Ferry. 2000. Prokaryotic carbonic anhydrases. FEMS Microbiol Rev. 24:335-366.
- 75. Solomon, S. 1999. Stratospheric ozone depletion: A review of concepts and history. Rev Geophys. 37:275-316.
- 76. Sra, A.K., Y. Hu, G.E. Martin, D.D. Snow, M.W. Ribbe, and A. Kohen. 2004. Competitive 15N kinetic isotope effects of nitrogenase-catalyzed dinitrogen reduction. J Am Chem Soc. 126:12768-12769.
- 77. Stimler, K., S.A. Montzka, J.A. Berry, Y. Rudich, and D. Yakir. 2010. Relationships between carbonyl sulfide (COS) and CO2 during leaf gas exchange. New Phytol. 186:869-878.
- 78. Sun, W., K. Maseyk, C. Lett, and U. Seibt. 2015. A soil diffusion–reaction model for surface COS flux: COSSM v1. Geosci Model Dev. 8:3055-3070.
- 79. Taylor, B.E., M.C. Wheeler, and D.K. Nordstrom. 1984. Stable isotope geochemistry of acid mine drainage: Experimental oxidation of pyrite. Geochim Cosmochim Acta. 48:2669-2678.
- 80. Weiss, P.M., C.-Y. Chen, W.W. Cleland, and P.F. Cook. 1988. Use of Primary deuterium and 15N isotope effects to deduce the relative rates of steps in the mechanisms of alanine and glutamate dehydrogenases. Biochemistry. 27:4814-4822.
- 81. Yamazaki, T., T. Hozuki, K. Arai, S. Toyoda, K. Koba, T. Fujiwara, and N. Yoshida. 2014. Isotopomeric characterization of nitrous oxide produced by reaction of enzymes extracted from nitrifying and denitrifying bacteria. Biogeosciences. 11:2679-2689.
- 82. Yoneyama, T., K. Kamachi, T. Yamaya, and T. Mae. 1993. Fractionation of nitrogen isotopes by glutamine synthetase isolated from spinach leaves. Plant Cell Physiol. 34:489-491.
- 83. Zerkle, A.L., J. Farquhar, D.T. Johnston, R.P. Cox, and D.E. Canfield. 2009. Fractionation of multiple sulfur isotopes during phototrophic oxidation of sulfide and elemental sulfur by a green sulfur bacterium. Geochim Cosmochim Acta. 73:291-306.