Abstract
Various waterborne pathogens originate from human or animal feces and may cause severe gastroenteric outbreaks. Bacteroides spp. that exhibit strong host- or group-specificities are promising markers for identifying fecal sources and their origins. In the present study, 240 water samples were collected from two major aquaculture areas in Republic of Korea over a period of approximately 1 year, and the concentrations and occurrences of four host-specific Bacteroides markers (human, poultry, pig, and ruminant) were evaluated in the study areas. Host-specific Bacteroides markers were detected widely in the study areas, among which the poultry-specific Bacteroides marker was detected at the highest concentration (1.0–1.2 log10 copies L−1). During the sampling period, high concentrations of host-specific Bacteroides markers were detected between September and December 2015. The host-specific Bacteroides marker-combined geospatial map revealed the up-to-downstream gradient of fecal contamination, as well as the effects of land-use patterns on host-specific Bacteroides marker concentrations. In contrast to traditional bacterial indicators, the human-specific Bacteroides marker correlated with human specific pathogens, such as noroviruses (r=0.337; P<0.001). The present results indicate that host-specific Bacteroides genetic markers with an advanced geospatial analysis are useful for tracking fecal sources and associated pathogens in aquaculture areas.
Feces represent a major source of water contamination because it contains various microbial pathogens. Most waterborne human pathogens originate from feces, including noroviruses and food-poisoning bacteria, and may spread widely and cause severe gastroenteric diseases (5, 21, 36). Waterborne disease cases have been increasingly reported in Republic of Korea since 2009, and 422 cases of waterborne disease outbreaks, accounting for 8% of all infectious disease cases, occurred in Republic of Korea in 2015 (Gyeongnam development institute. 2011. A study on improvement of water quality in Milyanggang. Gyeongsangnam-do, Republic of Korea, in Korean) (Korea centers for disease control and prevention. 2015. Infectious disease surveillance yearbook. Chungcheonbuk-do, Republic of Korea, in Korean). The southern part of the Korean peninsula is a major aquaculture area, producing more than 70% of domestic seafood for Republic of Korea (Ministry of Ocean and Fisheries of Korea, https://www.mof.go.kr/statPortal/). Various fecal sources, including sewage, farms, wildlife habitats, and harbors, may cause the fecal contamination of fisheries and shellfish farms, which are typically located near aquaculture areas in this region (6, 23, 40).
Microbial source tracking is an environmental monitoring method that has been applied globally to monitor the sources of feces in aquatic environments using a number of indicator microorganisms (10, 32, 39). In precise microbial source tracking studies, it is important to select microbial indicators that strongly correlate with fecal sources (8). Fecal indicator bacteria, such as total coliforms, fecal coliforms, and enterococci, are commonly used in water quality management worldwide (38). Although humans carry human-specific pathogens, animals are also important carriers or reservoirs of enteric human pathogens, such as Salmonella spp., enterohemorrhagic Escherichia coli, and Vibrio spp. (3, 28). Coliforms and enterococci may not be suitable for examining the origins of fecal sources due to their existence in human and animal feces (1, 18, 28). Therefore, host-specific microbial indicators are needed in order to accurately track fecal sources (2, 7).
Bacteroides spp. are obligate anaerobic bacteria, and many Bacteroides spp. have been detected in the feces of warm-blooded animals (35). Previous studies reported that several Bacteroides spp. had strong host or group specificities, and the 16S rRNA genes of host-specific Bacteroides spp. are promising markers for identifying human or animal fecal sources (17, 20). Moreover, Bacteroides spp. are suitable for estimating the time lapse of fecal inflow into aquatic environments due to their short period of viability after their release from hosts (43). Therefore, human-specific Bacteroides markers may be useful as molecular indicators of human-specific pathogens because they are highly abundant and have relatively high sensitivity and specificity to human fecal contamination (25, 27, 45). Human noroviruses, a major cause of non-bacterial acute gastroenteritis, only originate from human feces (5). Since their low sensitivity and high cost of detection limits their utility (37), human-specific Bacteroides markers may offer a useful alternative for monitoring and controlling norovirus contamination in aquaculture areas.
A large geographic information system (GIS) based on datasets, including population, land cover, and land use pattern data, may be used for precise and systematic fecal source tracking (26, 44). Land use patterns provide information on the spatial variability of a study area and the fecal sources in different types of land cover (26). Moreover, the patterns of land use and associated fecal sources significantly affect the surrounding aquatic environments (34). Therefore, the objectives of the present study were to (i) identify the distribution of host-specific Bacteroides markers in surface water and seawater samples from two aquaculture areas, (ii) predict potential fecal sources using a Bacteroides marker-combined geospatial map based on GIS, and (iii) investigate the relationship between human noroviruses and human-specific Bacteroides markers.
Materials and Methods
Sampling sites and water samples
Two aquaculture areas (Aphae Island and Goseong Bay), located on the southern coast of Republic of Korea, exhibit distinct geographic characteristics. Aphae Island has a very rugged coastline and approximately 7,000 residents (Fig. 1). Several intensive livestock farms, which breed approximately 51,400 poultry, 8,900 pigs, and 2,900 ruminants, operate within the watershed of Aphae Island (Statistics Korea, http://kosis.kr). The daily capacity of sewage treatment facilities and the public sewage treatment connection rate (based on the percent of the population) are 70 m3 d−1 and 19.6%, respectively (National Sewer Information System, https://www.hasudoinfo.or.kr/). Goseong Bay is an enclosed geographic water feature into which seawater inflows relatively slowly due to the narrow entrance into the bay. Goseong Bay is a major area for oyster cultivation, accounting for approximately 13% of all oyster production in Republic of Korea, and has approximately 26,000 residents (11) (Ministry of Ocean and Fisheries of Korea, https://www.mof.go.kr/statPortal/). Intensive livestock farms, which breed approximately 105,000 poultry, 8,100 pigs, and 2,500 ruminants, are located within the watershed of Goseong Bay (Statistics Korea, http://kosis.kr). The daily capacity of sewage treatment facilities and the public sewage treatment connection rate are 13,000 m3 d−1 and 85.5%, respectively (National Sewer Information System, https://www.hasudoinfo.or.kr/).

In the present study, 240 water samples were collected six times, between March 2015 and January 2016, from various surface and seawater sampling sites located on Aphae Island and in Goseong Bay. Twenty sampling sites were selected on Aphae Island (10 surface water and 10 seawater sampling sites) and Goseong Bay (11 surface water and 9 seawater sampling sites) considering stream sites and sampling locations. During sampling, water temperature, pH, conductivity, salinity, and turbidity were measured using a YSI multi-parameter instrument (Yellow Springs Instruments, Yellow Springs, OH, USA). Furthermore, the various environmental parameters of each sampling site, including wind speed, precipitation on the sampling day (Prep-0), and total precipitation for the 3 d preceding the sampling day (Prep-3), were obtained from the Korea Meteorological Administration (http://www.kma.go.kr).
Sample processing and nucleic acid extraction
Water samples were collected in sterilized bottles and filtered using polyvinylidene difluoride membranes (pore size of 0.22 μm, diameter of 47 mm, Millipore, Cork, Ireland). Filters were kept at −80°C until nucleic acid extraction using a PowerWater DNA isolation kit (MO BIO Laboratories, Carlsbad, CA, USA) following the manufacturer’s instructions. The final eluents (100 μL each) were stored at −20°C until used.
In order to detect human noroviruses, 100 L of each water sample was filtered using NanoCeram cartridge filters (Argonide Corp., Sanford, FL, USA) as described previously with minor modifications (9). In order to elute noroviruses from the filters, 0.5 L of elution buffer containing 1.5% beef extract (BD Biosciences, San Jose, CA, USA), 0.05 M glycine (Duchefa, St. Louis, MO, USA), and 1 M NaOH (pH 9.5) was used. After a 5-min incubation, the pH of the eluent was adjusted to 3.5 using 1 M HCl, and the precipitate was acquired via centrifugation at 2,500×g at 4°C for 15 min. The precipitate was completely resuspended in 0.15 M sodium phosphate (pH 9.0–9.5), and centrifuged at 10,000×g at 4°C for 10 min. After adjusting to a pH of 7.0–7.5 using 1 M HCl, the supernatant was filtered using a syringe filter (pore size of 0.22 μm, Millipore) and stored at −80°C. Viral nucleic acid extraction was performed using the QIAamp Viral RNA Mini Kit (Qiagen, Hilden, Germany) according to the manufacturer’s instructions. The final eluents (60 μL each) were stored at −20°C until used.
Quantification of Bacteroides markers
Human-specific Bacteroides dorei strain KCTC 5446 (Korean Collection for Type Cultures, Jeongeup, Korea) was cultivated in tryptic soy agar (BD Biosciences) with hemin (Sigma-Aldrich, St Louis, MO, USA) and menadione (Sigma-Aldrich) under anaerobic conditions at 37°C. The bacteria were harvested via centrifugation at 14,000×g at 4°C for 5 min. The bacterial genome was extracted using the G-spin Genomic DNA Extraction Kit for Bacteria (Intron Biotechnology, Seongnam, Korea) following the manufacturer’s instructions, and stored at −20°C until used. The genomes of animal-specific Bacteroides were extracted from 200 mg of chicken, pig, and cow fecal samples. The bacterial genomes from the fecal sample of each animal were extracted with the QIAamp DNA Stool Mini Kit (Qiagen) with minor modifications. Briefly, InhibitEX buffer-treated (1 mL) fecal samples were heated at 95°C for 5 min, and then bead-beaten with 0.1-mm beads for 10 min as described previously (48). The bacterial genomes were subjected to a polymerase chain reaction (PCR) using the ABI PRISM GeneAmp PCR system 9700 (Applied Biosystems, Forster City, CA, USA). Table 1 summarizes the primers and probes for the specific Bacteroides markers used in the present study. The reaction mixture consisted of 2.5 μL of template DNA, 2.5 μL of 10× PCR buffer with 25 mM MgCl2, 1 μL of 10 mM dNTP mix, and 0.25 μL of Taq polymerase (Cosmo Genetech Corp., Seoul, Korea). PCR was performed under the following conditions: initial denaturation at 95°C for 3 min, 30 cycles of denaturation at 95°C for 15 s, annealing at 60°C for 15 s, extension at 72°C for 45 s, and final extension at 72°C for 3 min. PCR products were purified using the QIAquick PCR Purification Kit (Qiagen), and ligated into the pGEM-T Easy Vector System (Promega Corp., Madison, WI, USA) with E. coli DH5α cells following the manufacturer’s instructions. Plasmid DNA was extracted from the transformed cells using a LaboPass Plasmid DNA Purification Kit (Cosmo Genetech Corp.). Plasmid DNA concentrations were measured using the NanoDrop spectrophotometer ND-1000 (NanoDrop Technologies, Wilmington, DE, USA), and the total copies of the markers were computed to quantify the Bacteroides markers, as described previously (22).
Table 1
Primers and probes used for the real-time PCR in this study
| Target |
Primer and probe |
Sequence (5′→3′) |
Final concentration (nM) |
Reference(s) |
Human-specific
Bacteroides |
HF183_F |
ATCATGAGTTCACATGTCCG |
1000 |
12 |
| HF183_R |
TACCCCGCCTACTATCTAATG |
1000 |
| HF183_P |
(FAM) CTGAGAGGAAGGTCCCCCACATTGGA (TAMRA) |
80 |
Poultry-specific
Bacteroides |
qCD362_F |
AATATTGGTCAATGGGCGAGAG |
200 |
19 |
| qCD464_R |
CACGTAGTGTCCGTTATTCCCTTA |
200 |
| qCD394_P |
(FAM) TCCTTCACGCTACTTGG (NFQ-MGB) |
200 |
Pig-specific
Bacteroides |
Pig-2-Bac_F |
GCATGAATTTAGCTTGCTAAATTTGAT |
300 |
28 |
| Pig-2-Bac_R |
ACCTCATACGGTATTAATCCGC |
300 |
| Pig-2-Bac_P |
(VIC) TCCACGGGATAGCC (NFQ-MGB) |
200 |
Ruminant-specific
Bacteroides |
BacR_F |
GCGTATCCAACCTTCCCG |
100 |
35 |
| BacR_R |
CATCCCCATCCGTTACCG |
500 |
| BacR_P |
(FAM) CTTCCGAAAGGGAGATT (NFQ-MGB) |
100 |
| Norovirus GI |
COG1F |
CGYTGGATGCGNTTYCATGA |
400 |
16, Ministry of Food and Drug Safety. 2013. Guideline for investigation on the cause of food poisoning, Chapter 5. Chungcheonbuk-do, Republic of Korea, in Korean |
| COG1R |
CTTAGACGCCATCATCATTYAC |
400 |
| RING1(a)-TP |
(FAM) AGATYGCGATCYCCTGTCCA (TAMRA) |
200 |
| Norovirus GII |
BPO-13 |
AICCIATGTTYAGITGGATGAG |
400 |
Ministry of Food and Drug Safety. 2013. Guideline for investigation on the cause of food poisoning, Chapter 5. Chungcheonbuk-do, Republic of Korea, in Korean |
| BPO-13N |
AGTCAATGTTTAGGTGGATGAG |
400 |
| BPO-14 |
TCGACGCCATCTTCATTCACA |
400 |
| BPO-18 |
(VIC) CACRTGGGAGGGCGATCGCAATC (TAMRA) |
200 |
In order to assess the Bacteroides marker concentrations, real-time quantitative PCR was performed using an Applied Biosystems 7300 Real-time PCR system (Applied Biosystems). The reaction mixture consisted of 2 μL of template DNA, 10 μL of 2× TaqMan Universal PCR Master Mix (Applied Biosystems), and appropriate final concentrations of each primer and probe (Table 1). Real-time PCR was performed in duplicate under the following conditions: 1 cycle at 95°C for 10 min, 45 cycles of 95°C for 15 s, and 60°C for 1 min. All water samples were diluted 10-fold to mitigate PCR inhibitors. As an internal quality control, negative controls (i.e., no template DNA) were performed for each experiment.
Detection of noroviruses using real-time quantitative RT-PCR
Duplex real-time reverse transcriptase PCR was performed to estimate the concentrations of norovirus genogroup I (GI) and genogroup II (GII) in surface and seawater samples (16) (Ministry of Food and Drug Safety. 2013. Guideline for investigation on the cause of food poisoning, Chapter 5. Chungcheonbuk-do, Republic of Korea, in Korean). Quantitative reverse transcription (RT-q) PCR assays were executed with a C1000 Thermal Cycler CFX96 Real-time PCR System (Bio-Rad, Hercules, CA, USA). The RT-qPCR reaction mixture consisted of 5 μL of template RNA, 400 nM of each primer (Table 1), 200 nM of each probe (Table 1), 12.5 μL of 2× RT-PCR buffer, 0.5 μL of 25× RT-PCR enzyme mix, and 1.5 μL of the detection enhancer using the AgPath-ID One-Step RT-PCR Kit (Thermo Fisher Scientific, Waltham, MA, USA). The reaction mixtures were incubated at 45°C for 30 min for the reverse transcription reaction. RT-qPCR was performed under the following conditions: initial denaturation at 95°C for 10 min, 45 cycles of 95°C for 10 s, and 56°C for 1 min. Ten-fold-diluted norovirus RNA-positive controls (AccuPower Norovirus Real-time RT-PCR Kit, Bioneer, Daejeon, Korea) were used to quantify the viral copy number.
Detection of total and fecal coliforms
Total and fecal coliforms in surface and seawater samples were assessed using the standard most probable number (MPN) method (31). Five tubes of lauryl tryptose broth (BD Biosciences) were inoculated with diluted water samples and incubated at 35°C for 48 h. In order to distinguish between total and fecal coliforms, gas-producing samples were re-inoculated in brilliant green bile broth (Oxoid, Hampshire, UK) at 35°C for 48 h and in E. coli broth (BD Biosciences) at 44.5°C for 24 h. Coliform concentrations were calculated based on the MPN table.
Host-specific Bacteroides marker-combined geospatial analysis
The host-specific Bacteroides marker-combined geospatial analysis was performed using ArcGIS ver. 10.2.2 (ESRI, Redlands, CA, USA). Thematic maps denoting administrative divisions, land-use patterns, and watersheds near the sampling sites were obtained from the Korea Water Resources Management Information System (http://www.wamis.go.kr).
Statistical analysis
IBM SPSS ver. 18.0.0 (SPSS, Chicago, IL, USA) and GraphPad Prism software ver. 5.0 (GraphPad Software, San Diego, CA, USA) were used for data analyses. The environmental data obtained in the present study were not normally distributed (Shapiro-Wilk test); therefore, the nonparametric test was used to compare the values of environmental parameters between the two sampling areas. Prior to the statistical analyses, the concentrations of Bacteroides markers, noroviruses, and coliforms were log-transformed (log10 [copies+1]), as described previously (13). Data are expressed as means±standard deviation (SD) and analyzed using the Mann-Whitney U test. P values <0.05 were considered to indicate significance. In correlation analyses between noroviruses and microbial indicators, Spearman’s correlation coefficient (r) was calculated.
Results
Environmental parameters in water samples
Table 2 shows the results of the environmental parameters in water samples from two sampling areas. The median values of water temperature for both surface and seawater from Goseong Bay, 19.4°C and 16.1°C, respectively, were higher than those from Aphae Island. Surface water from Goseong Bay showed the lowest median values of pH (7.3), conductivity (116 μS cm−1), and salinity (0.16 practical salinity unit). Surface water from Goseong Bay showed the highest median value of turbidity (10.80 nephelometric turbidity unit). The highest median values of wind speed (3.5 m s−1) and Prep-3 (8.4 mm) were recorded during sampling for surface water from Aphae Island. The median values for most environmental parameters significantly differed between the two sampling areas (P<0.05). Only wind speed and Prep-3, and salinity and Prep-0 were similar in surface water samples and seawater samples from both sampling areas, respectively.
Table 2
Summary of environmental parameters
| Parameter |
Surface water |
Seawater |
|
|
| Aphae Island |
Goseong Bay |
Aphae Island |
Goseong Bay |
| Water temperature (°C) |
14.7 8.2 (17.0)a |
17.9±6.0 (19.4) |
14.4±6.4 (13.2) |
15.7±7.7 (16.1) |
| pH |
7.8±0.6 (7.9) |
7.3±0.6 (7.3) |
7.8±0.4 (7.9) |
7.8±0.6 (8.1) |
| Conductivity (μS cm−1) |
3,150±8,750 (760) |
961±3,120 (116) |
49,500±1,440 (49,300) |
36,400±7,710 (36,800) |
| Salinity (psub) |
1.88±5.59 (0.37) |
1.49±4.60 (0.16) |
32.26±1.08 (32.13) |
32.42±1.53 (33.01) |
| Turbidity (NTUc) |
15.01±15.85 (10.80) |
7.04±5.24 (5.86) |
8.91±6.31 (7.80) |
1.99±1.02 (1.87) |
| Wind speed (m s−1) |
3.5±1.4 (3.5) |
3.2±1.1 (2.7) |
2.9±1.7 (2.5) |
2.0±0.3 (1.9) |
| Prep-0d (mm) |
0.8±1.7 (0.0) |
12.9±27.5 (0.0) |
7.8±17.0 (0.0) |
0.6±1.1 (0.0) |
| Prep-3e (mm) |
25.1±39.8 (8.4) |
12.8±18.0 (4.3) |
9.1±9.0 (6.6) |
1.1±1.3 (0.5) |
a Mean±standard deviation (median)
b Practical salinity unit
c Nephelometric turbidity unit
d Cumulative precipitation on the sampling day
e Total cumulative precipitation from 3 d before the sampling day
Table 3 summarizes the concentrations and occurrences of host-specific Bacteroides markers in water samples from two sampling areas. Surface and seawater samples from Aphae Island both showed significantly higher mean concentrations of the human-specific Bacteroides marker than those from Goseong Bay (P<0.05). Surface water samples from Aphae Island showed the highest mean concentration (1.1 log10 copies L−1) and occurrence (25%) of the human-specific Bacteroides marker. Moreover, the poultry-specific Bacteroides marker was detected at more than 35% in all types of water samples, and surface water samples from Aphae Island showed the highest mean concentration (1.2 log10 copies L−1) and occurrence (50%). The mean concentration of the pig-specific Bacteroides marker was similar in all water samples, while the ruminant-specific Bacteroides marker was rarely detected.
Table 3
Concentrations and occurrences of host-specific
Bacteroides markers in surface and seawater samples from Aphae Island and Goseong Bay
| Host-specific Bacteroides markers |
Aphae Island |
Goseong Bay |
|
|
| Surface water (n=60) |
Seawater (n=60) |
Surface water (n=66) |
Seawater (n=54) |
|
|
|
|
| Meana±SDb (range) |
Occurrence (%) |
Mean±SD (range) |
Occurrence (%) |
Mean±SD (range) |
Occurrence (%) |
Mean±SD (range) |
Occurrence (%) |
| Human-specific |
1.1±1.9 (NDc-5.7) |
15 (25) |
0.8±1.5 (ND-4.0) |
14 (23) |
0.6±1.3 (ND-4.2) |
10 (15) |
0.3±1.0 (ND-3.7) |
6 (11) |
| Poultry-specific |
1.2±1.3 (ND-3.2) |
30 (50) |
0.9±1.2 (ND-3.4) |
21 (35) |
1.0±1.4 (ND-4.2) |
25 (38) |
0.9±1.2 (ND-3.1) |
21 (39) |
| Pig-specific |
0.7±1.3 (ND-4.6) |
13 (22) |
0.5±1.1 (ND-3.1) |
10 (17) |
0.6±1.3 (ND-3.7) |
12 (18) |
0.5±1.1 (ND-3.2) |
10 (19) |
| Ruminant-specific |
0.1±0.6 (ND-3.2) |
2 (3) |
NDc |
0 (0) |
0.2±0.8 (ND-3.5) |
4 (6) |
0.1±0.5 (ND-2.9) |
2 (4) |
a Unit: log
10 copy number L
−1 Fig. 2 shows the distribution of host-specific Bacteroides markers in surface water samples over the sampling period. Aphae Island samples showed higher concentrations of the human-specific Bacteroides marker than Goseong Bay samples in March 2015, and between September 2015 and January 2016 (Fig. 2a). Aphae Island samples showed the highest mean concentration (2.4 log10 copies L−1) and occurrence (60%) (6 of 10) of the human-specific Bacteroides marker in December 2015, which was significantly higher than that in Goseong Bay samples (P<0.05). Moreover, Aphae Island samples showed a higher mean concentration of the poultry-specific Bacteroides marker than Goseong Bay samples over the entire sampling period, with the exception of samples in July 2015 (Fig. 2b). More than 1.0 log10 copies L−1 of the pig-specific Bacteroides marker were detected in all water samples in both sampling areas between September and December 2015 (Fig. 2c). The ruminant-specific Bacteroides marker was rarely detected during the sampling period (Fig. 2d).
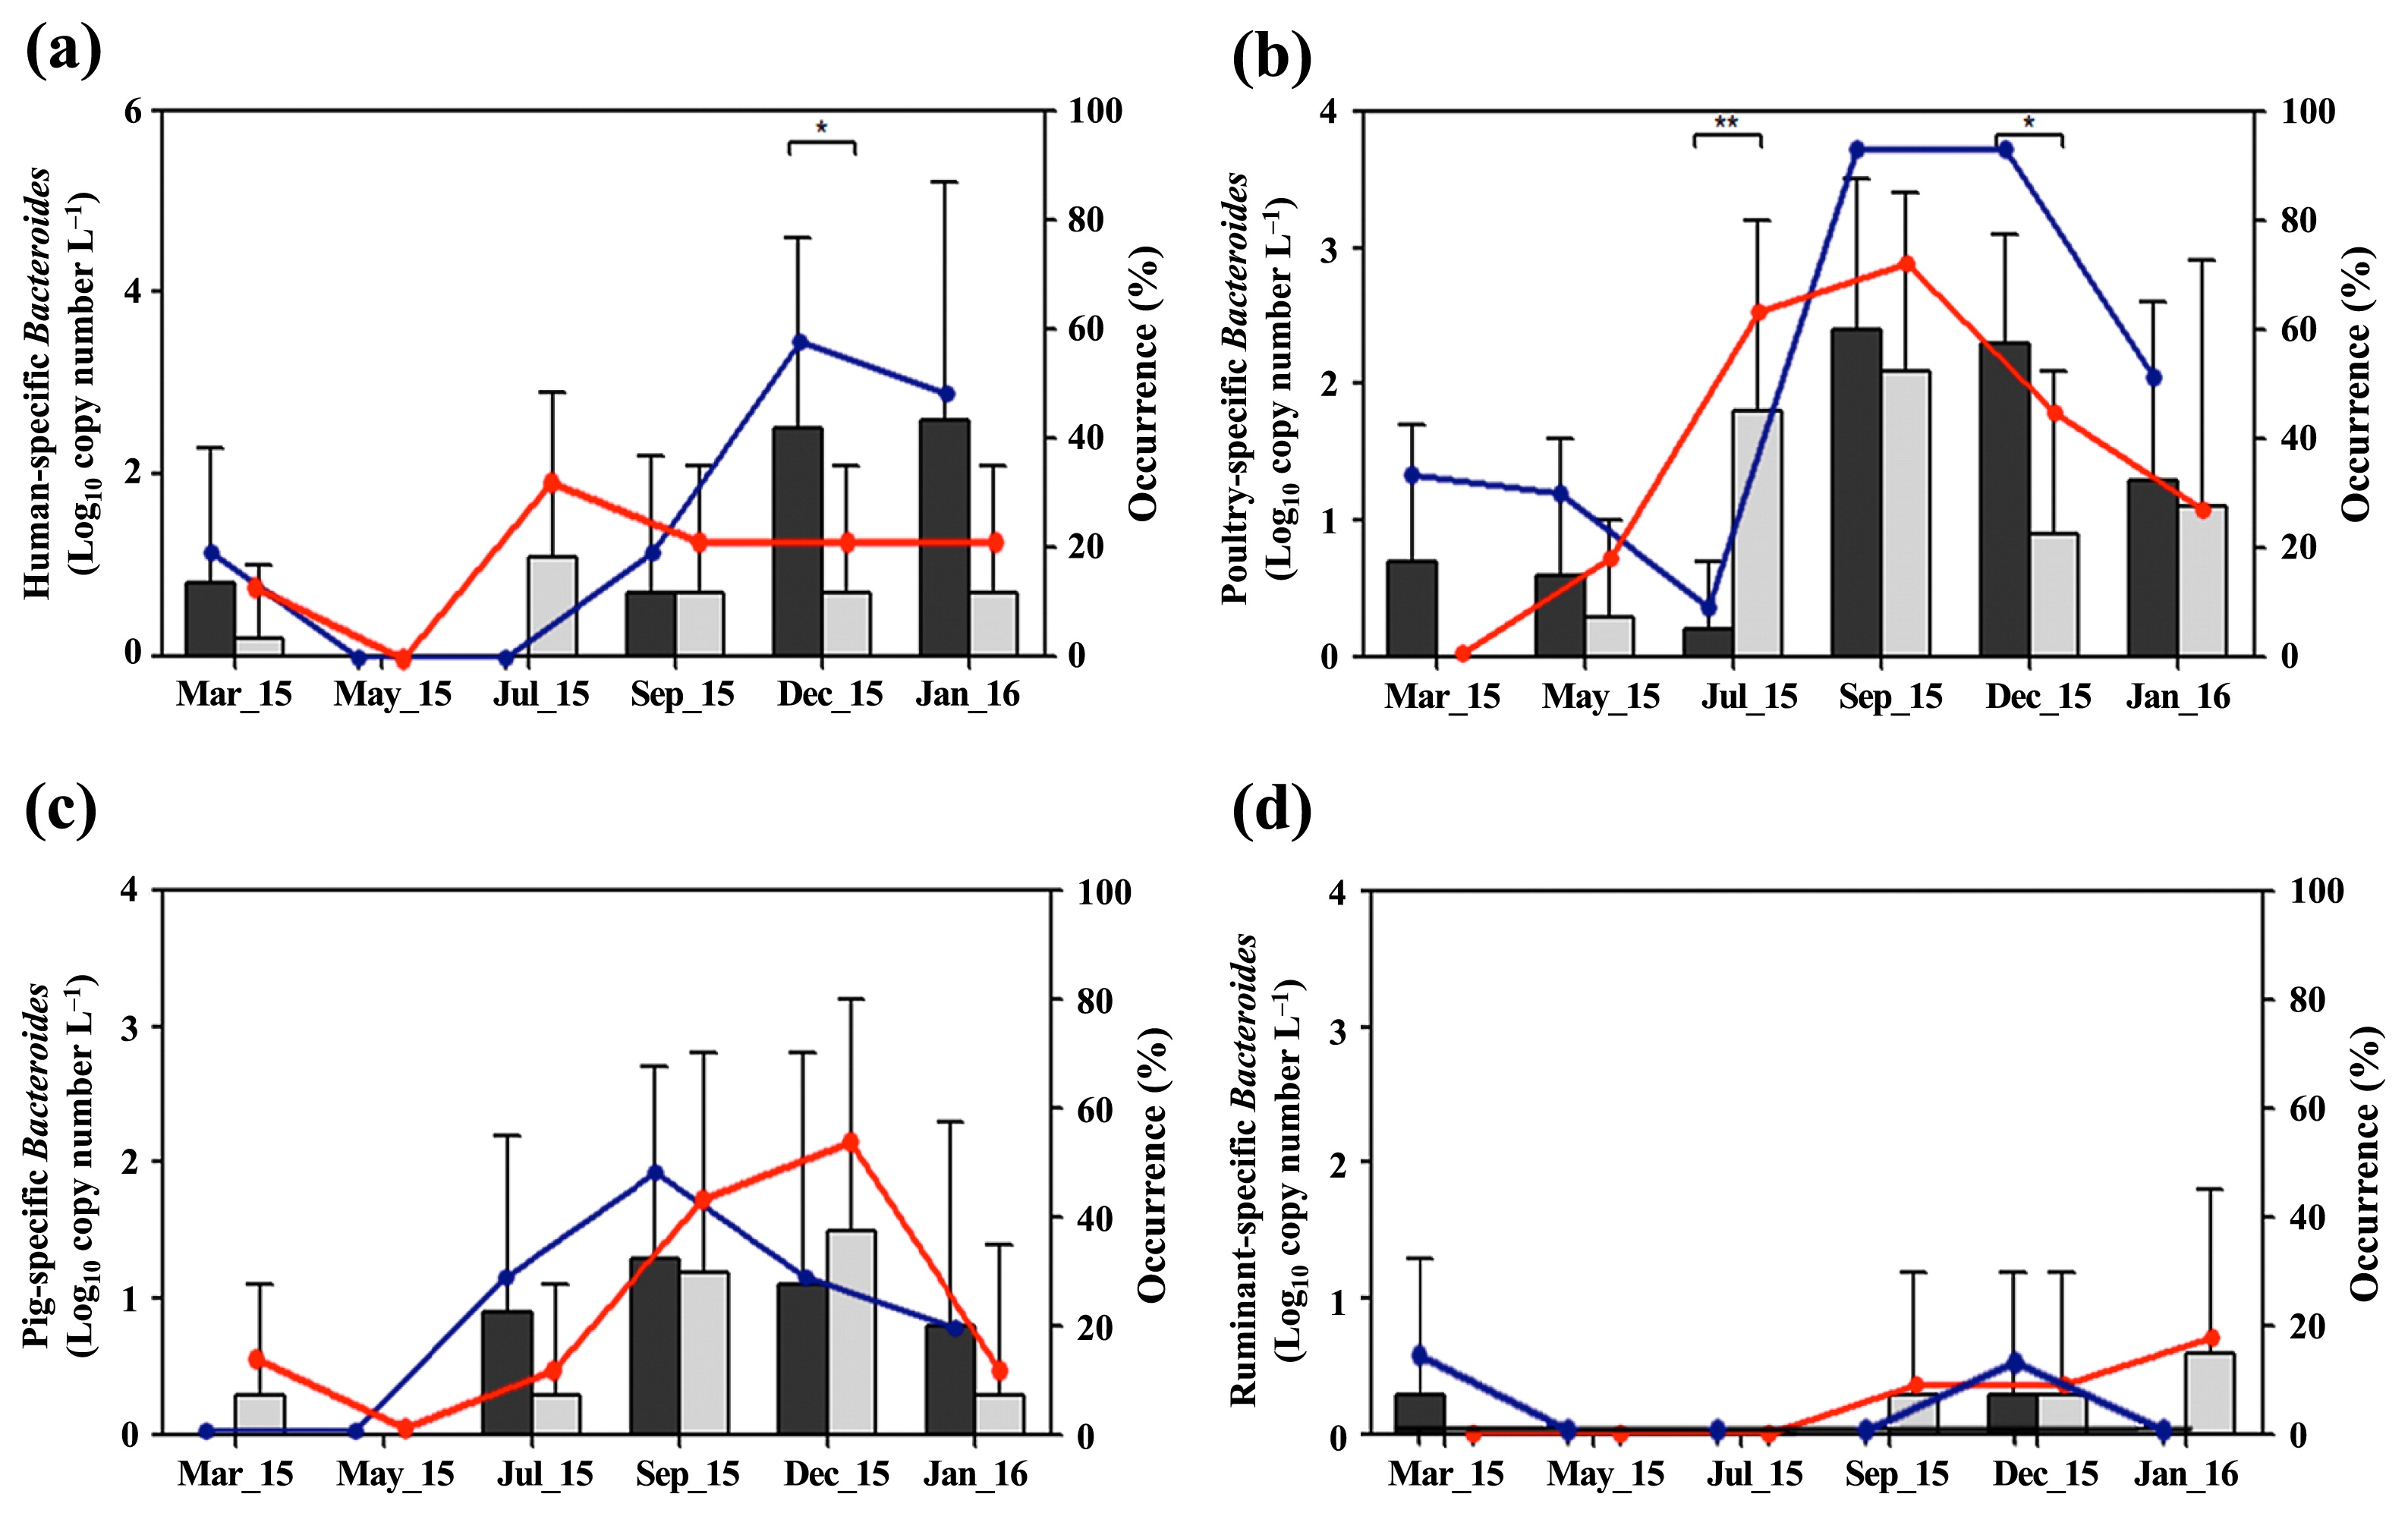
Fig. 3 shows the distribution of host-specific Bacteroides markers in seawater samples during the sampling period. Aphae Island samples showed higher concentrations of the human-specific Bacteroides marker than Goseong Bay samples over the entire sampling period, with the exception of samples obtained in December 2015 (Fig. 3a). In September 2015, Aphae Island samples showed the highest mean concentration (1.6 log10 copies L−1) and occurrence (60%) (6 of 10) of the human-specific Bacteroides marker. Meanwhile, Goseong Bay samples showed higher concentrations of the poultry-specific Bacteroides marker than Aphae Island samples between May and December 2015 (Fig. 3b). In September 2015, Goseong Bay samples showed the highest mean concentration (2.5 log10 copies L−1) and occurrence (100%) (9 of 9) of the poultry-specific Bacteroides marker. Goseong Bay samples showed the highest mean concentration (1.9 log10 copies L−1) and occurrence (67%) (7 of 9) of the pig-specific Bacteroides marker, which was significantly higher than that of Aphae Island samples (P<0.05) (Fig. 3c). Only a few seawater samples were positive for the ruminant-specific Bacteroides marker (Fig. 3d).

Fig. 4 summarizes the results of the host-specific Bacteroides marker-combined geospatial analysis considering land-use patterns on Aphae Island. The surface sampling sites in Stream B, located near a residential area, showed a higher mean concentration of the human-specific Bacteroides marker (Fig. 4a). Sites AUb1 and AUb2 showed 2.7 log10 copies L−1 and 2.8 log10 copies L−1 of the human-specific Bacteroides marker, respectively. Sites AS7 and AS10 showed more than 2.0 log10 copies L−1 of the human-specific Bacteroides marker, as well as the highest occurrence (67%) (4 out of 6). The surface water sampling sites in Streams A and B showed more than 1.0 log10 copies L−1 of the poultry-specific Bacteroides marker, with the exception of Site AUa3 (Fig. 4b). Site AS3, located near Stream B, showed the highest poultry-specific Bacteroides marker concentration (2.1 log10 copies L−1) with an occurrence of 83% (5 out of 6). Moreover, Site AUc2, located near a pig barn, showed 1.9 log10 copies L−1 of the pig-specific Bacteroides marker with an occurrence of 50% (3 of 6), while Site AS10 showed the highest pig-specific Bacteroides marker concentration (2.0 log10 copies L−1) with an occurrence of 67% (4 of 6) (Fig. 4c).

Fig. 5 shows the results of the host-specific Bacteroides marker-combined geospatial analysis in Goseong Bay. Site GUb3, located downstream of a residential area, showed the highest mean concentration of the human-specific Bacteroides marker (1.7 log10 copies L−1) with an occurrence of 50% (3 of 6) (Fig. 5a). The surface water sampling sites in Streams A and B showed more than 1.0 log10 copies L−1 of the poultry-specific Bacteroides marker, with the exception of Site GUb3 (Fig. 5b). Sites GS1 and GS5, located near Streams A and B, showed more than 1.0 log10 copies L−1 of the poultry-specific Bacteroides marker and an occurrence of 50% (3 of 6). Moreover, three seawater sampling sites (GS7, GS8, and GS9) located near streams C and D showed more than 1.0 log10 copies L−1 of the poultry-specific Bacteroides marker. In addition, Site GUa3 showed the highest mean concentration of the pig-specific Bacteroides marker (1.6 log10 copies L−1) with an occurrence of 50% (3 of 6) (Fig. 5c). The water sampling sites in stream C showed more than 1.0 log10 copies L−1 of the pig-specific Bacteroides marker. Site GUa2, located in Stream A, showed the highest concentration of the ruminant-specific Bacteroides marker (1.1 log10 copies L−1) with an occurrence of 33% (2 of 6) (Fig. 5d).

Table S1 summarizes the concentrations of host-specific Bacteroides markers in the streams located at Aphae Island and Goseong Bay over the sampling period. Between December 2015 and January 2016, Stream A samples from Aphae Island showed more than 5.0 log10 copies L−1 of the human-specific Bacteroides marker. Four Stream B samples from Aphae Island showed more than 3.7 log10 copies L−1 of the human-specific Bacteroides marker. With the exception of March 2015, the poultry-specific Bacteroides marker was detected in Stream A samples from Aphae Island. Moreover, Stream B and A samples from Goseong Bay showed the highest occurrences (5 of 6) (83%) of the human-specific Bacteroides marker and poultry-specific Bacteroides marker, respectively.
Concentrations of noroviruses and coliforms in water samples
Table 4 summarizes the concentrations and occurrences of noroviruses and coliforms in surface water samples. Aphae Island samples showed significantly higher mean concentrations of noroviruses than those of Goseong Bay samples (P<0.001), which were 1.4 log10 copies L−1 of norovirus GI with an occurrence of 37% (22 of 60) and 1.9 log10 copies L−1 of norovirus GII with an occurrence of 43% (26 of 60). In contrast, the mean coliform concentration was higher in Goseong Bay than in Aphae Island (P<0.05). Noroviruses and coliforms were not detected in any of the seawater samples.
Table 4
Concentrations and occurrences of noroviruses and coliforms in surface water samples from Aphae Island and Goseong Bay
| Types |
Aphae island |
Goseong bay |
|
|
| Surface water (n=60) |
Surface water (n=66) |
|
|
| Mean±SD (range)a |
Occurrence (%) |
Mean±SD (range) |
Occurrence (%) |
| Norovirus GI |
1.4±1.9 (ND-5.6) |
22 (37) |
0.8±1.7 (ND-5.9) |
13 (20) |
| Norovirus GII |
1.9±2.2 (ND-5.5) |
26 (43) |
0.8±1.6 (ND-5.7) |
13 (20) |
| Total coliforms |
4.3±1.2 (1.7–6.2) |
60 (100) |
4.4±1.1 (1.3–8.2) |
66 (100) |
| Fecal coliforms |
3.2±1.4 (1.3–6.2) |
60 (100) |
3.8±1.3 (1.3–8.2) |
66 (100) |
a Unit: log
10 copy number L
−1 (noroviruses); log
10 MPN L
−1 (coliforms)
Table 5 shows the results of the correlation analysis of host-specific Bacteroides, noroviruses, and coliforms in surface water samples. The concentration of noroviruses (GI and GII) correlated more strongly with the concentration of the human-specific Bacteroides marker (r=0.337; P<0.001) than total (r=0.304; P<0.01) or fecal coliforms (r=0.223; P<0.01). In contrast, noroviruses (GI and GII) showed a negative correlation with the pig-specific Bacteroides marker (r=−0.173; P<0.05), and exhibit no correlations with poultry- or ruminant-specific Bacteroides markers. Neither coliform correlated with the human-specific Bacteroides marker.
Table 5
Spearman’s correlation coefficients among
Bacteroides markers, noroviruses, and coliforms in surface water samples from Aphae Island and Goseong Bay
| Types |
Human-specific Bacteroides marker |
Poultry-specific Bacteroides marker |
Pig-specific Bacteroides marker |
Ruminant-specific Bacteroides marker |
Norovirus GI |
Norovirus GII |
Norovirus GI+GII |
Total coliforms |
Fecal coliforms |
| Human-specific Bacteroides marker |
1.000 |
|
|
|
|
|
|
|
|
| Poultryspecific Bacteroides marker |
0.259**a |
1.000 |
|
|
|
|
|
|
|
| Pig-specific Bacteroides marker |
0.184* |
0.132 |
1.000 |
|
|
|
|
|
|
| Ruminant-specific Bacteroides marker |
0.125 |
0.069 |
0.192* |
1.000 |
|
|
|
|
|
| Norovirus GI |
0.263** |
−0.059 |
−0.135 |
−0.046 |
1.000 |
|
|
|
|
| Norovirus GII |
0.374*** |
0.010 |
−0.196* |
−0.061 |
0.877*** |
1.000 |
|
|
|
| Norovirus GI+GII |
0.337*** |
−0.019 |
−0.173* |
−0.067 |
0.934*** |
0.969*** |
1.000 |
|
|
| Total coliforms |
0.078 |
−0.112 |
−0.028 |
−0.035 |
0.299** |
0.296** |
0.304** |
1.000 |
|
| Fecal coliforms |
0.124 |
−0.128 |
0.050 |
−0.032 |
0.0236** |
0.214* |
0.233** |
0.835*** |
1.000 |
a Asterisks indicate significant differences (*
P<0.05, **
P<0.01, ***
P<0.001)
Discussion
In the present study, marked differences were observed in several environmental parameters between the two sampling areas (Table 2). A previous study suggested that environmental parameters indicating the water condition, such as temperature, conductivity, pH, and salinity, significantly affected the concentrations of qPCR markers for fecal indicator bacteria (29). Moreover, as previously reported, rainfall events may be a major transporter of feces in water environments (24). Therefore, several environmental factors closely related to rainfall events, such as Prep-0 and Prep-3, may also affect the concentrations of host-specific Bacteroides in both areas. However, in future studies, water quality data, such as ammonium, dissolved oxygen, and chemical oxygen demands, also need to be investigated due to their potential effects on the concentrations of host-specific Bacteroides.
All of the water samples examined in the present study showed a more than 10% of occurrence of the human-, poultry-, and pig-specific Bacteroides markers, indicating that Bacteroides spp. markers were widely present in the studied areas as well as their suitability as markers. The mean concentration and occurrence of the poultry- and pig-specific Bacteroides markers in surface water samples from Aphae Island were higher than those from Goseong Bay (Table 3), which may have been affected by the number of animals nearby (Statistics Korea, http://kosis.kr/). However, human-specific Bacteroides marker concentrations were significantly higher in Aphae Island samples than in Goseong Bay samples (P<0.05), even though Goseong Bay had a greater residential population than Aphae Island. These results may have been due to the public sewage treatment connect rate, which is higher in Goseong Bay (85.5%) than in Aphae Island (19.6%) (National Sewer Information System, https://www.hasudoinfo.or.kr/). Residents unconnected to the public sewage treatment system may directly or indirectly affect the aquatic environment (Gyeongnam development institute. 2011. A study on improvement of water quality in Milyanggang. Gyeongsangnam-do, Republic of Korea, in Korean). Therefore, improvements in the public sewage treatment system connection rate need to be considered in order to prevent the fecal contamination of aquatic environments (14).
In the present study, high mean concentrations of host-specific Bacteroides markers were often detected between autumn and early winter (September to December 2015) regardless of the geographical condition or water type (Fig. 2 and 3). Temperature is a major factor affecting the persistence of Bacteroides spp. in the environment (4). Moreover, Bacteroides-originating genetic markers exhibit greater persistence at low temperatures in surface and seawater because low temperatures prevent Bacteroides 16S rRNA gene decay (33, 46). Therefore, temperature changes in water need to be considered in microbial source tracking using host-specific Bacteroides markers because changes in temperature may result in the over- or underestimation of fecal contaminants (19). However, due to the number of fecal sources, further longitudinal research with mass balance and load analyses of fecal contamination is necessary in order to track host-specific Bacteroides markers in the study areas.
The host-specific Bacteroides marker-combined geospatial analysis revealed the up-to-downstream gradient of fecal contamination, indicating that surface water affects the fecal contamination of seawater (Fig. 4 and 5). Table S1 also showed the temporal tendencies of the high concentrations of host-specific Bacteroides markers in autumn to winter (September 2015 to January 2016) in stream samples. However, streams located near residential areas, including Stream B in Aphae Island and Streams A and B in Goseong Bay, generally showed higher concentrations of human, poultry, and pig-specific Bacteroides markers over the sampling period than other streams. Therefore, the land use pattern may be closely related to the concentrations of host-specific Bacteroides markers. According to the land use pattern, the concentrations of host-specific Bacteroides markers showed clear variations in both study areas. Previous studies reported that the concentrations of fecal indicators were high in water bodies near residential areas (41, 47). In the present study, the sampling sites located near densely populated residential areas showed higher mean concentrations of the human-specific Bacteroides marker. The sampling sites near residential areas also showed high mean concentrations of poultry- and pig-specific Bacteroides markers (Fig. 4 and 5). This may be explained by the characteristics of these areas, at which small-scale livestock breeding occurs in residential areas, and high concentrations of Bacteroides markers may have been observed due to the application of fertilizers containing human or animal feces (30, 42). Furthermore, the results obtained for the high host-specific Bacteroides marker concentrations in populated areas indicated that transportation is important for the fecal contamination of study areas. Therefore, further studies using Bacteroides marker-combined geospatial analyses need to be designed with the major routes and daily loads of transportation for precise fecal source tracking in aquaculture areas. The results of the present study demonstrated that the host-specific Bacteroides marker-combined geospatial analysis has potential as a useful tool for predicting the environmental effects of potential fecal sources.
Moreover, our results demonstrated that the human-specific Bacteroides marker correlated more strongly with human noroviruses than total or fecal coliforms (P<0.001) (Table 5). Previous studies reported that the presence of several enteric viruses, including human adenoviruses, polyomaviruses, and noroviruses, correlated with human-associated Bacteroides spp. in aquatic environments (15, 27). Therefore, since human-specific Bacteroides and human noroviruses both share strong human specificity (25), human-specific Bacteroides markers may be used to trace the waterborne transmission of human noroviruses originating from virus-contaminated feces.
The results of the present study indicate that the host-specific Bacteroides markers used herein are suitable genetic markers for fecal source tracking regardless of geographical differences, such as those between open islands (Aphae Island) and enclosed bays (Goseong Bay). Despite seasonal trends in concentrations and occurrences, the host-specific Bacteroides marker-combined geospatial analysis showed a clear transition in fecal contamination. Furthermore, the human-specific Bacteroides marker correlated with human noroviruses. Therefore, host-specific Bacteroides markers with an advanced geospatial analysis appear to be useful for tracking fecal contamination in aquatic environments.
Acknowledgements
This research was supported by a grant (14162MFDS973) from the Ministry of Food and Drug Safety in 2016, a National Research Foundation of Korea (NRF) grant (NRF-2015M3C9A4053391), and the BK21 plus program of NRF (22A20130012682).
References
- 1. Ahmed, W., T. Sritharan, A. Palmer, J.P.S. Sidhu, and S. Tozea. 2013. Evaluation of bovine feces-associated microbial source tracking markers and their correlations with fecal indicators and zoonotic pathogens in a Brisbane, Australia, reservoir. Appl Environ Microbiol. 79:2682-2691.
- 2. Bae, S., and S. Wuertz. 2009. Rapid decay of host-specific fecal Bacteroidales cells in seawater as measured by quantitative PCR with propidium monoazide. Water Res. 43:4850-4859.
- 3. Baudart, J., J. Grabulos, J.-P. Barusseau, and P. Lebaron. 2000. Salmonella spp. and fecal coliform loads in coastal waters from a point vs. nonpoint source of pollution. J Environ Qual. 29:241-250.
- 4. Bell, A., A.C. Layton, L. McKay, D. Williams, R. Gentry, and G.S. Sayler. 2009. Factors influencing the persistence of fecal in stream water. J Environ Qual. 38:1224-1232.
- 5. Cho, H.G., S.G. Lee, M.Y. Lee, E.S. Hur, J.S. Lee, P.H. Park, Y.B. Park, M.H. Yoon, and S.Y. Paik. 2016. An outbreak of norovirus infection associated with fermented oyster consumption in South Korea, 2013. Epidemiol Infect. 144:2759-2764.
- 6. Dheenan, P.S., D.K. Jha, A.K. Das, N.V. Vinithkumar, M.P. Devi, and R. Kirubagaran. 2016. Geographic information systems and multivariate analysis to evaluate fecal bacterial pollution in coastal waters of Andaman, India. Environ Pollut. 214:45-53.
- 7. Dick, L.K., A.E. Bernhard, T.J. Brodeur, J.W. Santo Domingo, J.M. Simpson, S.P. Walters, and K.G. Field. 2005. Host distributions of uncultivated fecal Bacteroidales bacteria reveal genetic markers for fecal source identification. Appl Environ Microbiol. 71:3184-3191.
- 8. Field, K.G., and M. Samadpour. 2007. Fecal source tracking, the indicator paradigm, and managing water quality. Water Res. 41:3517-3538.
- 9. Fout, G., N. Brinkman, J. Cashdollar, S. Griffin, E. Varughese, and S. Parshionikar. 2016. Method 1615 measurement of enterovirus and norovirus occurrence in water by culture and qRT-PCR. Part III. Virus detection by RT-qPCR. J Visualized Exp. 107:52646.
- 10. Gourmelon, M., M.P. Caprais, C. Mennec, S. Mieszkin, C. Ponthoreau, and M. Gendronneau. 2010. Application of library-independent microbial source tracking methods for identifying the sources of faecal contamination in coastal areas. Water Sci Technol. 61:1401-1409.10.2166/wst.2010.033.
- 11. Han, J.C., Q. Jo, Y.C. Park, T.G. Park, D.C. Lee, and K.C. Cho. 2013. A report on the mass summer mortalities of the farmed Pacific oysters, Crassostrea gigas and Bay scallops Argopecten irradians in the local waters of Goseong Bay, Korea. Korean J Malacol. 29:239-244.
- 12. Haugland, R.A., M. Varma, M. Sivaganesan, C. Kelty, L. Peed, and O.C. Shanks. 2010. Evaluation of genetic markers from the 16S rRNA gene V2 region for use in quantitative detection of selected Bacteroidales species and human fecal waste by qPCR. Syst Appl Microbiol. 33:348-357.
- 13. Hayden, R.T., Z. Gu, J. Ingersoll, D. Abdul-Ali, L. Shi, S. Pounds, and A.M. Caliendo. 2013. Comparison of droplet digital PCR to real-time PCR for quantitative detection of cytomegalovirus. J Clin Microbiol. 51:540-546.
- 14. Hendricks, R., and E.J. Pool. 2012. The effectiveness of sewage treatment processes to remove faecal pathogens and antibiotic residues. J Environ Sci Health, Part A: Toxic/Hazard Subst Environ Eng. 47:289-297.
- 15. Hughes, B., D.J. Beale, P.G. Dennis, S. Cook, and W. Ahmed. 2017. Cross-comparison of human wastewater-associated molecular markers in relation to fecal indicator bacteria and enteric viruses in recreational beach waters. Appl Environ Microbiol. 83:e00028-17.
- 16. Kageyama, T., S. Kojima, M. Shinohara, K. Uchida, S. Fukushi, F.B. Hoshino, N. Takeda, and K. Katayama. 2003. Broadly reactive and highly sensitive assay for Norwalk-like viruses based on real-time quantitative reverse transcription-PCR. J Clin Microbiol. 41:1548-1557.
- 17. Kildare, B.J., C.M. Leutenegger, B.S. McSwain, D.G. Bambic, V.B. Rajal, and S. Wuertz. 2007. 16S rRNA-based assays for quantitative detection of universal, human-, cow-, and dog-specific fecal Bacteroidales: A Bayesian approach. Water Res. 41:3701-3715.
- 18. Kobayashi, A., D. Sano, J. Hatori, S. Ishii, and S. Okabe. 2013. Chicken-and duck-associated Bacteroides-Prevotella genetic markers for detecting fecal contamination in environmental water. Appl Microbiol Biotechnol. 97:7427-7437.
- 19. Kobayashi, A., D. Sano, and S. Okabe. 2013. Effects of temperature and predator on the persistence of host-specific Bacteroides-Prevotella genetic markers in water. Water Sci Technol. 67:838-845.
- 20. Layton, A., L. McKay, D. Williams, V. Garrett, R. Gentry, and G. Sayler. 2006. Development of Bacteroides 16S rRNA gene TaqMan-based real-time PCR assays for estimation of total, human, and bovine fecal pollution in water. Appl Environ Microbiol. 72:4214-4224.
- 21. Leclerc, H., L. Schwartzbrod, and E. Dei-Cas. 2002. Microbial agents associated with waterborne diseases. Crit Rev Microbiol. 28:371-409.
- 22. Lee, C., J. Kim, S.G. Shin, and S. Hwang. 2006. Absolute and relative QPCR quantification of plasmid copy number in Escherichia coli. J Biotechnol. 123:273-280.
- 23. Lee, T.S., E.G. Oh, H.D. Yu, K.S. Ha, H.S. Yu, H.S. Byun, and J.H. Kim. 2010. Impact of rainfall events on the bacteriological water quality of the shellfish growing area in Korea. Korean J Fish Aquat Sci. 43:406-414.
- 24. Leight, A., R. Hood, R. Wood, and K. Brohawn. 2016. Climate relationships to fecal bacterial densities in Maryland shellfish harvest waters. Water Res. 89:270-281.
- 25. Liang, L., S.G. Goh, G.G.R. Vergara, et al. 2015. Alternative fecal indicators and their empirical relationships with enteric viruses, Salmonella enterica, and Pseudomonas aeruginosa in surface waters of a tropical urban catchment. Appl Environ Microbiol. 81:850-860.
- 26. Liang, Z., Z. He, X. Zhou, C.A. Powell, Y. Yang, L.M. He, and P.J. Stoffella. 2013. Impact of mixed land-use practices on the microbial water quality in a subtropical coastal watershed. Sci Total Environ. 449:426-433.
- 27. McQuaig, S., J. Griffith, and V.J. Harwood. 2012. Association of fecal indicator bacteria with human viruses and microbial source tracking markers at coastal beaches impacted by nonpoint source pollution. Appl Environ Microbiol. 78:6423-6432.
- 28. Mieszkin, S., J.P. Furet, G. Corthier, and M. Gourmelon. 2009. Estimation of pig fecal contamination in a river catchment by real-time PCR using two pig-specific Bacteroidales 16S rRNA genetic markers. Appl Environ Microbiol. 75:3045-3054.
- 29. Molina, M., S. Hunter, M. Cyterski, L.A. Peed, C.A. Kelty, M. Sivaganesan, T. Mooney, L. Prieto, and O.C. Shanks. 2014. Factors affecting the presence of human-associated and fecal indicator real-time quantitative PCR genetic markers in urban-impacted recreational beaches. Water Res. 64:196-208.
- 30. Nshimyimana, J.P., E. Ekklesia, P. Shanahan, L.H.C. Chua, and J.R. Thompson. 2014. Distribution and abundance of human-specific Bacteroides and relation to traditional indicators in an urban tropical catchment. J Appl Microbiol. 116:1369-1383.
- 31. Oblinger, J.L., and J.A. Koburger. 1975. Understanding and teaching the most probable number technique. J Milk Food Technol. 38:540-545.
- 32. Ohad, S., D. Vaizel-Ohayon, M. Rom, J. Guttman, D. Berger, V. Kravitz, S. Pilo, Z. Huberman, Y. Kashi, and E. Rorman. 2015. Microbial source tracking in adjacent Karst springs. Appl Environ Microbiol. 81:5037-5047.
- 33. Okabe, S., and Y. Shimazu. 2007. Persistence of host-specific Bacteroides-Prevotella 16S rRNA genetic markers in environmental waters: effects of temperature and salinity. Appl Microbiol Biotechnol. 76:935-944.
- 34. Pratt, B., and H. Chang. 2012. Effects of land cover, topography, and built structure on seasonal water quality at multiple spatial scales. J Hazard Mater. 209–210:48-58.
- 35. Reischer, G.H., D.C. Kasper, R. Steinborn, R.L. Mach, and A.H. Farnleitner. 2006. Quantitative PCR method for sensitive detection of ruminant fecal pollution in freshwater and evaluation of this method in alpine karstic regions. Appl Environ Microbiol. 72:5610-5614.
- 36. Domingo Santo, J.W., D.G. Bambic, T.A. Edge, and S. Wuertz. 2007. Quo vadis source tracking? Towards a strategic framework for environmental monitoring of fecal pollution. Water Res. 41:3539-3552.
- 37. Savichtcheva, O., and S. Okabe. 2006. Alternative indicators of fecal pollution: relations with pathogens and conventional indicators, current methodologies for direct pathogen monitoring and future application perspectives. Water Res. 40:2463-2476.
- 38. Schriewer, A., W.A. Miller, B.A. Byrne, et al. 2010. Presence of Bacteroidales as a predictor of pathogens in surface waters of the central California coast. Appl Environ Microbiol. 76:5802-5814.
- 39. Scott, T.M., J.B. Rose, T.M. Jenkins, R. Samuel, J. Lukasik, and S.R. Farrah. 2002. Microbial source tracking: current methodology and future directions. Appl Environ Microbiol. 68:5796-5803.
- 40. Shin, S.B., E. Oh, H. Lee, Y.K. Kim, T.S. Lee, and J. Kim. 2014. Norovirus quantification in oysters Crassostrea gigas collected from Tongyeoung, Korea. Korean J Fish Aquat Sci. 47:501-507.
- 41. St Laurent, J., and A. Mazumder. 2012. The influence of land-use composition on fecal contamination of riverine source water in southern British Columbia. Water Resour Res. 48:1-11.
- 42. Tiefenthaler, L., E.D. Stein, and K. Schiff. 2008. Origins and mechanisms of watershed and land use based sources of fecal indicator bacteria in urban stormwater, p.153-161. In S.B. Weisberg, and K. Miller (ed.), Southern California Coastal Water Research Project 2008 Annual Report, Costa Mesa, CA.
- 43. Toledo-Hernandez, C., H. Ryu, J. Gonzalez-Nieves, E. Huertas, G.A. Toranzos, and J.W. Santo Domingo. 2013. Tracking the primary sources of fecal pollution in a tropical watershed in a one-year study. Appl Environ Microbiol. 79:1689-1696.
- 44. Verhougstraete, M.P., S.L. Martin, A.D. Kendall, D.W. Hyndman, and J.B. Rose. 2015. Linking fecal bacteria in rivers to landscape, geochemical, and hydrologic factors and sources at the basin scale. Proc Natl Acad Sci USA. 112:10419-10424.
- 45. Walters, S.P., V.P. Gannon, and K.G. Field. 2007. Detection of Bacteroidales fecal indicators and the zoonotic pathogens E. coli O157: H7, Salmonella, and Campylobacter in river water. Environ Sci Technol. 41:1856-1862.
- 46. Walters, S.P., and K.G. Field. 2009. Survival and persistence of human and ruminant-specific faecal Bacteroidales in freshwater microcosms. Environ Microbiol. 11:1410-1421.
- 47. Walters, S.P., A.L. Thebo, and A.B. Boehm. 2011. Impact of urbanization and agriculture on the occurrence of bacterial pathogens and stx genes in coastal waterbodies of central California. Water Res. 45:1752-1762.
- 48. Yu, Z., and M. Morrison. 2004. Improved extraction of PCR-quality community DNA from digesta and fecal samples. Biotechniques. 36:808-812.
