Abstract
Accretionary prisms are thick layers of sedimentary material piled up at convergent plate boundaries. Large amounts of anaerobic groundwater and methane (CH4) are contained in the deep aquifers associated with accretionary prisms. In order to identify microbial activity and CH4 production processes in the deep aquifers associated with the Cretaceous accretionary prism in Okinawa Island, Japan, we performed geochemical and microbiological studies using anaerobic groundwater and natural gas (mainly CH4) samples collected through four deep wells. Chemical and stable hydrogen and oxygen isotope analyses of groundwater samples indicated that the groundwater samples obtained from each site originated from ancient seawater and a mixture of rainwater and seawater, respectively. Additionally, the chemical and stable carbon isotopic signatures of groundwater and natural gas samples suggested that CH4 in the natural gas samples was of a biogenic origin or a mixture of biogenic and thermogenic origins. Microscopic observations and a 16S rRNA gene analysis targeting microbial communities in groundwater samples revealed the predominance of dihydrogen (H2)-producing fermentative bacteria and H2-utilizing methanogenic archaea. Moreover, anaerobic cultures using groundwater samples suggested a high potential for CH4 production by a syntrophic consortium of H2-producing fermentative bacteria and H2-utilizing methanogenic archaea through the biodegradation of organic substrates. Collectively, our geochemical and microbiological data support the conclusion that the ongoing biodegradation of organic matter widely contributes to CH4 production in the deep aquifers associated with the Cretaceous accretionary prism.
Accretionary prisms are thick layers of sedimentary material piled up at convergent plate boundaries. These materials originated from ancient marine sediments that were deposited on a subducting ocean plate and accreted onto a non-subducting continental plate (47). Accretionary prisms are found in large regions of the world, including Alaska and Washington in the U.S., New Zealand, Chile, Peru, Indonesia, Taiwan, Russia, and Japan (15, 19, 23, 26).
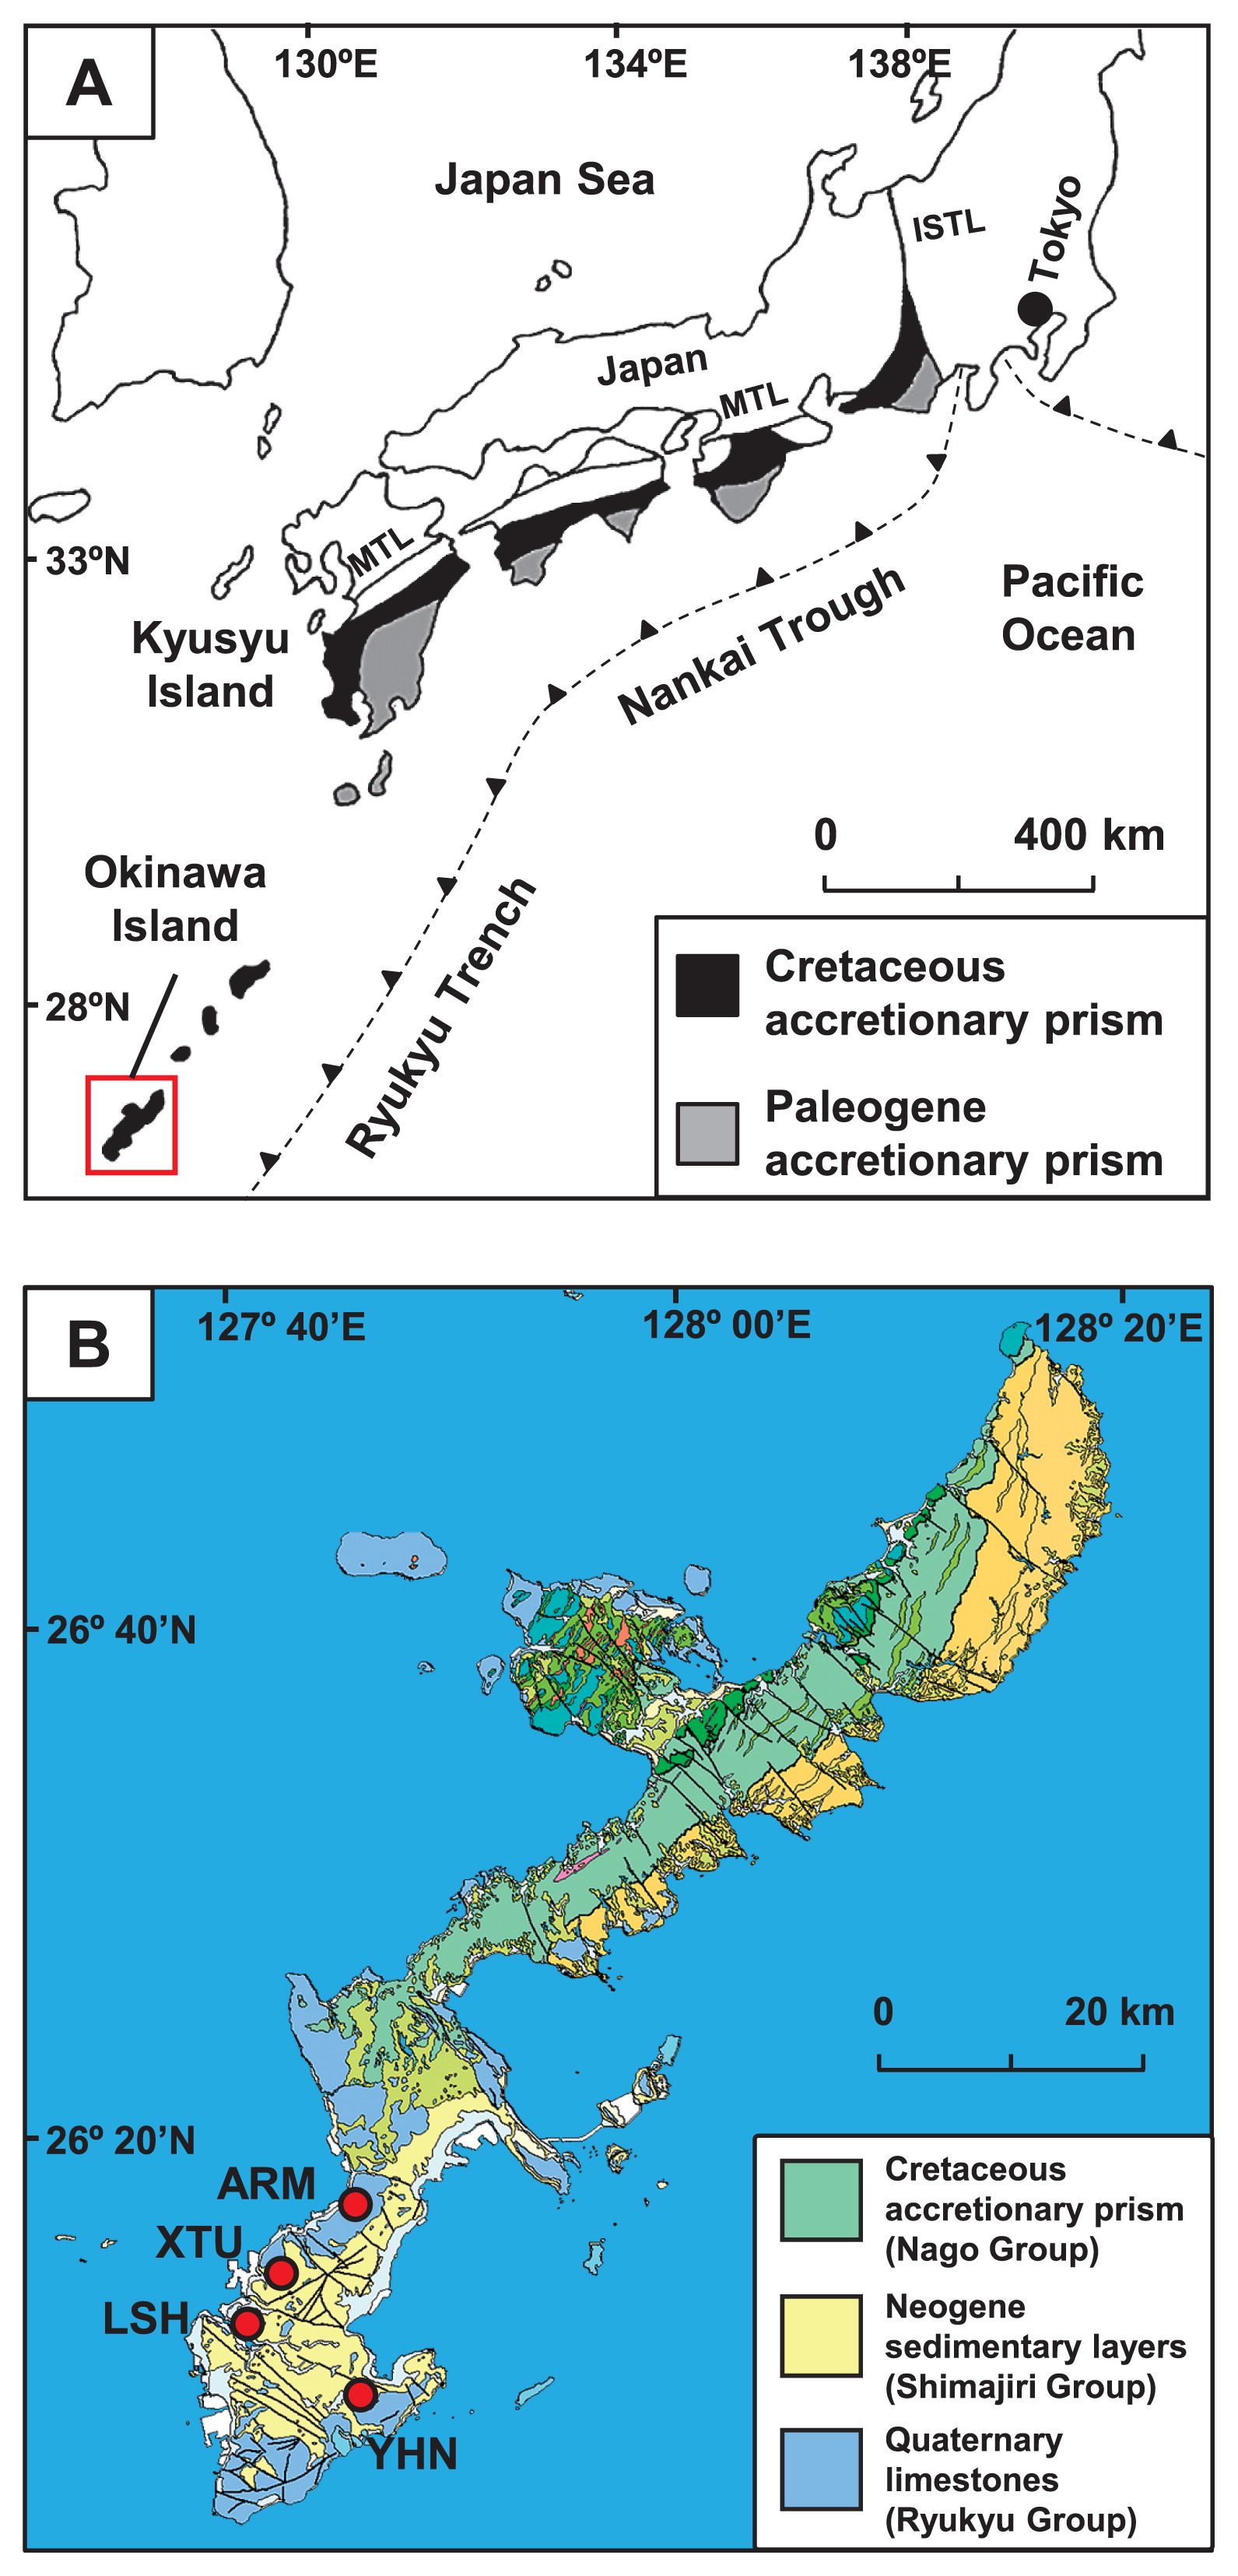
The Shimanto Belt in southwest Japan is a typical and highly studied accretionary prism. The Shimanto Belt was mainly formed during the Cretaceous and Paleogene Periods and originated from ancient marine sediments that were deposited on the Philippine Sea Plate (23). These sediments are approximately 10 km thick and traceable laterally for 1,800 km in parallel with the Nankai Trough and Ryukyu Trench (Fig. 1A) (46). They are mainly composed of non- to weakly metamorphosed sequences of sandstone, mudstone, chert, and greenstone. Groundwater is primarily recharged by rainwater and seawater that infiltrates into outcrops or faults, then flows down through permeable sandstone and is anaerobically reserved in deep aquifers. In addition to anaerobic groundwater, a high concentration of natural gas, mainly methane (CH4), is contained in deep aquifers (27, 32, 43).
It is generally accepted that the origin of CH4 in natural gas reserves in subsurface sedimentary deposits is either biogenic (formed by methanogenic archaea) or thermogenic (formed by the thermal degradation of organic matter in sedimentary layers). Previous studies performed a series of geochemical and microbiological analyses of anaerobic groundwater and natural gas derived from deep aquifers of the Paleogene accretionary prism distributed in southwest Japan. Based on their findings, these studies suggested a syntrophic consortium model in deep aquifers, in which the anaerobic biodegradation of organic matter in the sediment mediated by H2-producing fermentative bacteria and H2-utilizing methanogenic archaea contribute to CH4 production (4, 27, 32).
The anaerobic deep aquifers associated with accretionary prisms are considered to contain large amounts of CH4. This CH4 is a potential greenhouse gas and important energy resource. However, all of the research on the CH4 production process conducted to date has targeted the Paleogene accretionary prism. Although Cretaceous accretionary prisms are also distributed across large regions of the world, microbial activity and CH4 production processes in the deep aquifers of older accretionary prisms remain unknown.
Therefore, the objectives of the present study were to reveal the microbial activity and CH4 production process in deep aquifers associated with the Cretaceous accretionary prism in Okinawa Island, Japan. We collected anaerobic groundwater and natural gas samples derived from deep aquifers through deep wells, and subjected them to a series of geochemical and microbiological analyses. The microbial activity and CH4 production process revealed in the present study were compared with those previously reported in deep aquifers of the Paleogene accretionary prism.
Materials and Methods
Study site and sample collection
Okinawa Island has an area of 1,207 km2 and is located approximately 640 km south of Kyusyu Island, Japan (Fig. 1A). The accretionary prism known as the Nago Group (mainly Cretaceous) in the Shimanto Belt is distributed over the island (Fig. 1B) (35, 50). The Nago Group is composed principally of sandstone, mudstone, and greenstone. In the southern part of Okinawa Island, the sedimentary layers referred to as the Shimajiri Group (mainly Neogene) unconformably overlay the Nago Group (49). The Shimajiri Group is composed mainly of sandstone, mudstone, and tuff, and is unconformably covered with Quaternary limestone (the Ryukyu Group).
Anaerobic groundwater and natural gas samples derived from deep aquifers in the Nago Group were collected through four deep wells: YHN, LSH, XTU, and ARM (Fig. 1B). These wells were drilled down to 800–2,119 m and reached deep aquifers in the Nago Group (Table S1) (25, 49). As well strainers extend over the Nago and Shimajiri Groups at the YHN site, samples may also contain groundwater and natural gas derived from the Shimajiri Group.
Groundwater at these wells is anaerobically drawn up to ground level by a water pump or by natural water pressure. In the present study, groundwater was pumped for more than 24 h before sampling in order to prevent contamination by air and water from shallow environments. Groundwater samples were collected under anaerobic conditions into autoclaved serum bottles and polycarbonate bottles using a sterile silicone tube. The concentrations of dissolved natural gas were so high that gas exsolved at the ground level. Natural gas samples were collected into autoclaved serum bottles underwater in order to prevent contamination by air. Serum bottles were tightly sealed with sterile butyl-rubber stoppers and aluminum crimps.
Physicochemical and stable isotope analyses of groundwater and natural gas
We measured the temperature, pH, oxidation-reduction potential (ORP), and electrical conductivity (EC) of groundwater samples at the outflow of the wells. The concentrations of cations (Na+, Ca2+, Mg2+, K+, and NH4+) and anions (CI−, Br−, I−, F−, PO43−, NO3−, SO42−, HCO3−, acetate, and formate) in groundwater were analyzed using an ICS-1500 ion chromatography system (Dionex, Sunnyvale, CA, USA). Sulfide was analyzed using a No. 211 sulphide ion detector tube (Gastec, Kanagawa, Japan). Dissolved organic carbon (DOC) was measured on a TOC-V total organic carbon analyzer (Shimadzu, Kyoto, Japan). The concentrations of natural gas components (H2, N2, O2, CO2, CH4, C2H6, C3H8, and C4H10) were analyzed on a GC-2014 gas chromatograph equipped with a thermal conductivity detector and flame ionization detector (Shimadzu) following the procedures described by Matsushita et al. (32). The detection limits of the analysis were 0.01 vol.% for H2, N2, O2, CO2, and CH4, and 0.001 vol.% for C2H6, C3H8, and C4H10.
The stable hydrogen and oxygen isotope ratios of groundwater samples (D/H and 18O/16O) were measured on a DLT-100 liquid water isotope analyzer (Los Gatos Research, San Jose, CA, USA) (13). The stable carbon isotope ratio (13C/12C) of dissolved inorganic carbon (DIC; consisting mainly of HCO3−) was analyzed as described previously (36). Groundwater samples for analyzing the 13C/12C of DIC were fixed with 0.5 mL of saturated HgCl2 solution and sealed with sterile butyl-rubber stoppers and aluminum crimps with no air bubbles. A 10-mL headspace was created inside each serum bottle with pure helium gas and acidified by adding CO2-free H3PO4 solution. Sample bottles were left in the dark for 24 h in order to achieve equilibrium between dissolved CO2 and headspace CO2. CO2 in this headspace was subsampled, and the 13C/12C ratio of CO2 was measured with a Trace GC Ultra gas chromatograph (Thermo Fisher Scientific) that was connected to a Deltaplus XL isotope ratio mass spectrometer (IRMS) (Thermo Fisher Scientific). The 13C/12C of CH4 in natural gas was measured with a Flash EA1112 elemental analyzer (Thermo Fisher Scientific) that was connected to a Delta V Advantage IRMS with a Conflo IV interface (Thermo Fisher Scientific). Stable isotope ratios were expressed in the conventional δ notation calculated from the equation:
|
δ
=
[
R
sample
/
R
standard
-
1
]
×
1000
[
‰
]
, |
where R is the isotope ratio (D/H, 18O/16O, or 13C/12C). All isotope ratios are reported relative to international standards: Vienna Standard Mean Ocean Water for δD and δ18O, and Vienna Pee Dee Belemnite for δ13C. The standard deviations of δD and δ18O in groundwater and δ13C of DIC and CH4 were ±0.5‰, ±0.1‰, ±1‰, and ±0.3‰, respectively.
Total cell count and catalyzed reporter deposition fluorescence in situ hybridization (CARD-FISH)
Groundwater samples for the total cell count and CARD-FISH analysis were filtered using polycarbonate membrane filters (pore size, 0.2 μm; diameter, 25 mm) (Millipore, Billerica, MA, USA). In the total cell count, microbial cells trapped on the filters were stained with SYBR Green I (Life Technologies, Carlsbad, CA, USA) (55). Stained cells were observed under a BX51 epifluorescence microscope equipped with a U-MNIB3 fluorescence filter (Olympus, Tokyo, Japan), and more than 20 microscopic fields were counted for each sample. Cell counting was performed within 48 h of groundwater sampling.
A CARD-FISH analysis targeting prokaryotic 16S rRNAs was conducted with minor modifications to the protocol described by Matsushita et al. (32). Briefly, microbial cells collected on the filter were fixed in 3% paraformaldehyde at 4°C for 1 h and dehydrated in 50, 80, and 99.5% ethanol solutions for 3 min each time. Cell fixation was conducted within 12 h of groundwater sampling. The filter was incubated in a lysozyme solution (5 mg mL−1 in 1 mM EDTA, 10 mM Tris-HCl, and 10 mM NaCl) at 37°C for 1 h for cell wall permeabilization. Hybridization was conducted using the following horseradish peroxidase-labeled probes: Archaea-specific ARCH915 (45), Bacteria-specific EUB338 (3), Methanobacteriales-specific MB1174 (39), Methanomicrobiales-specific MG1200 (39), Methanosarcinales-specific MSMX860 (39), and the control probe Non338 (51) with hybridization buffer described by Mitsunobu et al. (34) (35% formamide concentration). The Cy3-labeled tyramide signal was amplified using the TSA-Plus cyanine 3 system (Perkin Elmer, Waltham, MA, USA). All microbial cells were counterstained with SYBR Green I (Life Technologies). Stained cells were observed under a model BX51 epifluorescence microscope (Olympus) equipped with a U-MNIB3 filter (Olympus) for SYBR Green I-stained cells and a U-MWIG3 filter (Olympus) for FISH-positive cells, and more than 20 microscopic fields were counted for each sample.
Next generation sequencer (NGS) analysis of archaeal and bacterial 16S rRNA genes
In order to analyze archaeal and bacterial populations in groundwater samples, 10 L of each groundwater sample was aseptically filtered using Sterivex-GV filter units (pore size, 0.22 μm) (Millipore). Bulk DNA was extracted from microbial cells trapped on the filter using the MORA-Extract kit (Kyokuto Pharmaceutical, Tokyo, Japan). The V3–V4 region of archaeal and bacterial 16S rRNA genes was simultaneously amplified from bulk DNA by PCR using the primer set, Pro341F and Pro806R (48). Library generation and sequencing using an Illumina MiSeq sequencer were performed according to the method described by Takahashi et al. (48). The Ribosomal Database Project Classifier version 2.10 was used to analyze sequence reads (confidence threshold of 80%) (52). Sequence reads were grouped into operational taxonomic units (OTUs) sharing more than 97% sequence similarity, and then the coverage, Chao 1, and Shannon index were calculated using the Quantitative Insights Into Microbial Ecology version 1.5.0 pipeline (10).
Anaerobic culture of microbial communities in groundwater
Thirty milliliters of each groundwater sample was anaerobically injected into an autoclaved 70-mL serum bottle that was tightly sealed with a sterile butyl-rubber stopper and aluminum crimp. In order to assess the potential for CH4 production by methanogenic archaea, groundwater samples were amended with acetate (20 mM), methanol (20 mM), formate (20 mM), or H2/CO2 (80:20, v/v; 150 kPa). Except in the case of H2/CO2 amended bottles, the headspaces of the serum bottles were filled with pure N2 at 150 kPa. These cultures were anaerobically incubated without shaking at the temperatures of the groundwater samples measured at the outflow of the wells.
In order to measure the potential for H2 and CO2 production by H2-producing fermentative bacteria, groundwater samples were amended with 3 mL of YPG medium (10 g yeast extract, 10 g peptone, and 2 g glucose L−1 distilled water) and 2-bromoethanesulfonate (BES, 20 mM), a methanogenesis inhibitor (18). The headspaces of the serum bottles were filled with pure N2 at 150 kPa, and these cultures were anaerobically incubated without shaking at the temperatures of the groundwater samples measured at the outflow of the wells.
In order to assess the potential for CH4 production by a syntrophic consortium of H2-producing fermentative bacteria and H2-utilizing methanogenic archaea, groundwater samples were amended with 3 mL of YPG medium. As a killed control, groundwater samples were autoclaved and then amended with 3 mL of YPG medium. The headspaces of the serum bottles were filled with pure N2 at 150 kPa, and these cultures were anaerobically incubated without shaking at the temperatures of the groundwater samples measured at the outflow of the wells.
All cultures were performed in duplicate. H2, N2, CH4, and CO2 concentrations in the headspaces were measured on a GC-2014 gas chromatograph equipped with a thermal conductivity detector (Shimadzu) as described above.
Archaeal and bacterial 16S rRNA genes in the cultures in which CH4 production was observed were analyzed according to the clone library method. Briefly, cells in the cultures were collected by centrifugation and lysed by lysozyme and proteinase K. Bulk DNA was purified using both phenol/chloroform/isoamyl alcohol and chloroform/ isoamyl alcohol and concentrated with ethanol precipitation. Archaeal and bacterial 16S rRNA gene fragments were amplified by PCR from bulk DNA using the Archaea-specific primer set, 109aF and 915aR (17, 45), and Bacteria-specific primer set, 8bF and 1512uR (14). The sequences of the inserted PCR products selected from recombinant colonies were elucidated with an Applied Biosystems 3730xl DNA analyzer (Life Technologies). A 3% distance level between sequences was considered the cut-off for distinguishing distinct OTUs. The nearest relative of each OTU was identified using the BLAST program (2), and neighbor-joining phylogenetic trees were then constructed using the CLUSTAL X version 2.1 program (29).
Nucleotide sequence accession numbers
The 16S rRNA gene sequences obtained in the present study have been deposited under DDBJ/ENA/GenBank accession numbers LC179566 to LC179584 and DRA005250.
Results
Physicochemical parameters of groundwater and natural gas
The temperature and pH of groundwater samples measured at the outflow of the wells ranged between 40.7 and 53.7°C and between 7.1 and 7.8, respectively (Table 1). The ORP of groundwater ranged between −275 and −179 mV, suggesting anoxic conditions in deep aquifers. The EC, an indicator of salinity, ranged between 878 and 4,500 mS m−1. The highest concentrations of Na+, Ca2+, Mg2+, NH4+, Cl−, Br−, I−, SO42−, and DOC were detected in the groundwater sample from the YHN site (Table S2). The concentrations of DOC and HCO3− ranged between <0.3 and 17 mg L−1 and between 100 and 450 mg L−1, respectively. PO43−, NO3−, S2−, acetate, and formate were below the limits of detection.
Table 1
Physicochemical parameters of groundwater and components of natural gas.
| Site code |
Groundwater |
Natural gas |
|
|
| Temp. (°C) |
pH |
ORP (mV) |
EC (mS m−1) |
N2 (vol.%) |
CH4 (vol.%) |
C2H6 (vol.%) |
C3H8 (vol.%) |
C1/(C2 + C3) |
| YHN |
53.7 |
7.1 |
−275 |
4,500 |
0.24 |
99.7 |
0.044 |
0.003 |
2,117 |
| LSH |
40.7 |
7.4 |
−179 |
3,200 |
5.94 |
94.0 |
0.012 |
<0.001 |
7,902 |
| XTU |
49.8 |
7.5 |
−223 |
3,090 |
6.20 |
93.8 |
0.019 |
<0.001 |
5,031 |
| ARM |
41.5 |
7.8 |
−250 |
878 |
6.25 |
93.7 |
0.013 |
<0.001 |
7,037 |
Abbreviations: ORP, oxidation-reduction potential; EC, electrical conductivity; C1, CH4; C2, C2H6; C3, C3H8.
The natural gas samples collected from all sites consisted mainly of CH4 (Table 1). The other principal components of natural gas samples were N2 and C2H6. C3H8 was only detected in the natural gas samples collected from YHN. The hydrocarbon gas composition C1/(C2+C3) of the natural gas samples (C1, CH4; C2, C2H6; C3, C3H8) ranged between 2,117 and 7,902. The concentrations of H2, O2, CO2, and C4H10 were below the limits of detection.
Stable isotopic signatures of groundwater and natural gas
The δD and δ18O of groundwater samples ranged between −24.3‰ and −5.8‰ and between −3.3‰ and 0.6‰, respectively (Table S3). In order to estimate the origin of groundwater in deep aquifers, we plotted these δD and δ18O values in a δD versus δ18O diagram with those of normal seawater, ancient seawater (31), and local surface water (1) and the global meteoric water line (11) (Fig. 2). In this diagram, groundwater collected from YHN was plotted closer to ancient seawater. On the other hand, groundwater from ARM was plotted closer to local surface water. Groundwater from XTU and LSH had similar isotopic signatures and fell on the right region of the global meteoric water line, showing a large δ18O enrichment.

The δ13C of DIC in groundwater (δ13CDIC) ranged between −8.64‰ and 3.70‰ (Table S3). The δ13C of CH4 in natural gas (δ13CCH4) ranged between −57.2‰ and −36.6‰. The carbon isotope fractionation (αc) between δ13CDIC and δ13CCH4 was 1.042–1.052. In order to estimate the origin of CH4 in natural gas samples, we plotted stable isotopic values on the δ13CDIC versus δ13CCH4 diagram described by Smith and Pallasser (44). In this diagram, all samples fell within the boundary between a biogenic origin (αc=1.06–1.08) and thermogenic origin (αc=1.02–1.04), suggesting that all natural gas samples contained CH4 of a mixture of biogenic and thermogenic origins (Fig. 3A). We also used a δ13CCH4 versus hydrocarbon gas composition C1/(C2+C3) diagram according to Bernard et al. (7) in order to estimate the origin of CH4 in natural gas samples. In this diagram, the sample from YHN fell within the region of a biogenic origin (Fig. 3B). On the other hand, all other samples fell within the boundary between biogenic and thermogenic origins.

Microbial cell densities in anaerobic groundwater samples ranged between 3.4×10³ and 1.2×10⁵ cells mL−1 (Table 2). In order to detect archaeal and bacterial cells in groundwater samples, we conducted a CARD-FISH analysis targeting archaeal and bacterial 16S rRNAs. FISH-positive archaeal and bacterial cells were detected in groundwater samples from LSH, XTU, and ARM (Fig. S1 and S2), and ranged between 3.7% and 17.4% and between 4.8% and 33.1% of all microbial cells, respectively (Table 2). The ratio of FISH-positive bacterial cells to archaeal cells (Bacteria/Archaea) was 1.2–2.5. The detection of FISH-positive cells in groundwater obtained from YHN was not possible due to the high autofluorescence of mineral particles in the sample.
Table 2
Microbial cell density and relative abundance of FISH-positive cells in groundwater.
| Site code |
Microbial cell density (cells mL−1) |
FISH-positive cellsa |
|
| Archaea (%) |
Bacteria (%) |
Bacteria/Archaea |
Methanobacteriales (%) |
Methanomicrobiales (%) |
Methanosarcinales (%) |
| YHN |
3.4×10³ |
n.d. |
n.d. |
no data |
n.d. |
n.d. |
n.d. |
| LSH |
1.2×10⁵ |
3.7 |
4.8 |
1.3 |
n.d. |
n.d. |
n.d. |
| XTU |
1.2×10⁵ |
17.4 |
21.6 |
1.2 |
n.d. |
n.d. |
n.d. |
| ARM |
4.9×10⁴ |
13.4 |
33.1 |
2.5 |
5.9 |
n.d. |
n.d. |
Abbreviation: n.d., not detected.
a The relative abundance of FISH-positive cells was assessed by the count ratio of FISH-positive cells to SYBR Green I-stained cells.
In order to detect the cells of methanogenic archaea in groundwater samples, we also performed a CARD-FISH analysis targeting 16S rRNAs specific for the archaeal members of the orders Methanobacteriales, Methanomicrobiales, and Methanosarcinales. FISH-positive Methanobacteriales cells were detected in the groundwater obtained from ARM (Fig. S3), and constituted 5.9% of all microbial cells (Table 2). On the other hand, FISH-positive Methanobacteriales cells were not confirmed in groundwater from LSH and XTU despite several attempts. FISH-positive Methanomicrobiales and Methanosarcinales cells were not detected in any of the groundwater samples.
Microbial community structures in groundwater
In order to identify microbial community structures in groundwater samples, we performed a NGS analysis targeting archaeal and bacterial 16S rRNA genes. We obtained 14,005–51,920 reads and 196–504 OTUs (Table S4). Coverage reached >99.4%. The Chao1 and Shannon index were 231–742 and 2.97–5.62, respectively.
Archaeal 16S rRNA genes accounted for 1.5%–74.0% of the total reads obtained from each sample (Fig. S4). A phylogenetic analysis of the archaeal 16S rRNA genes revealed the predominance of H2-utilizing methanogens belonging to the order Methanobacteriales in groundwater samples from YHN, XTU, and ARM (Fig. 4A) (56). In LSH, the presence of Methanobacteriales was also confirmed. However, most of the archaeal 16S rRNA genes were unclassified archaea. H2-utilizing methanogens belonging to the order Methanomicrobiales were only identified in ARM (42).

An analysis of bacterial 16S rRNA genes demonstrated the presence of bacterial groups that belong to the phyla Firmicutes, Proteobacteria, Actinobacteria, Chloroflexi, and Bacteroidetes in groundwater samples from each site (Fig. 4B). Bacterial 16S rRNA genes closely related to Clostridiales, a bacterial order that belongs to the Firmicutes, were detected in all sites. The orders Thermoanaerobacterales and Lactobacillales, which are the other members of Firmicutes, were mainly identified in YHN and XTU, respectively. The bacterial 16S rRNA genes closely related to the bacterial groups of Gammaproteobacteria and Chloroflexi were detected in LSH. The bacterial groups of Betaproteobacteria and Actinobacteria were mainly identified in ARM. The presence of Bacteroidetes was shown in XTU and ARM.
Potential for biogas production by microbial communities
In order to assess the potential for CH4 production by methanogenic archaea in the deep aquifers, we anaerobically incubated groundwater samples amended with methanogenic substrates: acetate, methanol, formate, or H2/CO2. However, CH4 production was not observed in these cultures over 75 d of incubation (data not shown).
We then performed anaerobic cultivations using groundwater samples amended with YPG medium and BES to assess the potential for H2 and CO2 production mediated by H2-producing fermentative bacteria. As a result, H2 and CO2 were detected in the gas phase of cultures using groundwater samples from all sites (Fig. 5A). In the cultures using groundwater from LSH and XTU, the production of H2 and CO2 was observed within 3 d. In the cultures using groundwater from YHN and ARM, H2 and CO2 were detected after 7 and 14 d, respectively.

A high potential for CH4 production was confirmed in the cultures using groundwater samples amended with YPG medium (Fig. 5B). H2 and CO2 production was observed in all cultures within 7 d. After H2 and CO2 production, the concentration of H2 decreased to below the limit of detection. CH4 production was observed after H2 levels began to fall. These dynamics of H2 and CH4 were similar to those observed previously in syntrophic co-cultures of H2-producing fermentative bacteria and H2-utilizing methanogenic archaea (4, 27, 32). In the cultures using groundwater from YHN and LSH, CH4 production was observed within 10 d. In the cultures using groundwater from XTU and ARM, CH4 was detected after 14 d. In a killed control using autoclaved groundwater samples amended with YPG medium, H2 and CH4 production was not observed over 75 d (data not shown).
In order to identify prokaryotes that generated biogas (i.e., H2, CO2, and CH4) in the cultures using YPG-amended groundwater, we constructed archaeal and bacterial 16S rRNA gene clone libraries. The 16S rRNA gene analysis suggested that H2-utilizing methanogenic archaea and H2-producing fermentative bacteria were predominant in the microbial population (Table S5) and were related to the archaeal order Methanobacteriales (Fig. S5) and bacterial orders Bacillales, Synergistales, Clostridiales, and Thermotogales (Fig. S6) (12, 30, 40, 53).
Discussion
The anaerobic groundwater sample collected from the YHN site had a similar EC value and Na+ and Cl− concentrations as normal seawater (Tables 1 and S2). The groundwater sample also had high levels of I− and Br−. These chemical features are consistent with those of ancient seawater, which is comprised of groundwater that originated from seawater and was maintained for a long period in a low-temperature deep aquifer (24). Additionally, the δD and δ18O values of the groundwater sample were consistent with those of ancient seawater (Fig. 2). Therefore, the groundwater in the YHN deep aquifer appeared to have originated from seawater that was conserved in the deep aquifer over a long period at a relatively low temperature. In contrast, groundwater from the ARM site had the lowest EC value (Table 1) and showed similar δD and δ18O signatures to those of local surface water (Fig. 2). These characteristics suggest that the ARM deep aquifer has mainly been affected by rainwater infiltrating from surface environments. Groundwater from the LSH and XTU sites had similar chemical and isotopic signatures. The EC value of groundwater was approximately 60% of that of normal seawater (approximately 5,000 mS m−1), suggesting that groundwater originated from a mixture of seawater and rainwater (Table 1). The δ18O values of the groundwater samples were higher than that of normal seawater sample (Fig. 2). These high δ18O values suggest that groundwater in these deep aquifers was affected by water-rock interactions in high-temperature deep subterranean environments (9).
CH4 was the predominant component of natural gas samples collected from all sites (Table 1). In the present study, we estimated the origin of CH4 in natural gas samples using a δ13CDIC versus δ13CCH4 diagram and δ13CCH4 versus C1/(C2+C3) diagram (Fig. 3). These chemical and stable carbon isotopic signatures of groundwater and natural gas samples suggested that CH4 in the natural gas samples was of a biogenic origin or a mixture of biogenic and thermogenic origins.
The microbial cell densities in groundwater samples were consistent with those previously reported in deep aquifers associated with the Paleogene accretionary prism (27, 32). The CARD-FISH analysis targeting archaeal 16S rRNA detected metabolically active archaeal cells in groundwater samples from LSH, XTU, and ARM (Table 2). Additionally, we successfully detected FISH-positive Methanobacteriales cells, known as H2-utilizing methanogenic archaea, in the groundwater from ARM. The NGS analysis of archaeal 16S rRNA genes revealed the presence of Methanobacteriales in the groundwater from all sites (Fig. 4A). In contrast, methanogenic archaea that use acetate or methanol as methanogenic substrates were not confirmed. These results suggest that H2-utilizing methanogenesis is a main microbial CH4 production pathway in the deep aquifers tested. However, the potential for CH4 production by H2-utilizing methanogens was not confirmed in the cultures using groundwater samples amended with H2/CO2. This may have been due to the growth inhibition of H2-utilizing methanogens caused by a shortage of inorganic nutrients, such as phosphate, vitamin, and trace elements, or by a high concentration of H2 and CO2 (41).
Although archaeal 16S rRNA genes closely related to the order Methanobacteriales were obtained from all sites (Fig. 4A), FISH-positive Methanobacteriales cells were only detected from ARM (Table 2). This result may have been due to the low abundance of Methanobacteriales cells in groundwater samples or a mismatch between the probe used in the present study and their 16S rRNA sequences.
The NGS analysis targeting bacterial 16S rRNA genes revealed the presence of bacteria belonging to Firmicutes in all groundwater samples (Fig. 4B). These bacteria are generally known to have the ability to degrade organic matter to H2 and CO2 by fermentation (21, 28, 30). Additionally, the members of the bacterial groups belonging to Betaproteobacteria, Gammaproteobacteria, Actinobacteria, Chloroflexi, and Bacteroidetes, which were also identified in each site, have been shown to possess the ability to grow by fermentation under anaerobic environments (5, 6, 20, 37, 54). We confirmed a high potential for H2 and CO2 production by H2-producing fermentative bacteria in the cultures using groundwater samples amended with YPG medium and BES (Fig. 5A). Therefore, these bacteria are considered to grow by fermentation and degrade organic matter to H2 and CO2 in the deep aquifers.
The H2-utilizing methanogenic archaea and H2-producing fermentative bacteria identified in the present study have frequently been found in subsurface oil reservoirs, natural gas reservoirs, and coal deposits in which microbial CH4 production has been observed (32, 33). Additionally, it is generally known that a syntrophic consortium of H2-producing fermentative bacteria and H2-utilizing methanogenic archaea leads to the biodegradation of organic matter to CH4 in anaerobic environments (38, 41). In the present study, a high potential for CH4 production by a syntrophic consortium of H2-producing fermentative bacteria and H2-utilizing methanogenic archaea was demonstrated by the cultures using groundwater samples amended with YPG medium (Fig. 5B). The potential for microbial CH4 production was similar to that previously reported in deep aquifers of the Paleogene accretionary prism (27, 32). The predominance of H2-utilizing methanogenic archaea and H2-producing fermentative bacteria in the cultures was also confirmed by the 16S rRNA gene analysis (Table S6). Although the predominant fermentative bacteria in the cultures belonged to the orders Bacillales, Synergistales, Clostridiales, and Thermotogales, except for Clostridiales, these bacterial groups were rarely found in natural groundwater samples (Fig. 4B). This may have been due to the strong selective pressure caused by using very high concentrations of organic substrates.
Our geochemical and microbiological data strongly suggest the presence of a CH4 production process by a syntrophic consortium of H2-producing fermentative bacteria and H2-utilizing methanogenic archaea in deep aquifers of the Cretaceous accretionary prism in Okinawa Island, Japan. The microbial activity and CH4 production process revealed in this study were similar to those previously reported in deep aquifers of the Paleogene accretionary prism (27, 32). Since accretionary prisms are derived from ancient marine sediments scraped from the subducting ocean plate, the sediments contain layers of mudstone rich in complex organic matter (8, 22). This organic matter is considered to support the activity of a microbial community that generates CH4 in deep aquifers. Taken together, our results suggest that the ongoing biodegradation of organic matter makes a major contribution to CH4 production in deep aquifers of the Cretaceous accretionary prism as well as those of the Paleogene accretionary prism.
Acknowledgements
We thank Kenji Miyazato, Kiyotake Kanna, Tomimasa Isa, Tatsuya Gima, Masashi Tagawa, and Yoshiaki Miyagi for their help with sampling. This work was partially supported by the Japan Society for the Promotion of Science (JSPS) KAKENHI Grant (No. 16H02968) and Japan Science and Technology Agency (JST) MIRAI Project Grant (No. JPMJMI17EK). This research was also supported by the Collaborative Research of Tropical Biosphere Research Center, University of the Ryukyus, Japan.
References
- 1. Agata, S., H. Satake, and A. Tokuyama. 2001. Chemical characteristics and isotopic compositions of spring and river waters in Okinawa Island. Chikyu Kagaku (Nippon Chikyu Kagakkai). 35:27-41.(in Japanese with an English abstract).
- 2. Altschul, S.F., T.L. Madden, A.A. Schäffer, J. Zhang, Z. Zhang, W. Miller, and D.J. Lipman. 1997. Gapped BLAST and PSI-BLAST: a new generation of protein database search programs. Nucleic Acids Res. 25:3389-3402.
- 3. Amann, R.I., L. Krumholz, and D.A. Stahl. 1990. Fluorescent-oligonucleotide probing of whole cells for determinative, phylogenetic, and environmental studies in microbiology. J Bacteriol. 172:762-770.
- 4. Baito, K., S. Imai, M. Matsushita, M. Otani, Y. Sato, and H. Kimura. 2015. Biogas production using anaerobic groundwater containing a subterranean microbial community associated with the accretionary prism. Microb Biotechnol. 8:837-845.
- 5. Bale, S.J., K. Goodman, P.A. Rochelle, J.R. Marchesi, J.C. Fry, A.J. Weightman, and R.J. Parkes. 1997. Desulfovibrio profundus sp. nov., a novel barophilic sulfate-reducing bacterium from deep sediment layers in the Japan Sea. Int J Syst Bacteriol. 47:515-521.
- 6. Benno, Y., J. Watabe, and T. Mitsuoka. 1983. Bacteroides pyogenes sp. nov., Bacteroides suis sp. nov., and Bacteroides helcogenes sp. nov., new species from abscesses and feces of pigs. Syst Appl Microbiol. 4:396-407.
- 7. Bernard, B.B., J.M. Brooks, and W.M. Sackett. 1978. Light hydrocarbons in recent Texas continental shelf and slope sediments. J Geophys Res. 83:4053-4061.
- 8. Berner, U., and J. Koch. 1993. Organic matter in sediments of site 808, Nankai accretionary prism, Japan. Proc Ocean Drill Program: Sci Results. 131:379-385.
- 9. Bowers, T.S., and H.P. Taylor. 1985. An integrated chemical and stable-isotope model of the origin of midocean ridge hot spring systems. J Geophys Res. 90:12583-12606.
- 10. Caporaso, J.G., J. Kuczynski, J. Stombaugh, et al. 2010. QIIME allows analysis of high-throughput community sequencing data. Nat Methods. 7:335-336.
- 11. Craig, H. 1961. Isotopic variations in meteoric waters. Science. 133:1702-1703.
- 12. Dahle, H., and N.K. Birkeland. 2006. Thermovirga lienii gen. nov., sp. nov., a novel moderately thermophilic, anaerobic, amino-acid-degrading bacterium isolated from a North Sea oil well. Int J Syst Evol Microbiol. 56:1539-1545.
- 13. Dawson, K.S., M.R. Osburn, A.L. Sessions, and V.J. Orphan. 2015. Metabolic associations with archaea drive shifts in hydrogen isotope fractionation in sulfate-reducing bacterial lipids in cocultures and methane seeps. Geobiology. 13:462-477.
- 14. Eder, W., W. Ludwig, and R. Huber. 1999. Novel 16S rRNA gene sequences retrieved from highly saline brine sediments of Kebrit Deep, Red Sea. Arch Microbiol. 172:213-218.
- 15. Fagereng, Å. 2011. Fractal vein distributions within a fault-fracture mesh in an exhumed accretionary mélange, Chrystalls Beach Complex, New Zealand. J Struct Geol. 33:918-927.
- 16. Geological Survey of Japan, AIST. 2014. Seamless digital geological map of Japan 1: 200,000. Jan 14, 2014 version. Geological Survey of Japan. National Institute of Advanced Industrial Science and Technology, Ibaraki, Japan.
- 17. Großkopf, R., P.H. Janssen, and W. Liesack. 1998. Diversity and structure of the methanogenic community in anoxic rice paddy soil microcosms as examined by cultivation and direct 16S rRNA gene sequence retrieval. Appl Environ Microbiol. 64:960-969.
- 18. Gunsalus, R.P., J.A. Romesser, and R.S. Wolfe. 1978. Preparation of coenzyme M analogs and their activity in the methyl coenzyme M reductase system of Methanobacterium thermoautotrophicum. Biochemistry. 17:2374-2377.
- 19. Hervé, F., M. Calderón, C.M. Fanning, R.J. Pankhurst, and E. Godoy. 2013. Provenance variations in the Late Paleozoic accretionary complex of central Chile as indicated by detrital zircons. Gondwana Res. 23:1122-1135.
- 20. Hiraishi, A., Y. Hoshino, and T. Satoh. 1991. Rhodoferax fermentans gen. nov., sp. nov., a phototrophic purple nonsulfur bacterium previously referred to as the “Rhodocyclus gelatinosus-like” group. Arch Microbiol. 155:330-336.
- 21. Kandler, O., U. Schillinger, and N. Weiss. 1983. Lactobacillus bifermentans sp. nov., nom. rev., an organism forming CO2 and H2 from lactic acid. Syst Appl Microbiol. 4:408-412.
- 22. Kaneko, M., H. Shingai, J.W. Pohlman, and H. Naraoka. 2010. Chemical and isotopic signature of bulk organic matter and hydrocarbon biomarkers within mid-slope accretionary sediments of the northern Cascadia margin gas hydrate system. Mar Geol. 275:166-177.
- 23. Kano, K., M. Nakaji, and S. Takeuchi. 1991. Asymmetrical melange fabrics as possible indicators of the convergent direction of plates: a case study from the Shimanto Belt of the Akaishi Mountains, central Japan. Tectonophysics. 185:375-388.
- 24. Katayama, T., H. Yoshioka, Y. Muramoto, J. Usami, K. Fujiwara, S. Yoshida, Y. Kamagata, and S. Sakata. 2015. Physicochemical impacts associated with natural gas development on methanogenesis in deep sand aquifers. ISME J. 9:436-446.
- 25. Kato, S., T. Honda, and K. Omijya. 2012. Petroleum geology of the Nanjo R1 exploratory well, Okinawa Prefecture. J Jpn Assoc Pet Technol. 77:86-95.(in Japanese with an English abstract).
- 26. Kemkin, I.V., and A.N. Filippov. 2001. Structure and genesis of the lower structural unit of the Samarka Jurassic accretionary prism (Sikhote-Alin, Russia). Geodiversitas. 23:323-339.
- 27. Kimura, H., H. Nashimoto, M. Shimizu, S. Hattori, K. Yamada, K. Koba, N. Yoshida, and K. Kato. 2010. Microbial methane production in deep aquifer associated with the accretionary prism in Southwest Japan. ISME J. 4:531-541.
- 28. Kublanov, I.V., M.I. Prokofeva, N.A. Kostrikina, T.V. Kolganova, T.P. Tourova, J. Wiegel, and E.A. Bonch-Osmolovskaya. 2007. Thermoanaerobacterium aciditolerans sp. nov., a moderate thermoacidophile from a Kamchatka hot spring. Int J Syst Evol Microbiol. 57:260-264.
- 29. Larkin, M.A., G. Blackshields, N.P. Brown, et al. 2007. Clustal W and Clustal X version 2.0. Bioinformatics. 23:2947-2948.
- 30. Liu, C., S.M. Finegold, Y. Song, and P.A. Lawson. 2008. Reclassification of Clostridium coccoides, Ruminococcus hansenii, Ruminococcus hydrogenotrophicus, Ruminococcus luti, Ruminococcus productus and Ruminococcus schinkii as Blautia coccoides gen. nov., comb. nov., Blautia hansenii comb. nov., Blautia hydrogenotrophica comb. nov., Blautia luti comb. nov., Blautia producta comb. nov., Blautia schinkii comb. nov. and description of Blautia wexlerae sp. nov., isolated from human faeces. Int J Syst Evol Microbiol. 58:1896-1902.
- 31. Maekawa, T., S. Igari, and N. Kaneko. 2006. Chemical and isotopic compositions of brines from dissolved-in-water type natural gas fields in Chiba, Japan. Geochem J. 40:475-484.
- 32. Matsushita, M., S. Ishikawa, K. Nagai, Y. Hirata, K. Ozawa, S. Mitsunobu, and H. Kimura. 2016. Regional variation of CH4 and N2 production processes in the deep aquifers of an accretionary prism. Microbes Environ. 31:329-338.
- 33. Meslé, M., G. Dromart, and P. Oger. 2013. Microbial methanogenesis in subsurface oil and coal. Res Microbiol. 164:959-972.
- 34. Mitsunobu, S., F. Shiraishi, H. Makita, B.N. Orcutt, S. Kikuchi, B.B. Jorgensen, and Y. Takahashi. 2012. Bacteriogenic Fe(III) (Oxyhydr) oxides characterized by synchrotron microprobe coupled with spatially resolved phylogenetic analysis. Environ Sci Technol. 46:3304-3311.
- 35. Miyagi, N., S. Baba, and R. Shinjo. 2013. Whole-rock chemical composition of the pre-Neogene basement rocks and detritus garnet composition in the Okinawa-jima and neighbor islands. J Geol Soc Jpn. 119:665-678.(in Japanese with an English abstract).
- 36. Miyajima, T., Y. Yamada, Y.T. Hanba, K. Yoshii, T. Koitabashi, and E. Wada. 1995. Determining the stable isotope ratio of total dissolved inorganic carbon in lake water by GC/C/IRMS. Limnol Oceanogr. 40:994-1000.
- 37. Nagai, F., Y. Watanabe, and M. Morotomi. 2010. Slackia piriformis sp. nov. and Collinsella tanakaei sp. nov., new members of the family Coriobacteriaceae, isolated from human faeces. Int J Syst Evol Microbiol. 60:2639-2646.
- 38. Noguchi, M., F. Kurisu, I. Kasuga, and H. Furumai. 2014. Time-resolved DNA stable isotope probing links Desulfobacterales- and Coriobacteriaceae-related bacteria to anaerobic degradation of benzene under methanogenic conditions. Microbes Environ. 29:191-199.
- 39. Raskin, L., J.M. Stromley, B.E. Rittmann, and D.A. Stahl. 1994. Group-specific 16S ribosomal-rna hybridization probes to describe natural communities of methanogens. Appl Environ Microbiol. 60:1232-1240.
- 40. Ravot, G., M. Magot, M.L. Fardeau, B.K. Patel, G. Prensier, A. Egan, J.L. Garcia, and B. Ollivier. 1995. Thermotoga elfii sp. nov., a novel thermophilic bacterium from an African oil-producing well. Int J Syst Evol Microbiol. 45:308-314.
- 41. Sakai, S., H. Imachi, Y. Sekiguchi, I.C. Tseng, A. Ohashi, H. Harada, and Y. Kamagata. 2009. Cultivation of methanogens under low-hydrogen conditions by using the coculture method. Appl Environ Microbiol. 75:4892-4896.
- 42. Sakai, S., M. Ehara, I.C. Tseng, T. Yamaguchi, S.L. Brauer, H. Cadillo-Quiroz, S.H. Zinder, and H. Imachi. 2012. Methanolinea mesophila sp. nov., a hydrogenotrophic methanogen isolated from rice field soil, and proposal of the archaeal family Methanoregulaceae fam. nov. within the order Methanomicrobiales. Int J Syst Evol Microbiol. 62:1389-1395.
- 43. Sakata, S., T. Maekawa, S. Igari, and Y. Sano. 2012. Geochemistry and origin of natural gases dissolved in brines from gas fields in southwest Japan. Geofluids. 12:327-335.
- 44. Smith, J.W., and R.J. Pallasser. 1996. Microbial origin of Australian coalbed methane. AAPG Bull. 80:891-897.
- 45. Stahl, D.A., and R. Amann. 1991. Development and application of nucleic acid probes in bacterial systematics, p.205-248. In E. Stackebrandt, and M. Goodfellow (ed.), Nucleic Acid Techniques in Bacterial Systematics. John Wiley & Sons, New York.
- 46. Taira, A., J. Katto, M. Tashiro, M. Okamura, and K. Kodama. 1988. The Shimanto Belt in Shikoku, Japan: evolution of Cretaceous to Miocene accretionary prism. Mod Geol. 12:5-46.
- 47. Taira, A., T. Byrne, and J. Ashi. 1992. Photographic Atlas of an Accretionary Prism: Geologic Structures of the Shimanto Belt, Japan. University of Tokyo Press, Tokyo.
- 48. Takahashi, S., J. Tomita, K. Nishioka, T. Hisada, and M. Nishijima. 2014. Development of a prokaryotic universal primer for simultaneous analysis of bacteria and archaea using next-generation sequencing. PLoS One. 9:e105592.
- 49. Ujiie, H. 1994. Early Pleistocene birth of the Okinawa Trough and Ryukyu Island Arc at the northwestern margin of the Pacific: evidence from Late Cenozoic planktonic foraminiferal zonation. Palaeogeogr Palaeoclimatol Palaeoecol. 108:457-474.
- 50. Ujiie, K. 2002. Evolution and kinematics of an ancient décollement zone, mélange in the Shimanto accretionary complex of Okinawa Island, Ryukyu Arc. J Struct Geol. 24:937-952.
- 51. Wallner, G., R. Amann, and W. Beisker. 1993. Optimizing fluorescent in situ hybridization with rRNA-targeted oligonucleotide probes for flow cytometric identification of microorganisms. Cytometry. 14:136-143.
- 52. Wang, Q., G.M. Garrity, J.M. Tiedje, and J.R. Cole. 2007. Naïve Bayesian classifier for rapid assignment of rRNA sequences into the new bacterial taxonomy. Appl Environ Microbiol. 73:5261-5267.
- 53. Watanapokasin, R.Y., A. Boonyakamol, S. Sukseree, A. Krajarng, T. Sophonnithiprasert, S. Kanso, and T. Imai. 2009. Hydrogen production and anaerobic decolorization of wastewater containing Reactive Blue 4 by a bacterial consortium of Salmonella subterranea and Paenibacillus polymyxa. Biodegradation. 20:411-418.
- 54. Yamada, T., Y. Sekiguchi, S. Hanada, H. Imachi, A. Ohashi, H. Harada, and Y. Kamagata. 2006. Anaerolinea thermolimosa sp. nov., Levilinea saccharolytica gen. nov., sp. nov. and Leptolinea tardivitalis gen. nov., sp. nov., novel filamentous anaerobes, and description of the new classes Anaerolineae classis nov. and Caldilineae classis nov. in the phylum Chloroflexi. Int J Syst Evol Microbiol. 56:1331-1340.
- 55. Yanagawa, K., A. Tani, N. Yamamoto, A. Hachikubo, A. Kano, R. Matsumoto, and Y. Suzuki. 2016. Biogeochemical cycle of methanol in anoxic deep-sea sediments. Microbes Environ. 31:190-193.
- 56. Zhu, J., X. Liu, and X. Dong. 2011. Methanobacterium movens sp. nov. and Methanobacterium flexile sp. nov., isolated from lake sediment. Int J Syst Evol Microbiol. 61:2974-2978.
