Abstract
Since the discovery of the giant mimivirus, evolutionarily related viruses have been isolated or identified from various environments. Phylogenetic analyses of this group of viruses, tentatively referred to as the family “Megaviridae”, suggest that it has an ancient origin that may predate the emergence of major eukaryotic lineages. Environmental genomics has since revealed that Megaviridae represents one of the most abundant and diverse groups of viruses in the ocean. In the present study, we compared the taxon richness and phylogenetic diversity of Megaviridae, Bacteria, and Archaea using DNA-dependent RNA polymerase as a common marker gene. By leveraging existing microbial metagenomic data, we found higher richness and phylogenetic diversity in this single viral family than in the two prokaryotic domains. We also obtained results showing that the evolutionary rate alone cannot account for the observed high diversity of Megaviridae lineages. These results suggest that the Megaviridae family has a deep co-evolutionary history with diverse marine protists since the early “Big-Bang” radiation of the eukaryotic tree of life.
Acanthamoeba polyphaga mimivirus (APMV), initially mistaken as a Gram-positive bacterium when it was isolated via amoeba co-culture in the 1990s (4), was recognized in 2003 as a bone fide virus, indeed a ‘giant virus’ with a large 750-nm virion including a fibril-containing rigid surface layer (40). APMV possesses a 1.2-Mb linear dsDNA genome coding for more than 1,000 genes (43, 65), which is more than those encoded on the genomes of some small prokaryotes. It is classified as a member of nucleocytoplasmic large DNA viruses (NCLDVs), the proposed order “Megavirales” (17), together with various giant viruses discovered after APMV (6, 45, 46, 63, 78). The unexpected dimensions and complexity of APMV and other exotic giant viruses triggered the reassessment of differences between cellular and viral life forms (66), fueled debates on the origin of viruses (14, 54, 56), and revived interest in re-defining the concept of viruses (13, 15, 27).
Phylogenetic studies have indicated multiple origins of APMV genes; some APMV genes appear to be of viral origin, whereas others appear to originate from cellular organisms (23, 24, 55, 71) or unknown sources (i.e., ORFans). Despite the apparent mosaicity of its complex genome, one coherent finding that emerges from these studies is that the origin of APMV lineage is old, being as ancient as the emergence of the Eukarya domain in the Tree of Life (65). In particular, the ancient origin of APMV and related giant viruses has been supported by phylogenies of replication- and transcription-related genes (1, 72, 77, 89). The antiquity of giant viruses further inspired hypotheses of a putative “Fourth Domain of Life”, although these are still highly controversial (7, 16, 44, 57, 59, 83, 90).
Since the discovery of APMV, numerous APMV relatives have been isolated using amoeba co-culture from different environments including marine sediment, river, soil, contact lens liquid, and sewage water (2, 31, 41, 88). These viruses are subdivided into lineage A, B and C mimiviruses (88). These amoebal mimiviruses, together with additional giant viruses infecting microzooplankton, such as Cafeteria roenbergensis virus (CroV) (25) and Bodo saltans virus (19) as well as Klosneuviruses recently identified in metagenomes (71), constitute the family Mimiviridae officially approved by the International Committee on Taxonomy of Viruses (ICTV). Shortly after the discovery of APMV, algal viruses isolated in the sea, such as Chrysochromulina ericina virus (CeV) and Pyramimonas orientalis virus, were found to form a strongly supported monophyletic group with APMV based on DNA polymerase phylogenies (28, 51, 52). Since then, the monophyletic group has grown with the inclusion of Phaeocystis globosa virus (PgV) (69), Aureococcus anophagefferens virus (AaV) (53), Haptolina ericina virus (HeV RF02), and Prymnesium kappa viruses (PkV RF01 and PkV RF02) (34) as well as metagenome-assembled Organic lake phycodnaviruses (OLPV1 and OLPV2) (86) and Yellowstone lake mimivirus (YSLGV) (91). Some of these viruses are officially, but inappropriately, classified in the Phycodnaviridae family. Arslan et al. proposed to reassign the family “Megaviridae” to the monophyletic group that combines the above mentioned mimiviruses, zooplankton giant viruses, and algal giant viruses (2). Gallot-Lavallée et al. recently proposed to classify mimiviruses and microzooplankton giant viruses of the Megaviridae family into the subfamily “Megamimivirinae” and the algal viruses into the subfamily “Mesomimivirinae” (29). The tentative Megaviridae family is the focus of the present study and it is this proposed Megaviridae nomenclature that we use henceforth.
Megaviridae constitutes approximately 36% of giant viruses in epipelagic oceans, with their abundance being in the order of 103 to 105 genomes mL−1 sea water (32). A recent metatranscriptomic study also demonstrated that members of Megaviridae are active everywhere in sunlit oceans and infect eukaryotic communities of various size ranges from piconano-plankton (0.8–5 μm) up to mesoplankton (180–2,000 μm) (9). The hosts of isolated Megaviridae are still limited to a handful of eukaryotic lineages, but already encompass an extremely wide range of unicellular eukaryotes, including Amoebozoa, Stramenopiles (Cafeteriaceae and Pelagophyceae), Euglenozoa (Kinetoplastida), Haptophyceae (Phaeocystales and Prymnesiales), and Viridiplantae (Chlorophyta). Sequence similarity searches between metagenomic sequences and known Megaviridae genomes also indicated the existence of many uncultured Megaviridae lineages in marine environments (32). Taken together with the inferred antiquity of Megaviridae, these findings suggest that the host range of Megaviridae is markedly wider than currently recognized, and species richness inside the family Megaviridae may consequently be comparable with that of protists, which undoubtedly represent the major part of eukaryotic species’ diversity.
DNA-dependent RNA polymerases (RNAPs) of cellular organisms are multisubunit protein complexes, the structures of which have been elucidated for all three domains of life (Bacteria, Archaea, and Eukarya) (82). The number of subunits constituting the machinery differs across the domains of life (50, 82). Among them, the two largest subunits (hereafter referred to as Rpb1 and Rpb2) are both highly conserved and mostly encoded as single copy genes in the three domains of life, although eukaryotes commonly possess distant paralogs (33). Rpb1 and Rpb2 of eukaryotes correspond to the RNA polymerase β’ and β subunits of bacteria, and to the RpoA and RpoB of archaea, respectively (39, 80, 81). Archaeal RpoA is composed of two subunits encoded by two small genes. Rpb1 and Rpb2 have been selected as two of the 102 genes suitable for the assessment of phylogenetic relationships among prokaryotes (i.e., 102 Nearly Universal Trees) (38). Moreover, Rpb1 and Rpb2 are conserved in all known members of Megaviridae (50). Transcriptomic and proteomic studies have indicated that Rpb1 and Rpb2 are expressed during infection and packed into mimivirus capsids (12, 42, 43, 67). Bacteriophages, such as T7 and SP6, encode single-subunit RNAPs, which are phylogenetically unrelated to multisubunit RNAPs (10, 74). Therefore, Rpb1 and Rpb2 possess the required characteristics to be used as phylogenetic markers for both Megaviridae and cellular organisms (65, 72). In the present study, we investigate the taxon richness (or lineage richness) and phylogenetic diversity (PD) of Bacteria, Archaea, and Megaviridae based on Rpb1 and Rpb2 sequences found in marine microbial metagenomes derived from prokaryotic size fractions.
Materials and Methods
Sequence data
We used the UniProt database (Release 2016_03) (79) and the National Center for Biotechnology Information (NCBI) Reference Sequence (RefSeq) (61) Viral Section (Release 75) database to collect Rpb1 and Rpb2 protein sequences from cellular organisms and NCLDVs. We additionally used the GenomeNet/Virus-Host Database (49) to retrieve the nucleotide sequences of Rpb1 and Rpb2.
Marine metagenomic sequence data were obtained from CAMERA (75) and the Tara Oceans project (32, 76) (Table S1). In addition, we obtained metagenomic data for other non-marine environments from CAMERA and KEGG/MGENES (35). Collectively, we used metagenomic data derived from 58 projects (Table S1). Based on metagenomic data, we initially prepared files for amino acid sequences for open reading frames (ORFs) that were longer than or equal to 150 codons. The total number of ORFs was 149,645,996: marine metagenomes (101,856,227 ORFs, 68%), other aquatic environmental metagenomes (8,385,210 ORFs, 5.6%), mammal-associated microbial metagenomes (38,341,510 ORFs, 26%), and other metagenomes (1,063,049 ORFs, 0.7%). Most of the analyses presented in the present study focused on data from marine metagenomes, mainly derived from two large scale oceanic microbiome projects: Tara Oceans and the Global Ocean Sampling project (68). Data from other environments were used to confirm marine data.
Non-synonymous and synonymous substitution rate ratio
In order to estimate the level of functional constraint on Rpb1/Rpb2 coding sequences, we computed the numbers of non-synonymous (Ka) and synonymous (Ks) substitutions per site and their ratio (ω=Ka/Ks) using a maximum likelihood method implemented in the codeml program in the PAML package (85). We used the Mann-Whitney U test to assess the significance of differences in ω values between Megaviridae and bacterial sequences.
Reference sequence alignments and phylogenetic trees
We identified Rpb1 and Rpb2 homologs in the UniProt and RefSeq databases using HMMER/HMMSEARCH (version 3.1; E-value<1×10⁻⁵) (20) based on profile hidden Markov models that we built from alignments of Rpb1 (COG0086) and Rpb2 homologs (COG0085) (30). We used CD-HIT version 4.6 to reduce the redundancy of the collected known Rpb1/2 sequences (47). The resulting non-redundant sequences were aligned using MAFFT v7.215 (36) with default parameters and alignment columns containing gaps were trimmed using trimAl v1.2rev59 (8). We referred to the resulting reference sequence alignments for Rpb1 and Rpb2 as RAln-Rpb1 and RAln-Rpb2, respectively. We also generated reference sequence alignments solely composed of sequences from Megaviridae, Bacteria, and Archaea, and referred to the alignments as RAln-MBA-Rpb1 and RAln-MBA-Rpb2. Maximum likelihood phylogenetic trees were constructed with the use of FastTree version 2.1.7 (64). The resulting reference trees for Rpb1 and Rpb2 were referred to as RTree-Rpb1 and RTree-Rpb2, respectively. The significance of the branches in the trees was assessed using the Shimodaira-Hasegawa test (73) implemented in FastTree. Reference alignments and trees are available at the GenomeNet ftp site (ftp://ftp.genome.jp/pub/db/community/RNAP_ref_tree).
Identification of RNAP homologs in metagenomes
In order to identify Rpb1 and Rpb2 homologs in metagenomic sequence data, we used HMMER/HMMSEARCH (version 3.1) (20) with the default parameters and built 10 HMMs for Rpb1 and 10 HMMs for Rpb2, each of which represents a group of phylogenetically related sequences in our reference phylogenetic trees. Specifically, these HMMs represent Megaviridae, other NCLDV groups 1 and 2 (group 1: Asfarviridae, Poxviridae; 2: Ascoviridae, Iridoviridae, Pandoravirus, Pithovirus), Bacteria, Archaea, Eukaryotes I to IV (I: RNAP I; II: RNAP II; III: RNAP III; IV: RNAP IV/V), and RNA polymerases of plastids. We screened metagenomic data for the Rpb1 and Rpb2 homologs (≥150 amino acid residues) using these profile HMMs with HMMSEARCH (E-value<1×10⁻⁵).
Taxonomic classification
Phylogenetic placement is a bioinformatics technique that is used to identify the most likely phylogenetic position for a given query sequence on a reference phylogenetic tree. Pplacer is one of the phylogenetic placement tools that efficiently analyze large numbers of sequences, including short metagenomic sequences, within linear computation time (48). Metagenomic Rpb1/Rpb2 sequence fragments were aligned on the reference alignments (i.e., RAln-Rpb1 and RAln-Rpb2) using HMMALIGN and placed on the reference phylogenetic trees (RTree-Rpb1 and RTree-Rpb2) using Pplacer with the use of the maximum likelihood mode. These Rpb1 and Rpb2 fragments were taxonomically classified into the above-mentioned 10 phylogenetic groups based on their phylogenetic placement.
Taxon richness and PD
Metagenomic Rpb1/Rpb2 fragments that were taxonomically assigned to Megaviridae, Bacteria, or Archaea were re-aligned on the RAln-MBA-Rpb1 or RAln-MBA-Rpb2 reference sequence alignments using HMMALIGN. Since metagenomic sequences were often shorter than full-length sequences in the reference alignments, we examined taxon richness (i.e., the number of sequence clusters) (3) and PD (22) along the alignment using a 100-residue sliding window on the alignments (with a step size of 10 residues). Metagenomic sequences exhibiting gaps at >10% of the sites in the alignment window were discarded.
Taxon richness was computed based on sequence clustering by the ucluster_fast command of USEARCH v7.0 (21) with three cutoff values for amino acid sequence identities (i.e., 70%, 80%, and 90%). The significance of differences between richness curves was assessed using a Log-rank test (70).
PD was calculated using Phylogenetic Diversity Analyzer (PDA) version 1.0 (11), based on FastTree phylogenetic trees of metagenomic sequences that were aligned inside the sliding window. In order for PD scores to be comparable between Megaviridae, Bacteria, and Archaea, we constructed a phylogenetic tree with 1,000 randomly selected sequences for each organism group and calculated the PD score.
RNAP paralogs in Megaviridae
Some of the sequenced viruses of Megaviridae, such as PgV (69), OLPV1, and OLPV2, encode two distantly related Rpb2 in their genomes. In order to eliminate the effect of the presence of these paralogs on the richness assessment of Megaviridae Rpb2, we classified Megaviridae Rpb2 metagenomic sequences into two paralogous groups based on phylogenetic reconstructions and performed additional rarefaction analyses for each of the paralogous groups.
Results
Functional constraints on Megaviridae Rpb2 and Rpb1 are higher than those on bacterial homologs
The functional constraint on a protein sequence may be estimated by the ratio (ω) of non-synonymous (Ka) and synonymous (Ks) substitution rates. A small ω value indicates an elevated level of functional constraint (i.e., slow pace of amino acid sequence evolution), while a large ω value, which is typically smaller than 1 for a functional protein coding sequence, indicates a low level of functional constraint (i.e., fast amino acid sequence evolution). We computed ω values for Megaviridae Rpb2/Rpb1 by comparing close homologs. We also computed ω values for bacterial Rpb2/Rpb1 by comparing genes of Escherichia coli K-12 MG1655 with those of other closely related bacteria (Fig. 1). The average ω value for Megaviridae Rpb2 was 0.0205, while it was 0.0582 for bacterial Rpb2. The average ω value for Megaviridae Rpb1 was 0.0105, while it was 0.0811 for bacterial Rpb1. These results suggest that functional constraints on Megaviridae Rpb2/Rpb1 were higher than those on bacterial homologs (P=0.00003 for Rpb2, P=0.003 for Rpb1); however, the sample sizes for Megaviridae were small (n=7 for Rpb2, n=3 for Rpb1).

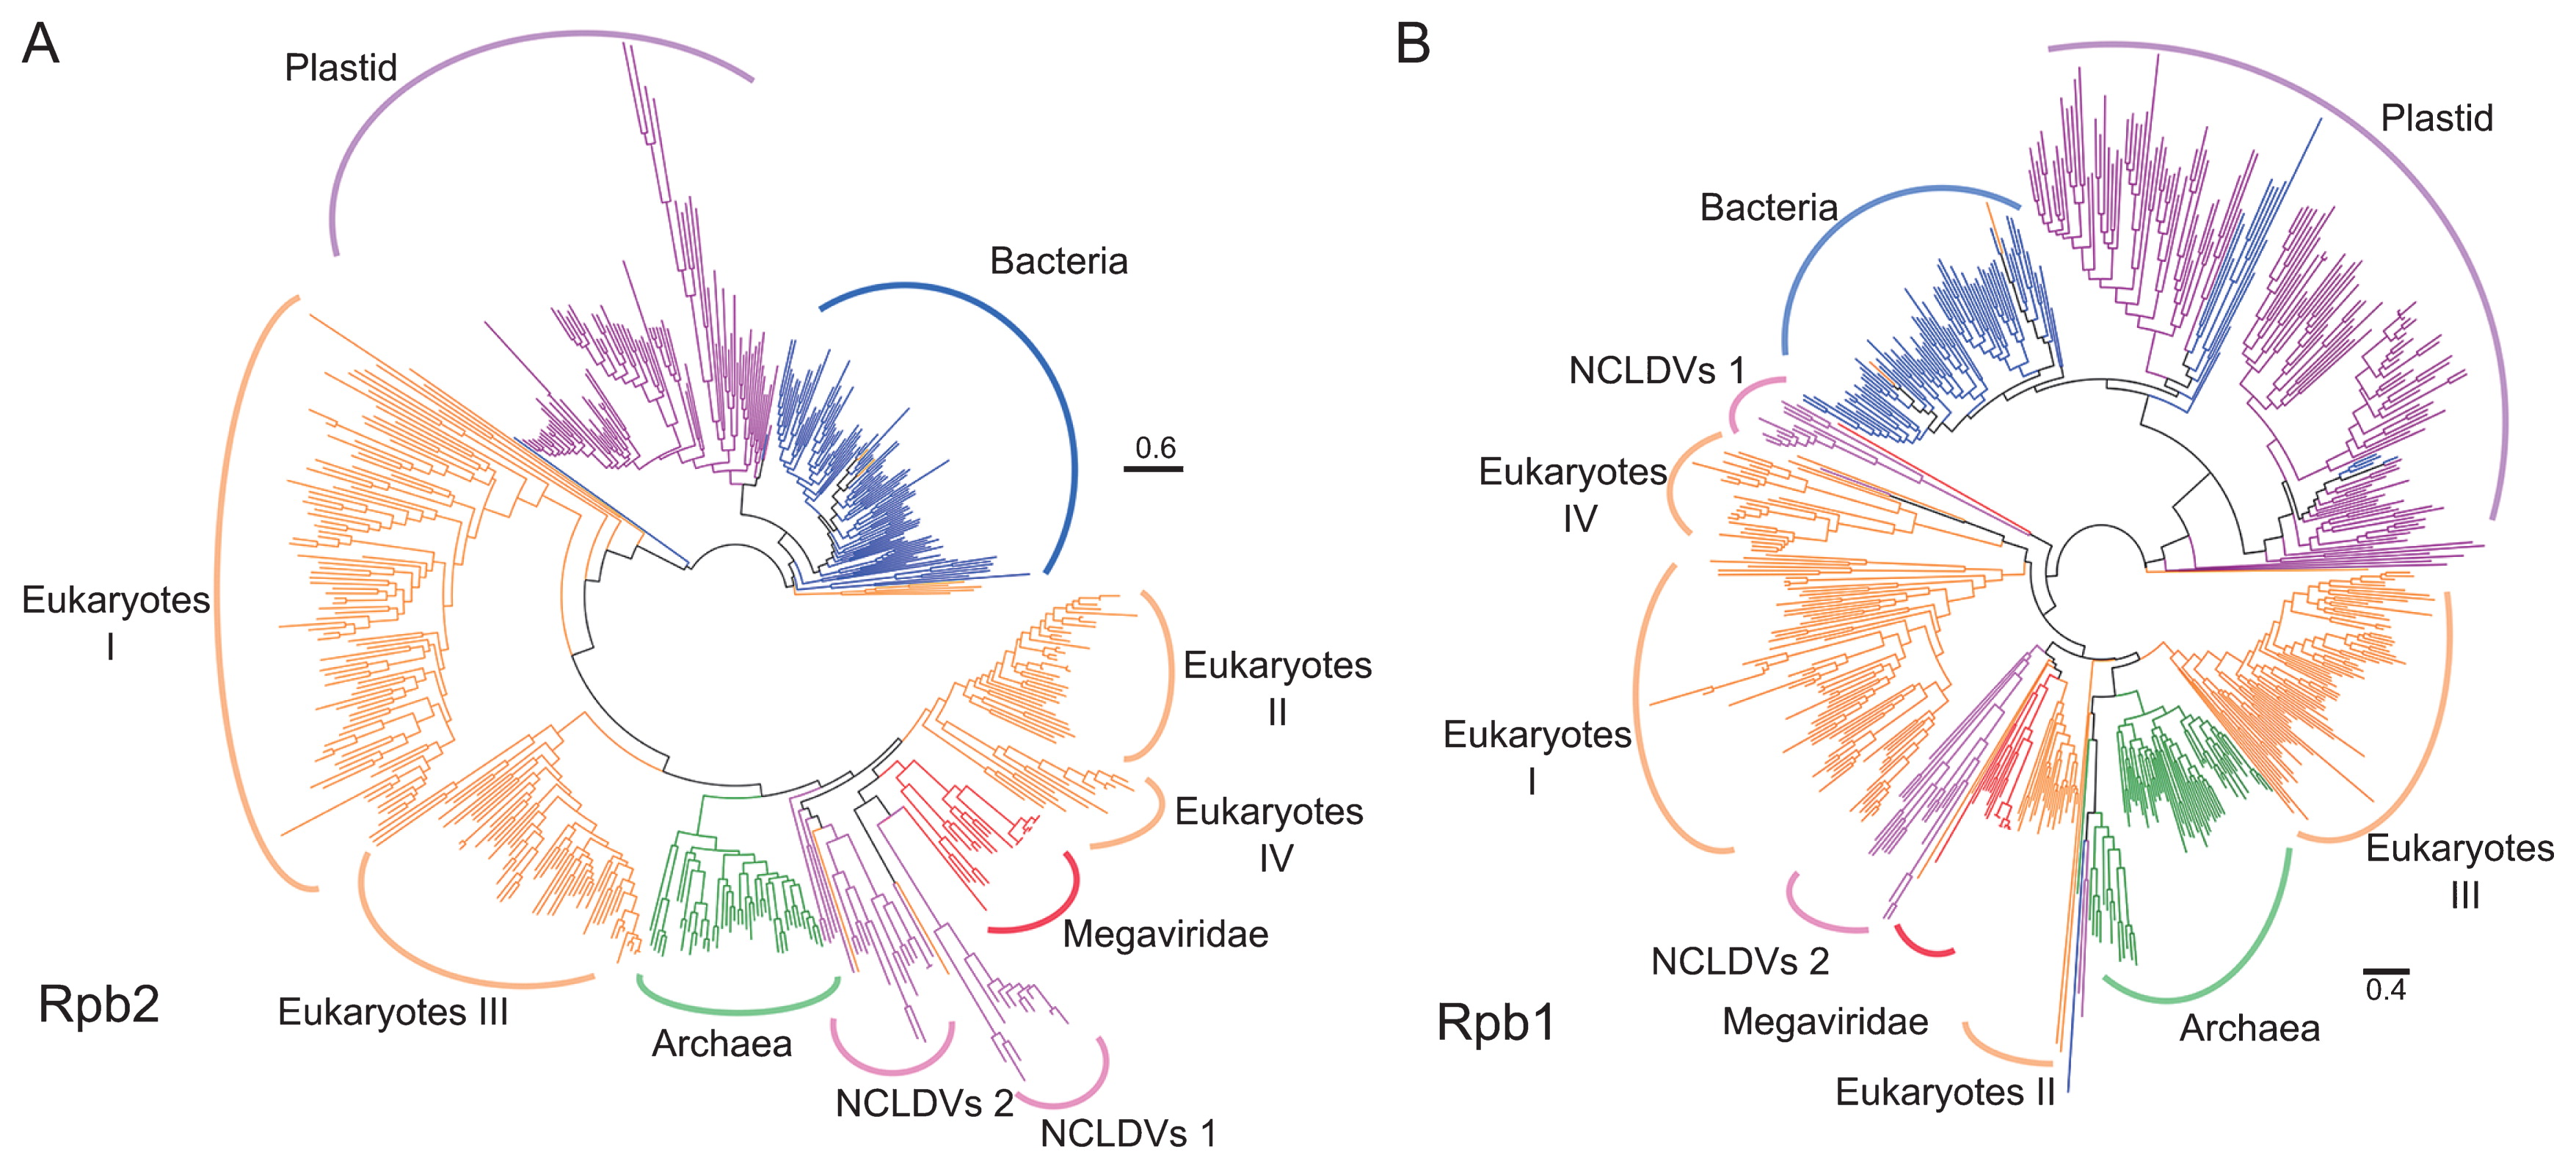
We identified 59,938 Rpb2 and 40,534 Rpb1 homologs in the UniProt/RefSeq sequence databases using profile HMMs derived from COG0085 (Rpb2) and COG0086 (Rpb1). Viral Rpb2/Rpb1 sequences identified by this search all originated from NCLDVs. Among these sequences, 511 Rpb2 and 575 Rpb1 sequences were selected as reference sequences after reducing redundancy by clustering and discarding unusually long and short sequences. Based on the reference sequences, we built reference phylogenetic trees for Rpb2 (Fig. 2A) and Rpb1 (Fig. 2B). The reference trees were generally consistent with the classification of prokaryotes and viruses as well as eukaryotic paralogs.
Using profile HMMs built from these reference sequences, 248,101 and 252,609 sequences were obtained from metagenomes as candidates of environmental Rpb2 and Rpb1, respectively. These environmental sequences were phylogenetically classified using the reference trees described above, and specific phylogenetic groups were successfully assigned to 195,195 Rpb2 and 214,521 Rpb1 sequences (Table 1). The taxonomic assignments were dominated by Bacteria (80% for Rpb2, 81% for Rpb1), Archaea (5.7% for Rpb2, 6.6% for Rpb1), and Megaviridae (10.2% for Rpb2, 6.1% for Rpb1) as expected from the microbial size fractions (enriched with prokaryotic size organisms and viruses, Table S1) targeted by most of the analyzed metagenomes. Most of the sequences that were taxonomically assigned to Megaviridae were found in marine metagenomes (Rpb2: 18,633 [93.3%]; Rpb1: 12,225 [93.0%]), which is consistent with the previous finding of the high abundance of Megaviridae in the sea (32). The detection of eukaryotic sequences was limited (1,824 for Rpb2 and 1,276 for Rpb1 for RNA polymerase II from marine metagenomes) and likely biased towards picoeukaryotes due to the filter size range. Therefore, we excluded eukaryotic sequences in subsequent analyses and focused on Megaviridae, Bacteria, and Archaea sequences identified in marine metagenomic data unless otherwise specified.
Table 1
Number of taxonomically assigned metagenome sequences.
|
Environment |
|
|
|
Marine |
Other aquatic |
Mammal associated |
Other |
Total |
|
|
|
|
|
|
| Operational clade name |
Rpb2 |
Rpb1 |
Rpb2 |
Rpb1 |
Rpb2 |
Rpb1 |
Rpb2 |
Rpb1 |
Rpb2 |
Rpb1 |
| Eukaryote I |
690 |
741 |
16 |
14 |
82 |
109 |
0 |
2 |
788 |
866 |
| Eukaryote II |
1,824 |
1,276 |
77 |
28 |
78 |
108 |
4 |
2 |
1,983 |
1,414 |
| Eukaryote III |
729 |
854 |
17 |
10 |
68 |
101 |
0 |
1 |
814 |
966 |
| Eukaryote IV/V |
82 |
54 |
7 |
5 |
0 |
3 |
0 |
0 |
89 |
62 |
| Bacteria |
111,124 |
125,874 |
6,387 |
6,740 |
38,192 |
39,798 |
588 |
625 |
156,291 |
173,037 |
| Archaea |
10,177 |
12,826 |
640 |
784 |
56 |
102 |
300 |
341 |
11,173 |
14,053 |
| Megaviridae |
18,633 |
12,225 |
1,330 |
841 |
10 |
79 |
0 |
0 |
19,973 |
13,145 |
| Chloroplast |
2,540 |
7,666 |
27 |
455 |
91 |
1,159 |
2 |
5 |
2,660 |
9,285 |
| NCLDVs 1 |
119 |
80 |
20 |
6 |
19 |
9 |
0 |
0 |
158 |
95 |
| NCLDVs 2 |
1,135 |
1,484 |
126 |
110 |
4 |
2 |
1 |
2 |
1,266 |
1,598 |
| Total |
147,053 |
163,080 |
8,647 |
8,993 |
38,600 |
41,470 |
895 |
978 |
195,195 |
214,521 |
The average lengths of the Rpb2 and Rpb1 reference sequences were as follows: Megaviridae Rpb2 (1,239 aa) and Rpb1 (1,392 aa); bacterial Rpb2 (1,282 aa) and Rpb1 (1,346 aa); archaeal Rpb2 (1,132 aa) and Rpb1 (1,373 aa). In contrast, most of the metagenomic Rpb2/Rpb1 sequences were found to be partial: Megaviridae Rpb2 (314 aa) and Rpb1 (314 aa); bacterial Rpb2 (292 aa) and Rpb1 (285 aa); archaeal Rpb2 (313 aa) and Rpb1 (303 aa). These sequences were aligned on reference Rpb2 and Rpb1 alignments (RAln-MBA-Rpb2 and RAln-MBA-Rpb1) composed of complete sequences from Megaviridae, Bacteria, and Archaea (Fig. S1). We assessed taxon richness by generating operational taxonomic units (OTUs) from sequences aligned inside a 100-aa window along the reference alignments. In order to generate OTUs, clustering was performed with three amino acid sequence identity thresholds (i.e., 90%, 80%, and 70% identities). Rpb2 and Rpb1 of Megaviridae showed a higher number of OTUs than those of Bacteria or Archaea at all resampling levels at each of the three arbitrarily selected sequence rich regions (Fig. 3 and Fig. S2A and S2B). Similar results were obtained when metagenomic sequences from other environments, such as freshwater and the human gastrointestinal tract, were included (Fig. S2C and S2D), and confirmed along the entire length of the reference alignments; Megaviridae exhibited a larger number of OTUs than the two cellular domains whatever the regions of Rpb2 and Rpb1 considered (Fig. 4A and B). Log-rank tests indicated that differences in the number of OTUs between Megaviridae and the two cellular domains were significant (Fig. 4C and D).

Rpb2 and Rpb1 were encoded as a single copy in most of the sequenced bacterial and archaeal genomes; only 1.96% (Rpb2) and 2.97% (Rpb1) of bacterial, and 1.00% (Rpb2) and 1.00% (Rpb1) of archaeal genomes presented paralogs. However, during the reconstruction of RNAP reference trees, we noted that some Megaviridae, such as PgV and OLPV1/2, encoded two copies of Rpb2 genes. The existence of these paralogs may contribute to increasing the richness of the homologous group of sequences, hence inducing bias in taxon richness interpretations. In order to investigate the evolutionary relationships of these paralogs, we reconstructed Rpb2 trees, including metagenomic sequences, based on the same three sequence rich sub-alignment regions. The results of these analyses revealed that the Rpb2 paralogs were only distantly related in the reconstructed phylogenetic trees (Fig. S3). A set of Rpb2 from PgV, OLPV1, and OLPV2 grouped together, whereas another set of Rpb2 from the same viruses formed another group. This tree topology strongly suggested a single duplication event of Rpb2 in the ancestor of these viruses. Therefore, the existence of Megaviridae Rpb2 paralogs may lead to an approximately two-fold increase in apparent richness. In order to obtain a more reasonable estimate for the taxon richness of Megaviridae based on Rpb2 sequences, we classified metagenomic Rpb2 homologs into two groups by taking putative ancient duplication into account (Fig. S3A, S3B, and S3C). Richness estimates and rarefaction curves for individually analyzed paralogous groups still indicated a larger number of OTUs for Megaviridae than for Bacteria and Archaea at any given number of resampled sequences (Fig. 3C). Paralogs were not found for Rpb1, except for a pair of Rpb1 sequences in AaV. Sequence identity between the AaV Rpb1 sequences was 33%. These sequences were found to be closely located in phylogenetic trees when metagenomic Rpb1 sequences were included (Fig. S3D). Therefore, we considered the influence of the paralogous Rpb1 groups on the taxon richness estimate to be negligible.
Comparison of PD between Megaviridae and Bacteria/Archaea
PD is a measure of the diversity of phylogenetically related sequences, defined as the sum of all branch lengths in the phylogenetic tree (60). We calculated PD scores for Rpb2 and Rpb1 sequences obtained from marine metagenomes using a sliding window on the Rpb alignment RAln-MBA-Rpb2 and RAln-MBA-Rpb1 (Fig. 5). Megaviridae showed higher PD scores than Bacteria and Archaea along the entire length of the alignments.

The phylogenetic distribution of Megaviridae Rpb2 sequences on the reference tree indicated that a larger number of metagenomic sequences mapped to Mesomimivirinae subfamily branches (95.1%) than to Megamimivirinae subfamily branches (4.6%) (Fig. 6). Among the Megamimivirinae branches, a larger number of environmental sequences (275 sequences) mapped to the branch leading to CroV than to the branches leading to Klosneuviruses (52 sequences) or amoebal mimiviruses (37 sequences). A notable feature of the Rpb2 phylogenetic distribution was that the deeper the branches (i.e., the closer to the root), the higher the number of environmental sequences they got assigned: e.g. 5,414 sequences mapped to the root of one of the Mesomimivirinae Rpb2, whereas only 234, 259, 1,247, and 438 sequences mapped to the leaves representing OLPV1, OLPV2, PgV, and CeV reference genomes, respectively.
Discussion
In the present study, we extracted environmental Rpb1 and Rpb2 sequence fragments from a large set of microbial metagenomes (58 projects) and classified them into taxonomic groups using a phylogenetic placement method. Taxonomic assignments revealed a large representation of bacterial Rpb1/2 sequences (~80%) and fewer archaeal and Megaviridae sequences (5–10%). Megaviridae sequences were preferentially detected from metagenomes originating from aquatic environments. This is consistent with previous findings, although members of Megaviridae have been isolated from various environments including oceans, lakes, rivers, air conditioning cooling systems, drainage, and soil (41). The over-representation of bacterial Rpb1/2 sequences in metagenomes is expected given their known dominance in various environments (26, 32). When the same sequence similarity thresholds were applied for taxon delineation for cellular organisms and viruses, Megaviridae showed significantly higher taxon richness than Bacteria and Archaea. As a more general measure that does not require sequence identity thresholds, we also examined PD. The PD indices of Megaviridae were also systematically higher than those of Bacteria and Archaea.
A possible reason for why apparent taxon richness in the Megaviridae is so vast could be a fast evolutionary rate in Megaviridae. However, our results indicated that functional constraints are higher for Megaviridae Rpb1/2 than for bacterial homologs. This result suggests that the rate of sequence evolution is lower for Megaviridae Rpb1/2 than for bacterial homologs if their mutation rates are similar. Blanc-Mathieu and Ogata (5) previously indicated that the mutation rate of giant viruses may be as low as prokaryotes based on Drake’s rule, postulating that “the mutation rate per genome has evolved towards a nearly invariant value across taxa”, as well as the finding that giant viruses encode many DNA repair enzymes. A recent study monitoring more than one year of experimental evolution consistently demonstrated that the mutation rates of a giant virus, Lausannevirus, and a bacterium remained similar over the length of the experiment (58). Therefore, the average mutation rate of Megaviridae may be similar to that of prokaryotes.
Even if a high mutation rate potentially contributed to accelerated evolution, fast evolution is not sufficient to explain the prominent radiation of evolutionarily deep lineages because radiation requires niche expansion (62). As a matter of fact, the richness of prokaryotes, which evolve faster than eukaryotes, is less than that of eukaryotes in marine environments. Recent studies revealed the presence of ~110,000 OTUs at the species level for eukaryotic plankton in the global sunlit ocean (18), but only 36,000–45,000 OTUs for prokaryotes in the same type of environment (76, 92). The markedly high taxon richness of Megaviridae revealed by our study parallels the high richness of eukaryotes, the potential hosts of Megaviridae. Based on the ancient origin of Megaviridae that has been inferred to antedate the emergence of major eukaryotic lineages, our results strongly support the Megaviridae family having a phylogenetically deep and wide co-evolutionary history with diverse marine protists. This virus-host co-evolution may have been at work from the early “Big-Bang” radiation down to the more recent diversification of the tree of eukaryotes. In other words, the long history of the diversification of eukaryotes may have played a key role in the successive niche expansion of Megaviridae. A similar co-evolutionary history was also proposed for a family of RNA viruses (37).
Many of the Megaviridae sequences were placed in the branches leading to Mesomimivirinae (Fig. 6), which are currently represented by algae-infecting viruses, such as PgV and CeV. The host range of algal species of this clade spans from Haptophyceae (Phaeocystales and Prymnesiales) to Pelagophyceae and Chlorophyta, which are deeply separated from one another in the eukaryotic tree. It is also important to note that even haptophytes alone constitute a very rich group of unicellular eukaryotes (18). Among the Megamimivirinae subfamily, one of the most abundant lineages observed in marine metagenomes was the microzooplankton infecting CroV; however, since the deeper branches also received many sequence assignments, the inference of potential hosts for these sequences are difficult. Overall, the phylogenetic positions of these marine Megaviridae marker genes point to diverse protists, including unicellular algae and microflagellates, as the potential host of these uncultured Megaviridae. Although the amoebal co-culture method (41) has permitted many new mimiviruses to be analyzed, further efforts to isolate viruses from diverse eukaryotes are desirable in order to increase the genome sampling coverage of this diverse clade.
In the present study, we showed that the taxon richness of Megaviridae exceeded that of the prokaryotic domains in the ocean. Investigations on the as yet uncovered diversity of Megaviridae will require the development of experimental alternatives to virus isolation by co-culture method, which is a labor-intensive process depending on the culturability of eukaryotic hosts. These methods include single cell genomics (87), single virus genomics (84), the development of degenerate PCR primers, and a co-occurrence network analysis (32).
Acknowledgements
This work was supported by The Canon Foundation (No. 203143100025), JSPS/KAKENHI (Nos. 16KT0020, 17H03850, and 26430184), Scientific Research on Innovative Areas from the Ministry of Education, Culture, Science, Sports and Technology (MEXT) of Japan (Nos. 16H06429, 16K21723, and 16H06437), and the Collaborative Research Program of the Institute for Chemical Research, Kyoto University (No. 2016-28, 2017-25). PH was supported by the OCEANOMICS “Investissements d’Avenir” program of the French government (No. ANR-11-BTBR-0008). Computational work was completed at the SuperComputer System, Institute for Chemical Research, Kyoto University. We thank the Tara Oceans consortium, staff, and sponsors who supported the Tara Oceans Expedition (http://www.embl.de/tara-oceans/) for making data accessible. This is contribution number 72 of the Tara Oceans Expedition 2009–2013.
References
- 1. Aherfi, S., P. Colson, B. LaScola, and D. Raoult. 2016. Giant Viruses of Amoebas: An Update. Front Microbiol. 7:349.
- 2. Arslan, D., M. Legendre, V. Seltzer, C. Abergel, and J.M. Claverie. 2011. Distant Mimivirus relative with a larger genome highlights the fundamental features of Megaviridae. Proc Natl Acad Sci USA. 108:17486-17491.
- 3. Baltanás, A. 1992. On the use of some methods for the estimation of species richness. Oikos. 65:484-492.
- 4. Birtles, R.J., T.J. Rowbotham, C. Storey, T.J. Marrie, and D. Raoult. 1997. Chlamydia-like obligate parasite of free-living amoebae. Lancet. 349:925-926.
- 5. Blanc-Mathieu, R., and H. Ogata. 2016. DNA repair genes in the Megavirales pangenome. Curr Opin Microbiol. 31:94-100.
- 6. Boyer, M., N. Yutin, I. Pagnier, et al. 2009. Giant Marseillevirus highlights the role of amoebae as a melting pot in emergence of chimeric microorganisms. Proc Natl Acad Sci USA. 106:21848-21853.
- 7. Boyer, M., M.A. Madoui, G. Gimenez, B. La Scola, and D. Raoult. 2010. Phylogenetic and phyletic studies of informational genes in genomes highlight existence of a 4th domain of life including giant viruses. PLoS One. 5:e15530.
- 8. Capella-Gutierrez, S., J.M. Silla-Martinez, and T. Gabaldon. 2009. trimAl: a tool for automated alignment trimming in large-scale phylogenetic analyses. Bioinformatics. 25:1972-1973.
- 9. Carradec, Q., E. Pelletier, C. Da Silva, et al. 2018. A global ocean atlas of eukaryotic genes. Nat Commun. 9:373.
- 10. Cheetham, G.M., and T.A. Steitz. 2000. Insights into transcription: structure and function of single-subunit DNA-dependent RNA polymerases. Curr Opin Struct Biol. 10:117-123.
- 11. Chernomor, O., B.Q. Minh, F. Forest, S. Klaere, T. Ingram, M. Henzinger, and A. von Haeseler. 2015. Split diversity in constrained conservation prioritization using integer linear programming. Methods Ecol Evol. 6:83-91.
- 12. Ciaccafava, A., A. Lartigue, P. Mansuelle, S. Jeudy, and C. Abergel. 2011. Preliminary crystallographic analysis of a possible transcription factor encoded by the mimivirus L544 gene. Acta Crystallogr, Sect F Struct Biol Cryst Commun. 67:922-925.
- 13. Claverie, J.M. 2006. Viruses take center stage in cellular evolution. Genome Biol. 7:110.
- 14. Claverie, J.M., and H. Ogata. 2009. Ten good reasons not to exclude giruses from the evolutionary picture. Nat Rev Microbiol. 7:615author reply 615.
- 15. Claverie, J.M., and C. Abergel. 2016. Giant viruses: The difficult breaking of multiple epistemological barriers. Stud Hist Philos Biol Biomed Sci. 59:89-99.
- 16. Colson, P., G. Gimenez, M. Boyer, G. Fournous, and D. Raoult. 2011. The giant Cafeteria roenbergensis virus that infects a widespread marine phagocytic protist is a new member of the fourth domain of Life. PLoS One. 6:e18935.
- 17. Colson, P., X. De Lamballerie, N. Yutin, et al. 2013. “Megavirales”, a proposed new order for eukaryotic nucleocytoplasmic large DNA viruses. Arch Virol. 158:2517-2521.
- 18. de Vargas, C., S. Audic, N. Henry, et al. 2015. Ocean plankton. Eukaryotic plankton diversity in the sunlit ocean. Science. 348:1261605.
- 19. Deeg, C.M., C.E.T. Chow, and C.A. Suttle. 2017. The kinetoplastid-infecting Bodo saltans virus (BsV), a window into the most abundant giant viruses in the sea. bioRxiv 214536.
- 20. Eddy, S.R. 1998. Profile hidden Markov models. Bioinformatics. 14:755-763.
- 21. Edgar, R.C. 2010. Search and clustering orders of magnitude faster than BLAST. Bioinformatics. 26:2460-2461.
- 22. Faith, D.P. 1992. Conservation evaluation and phylogenetic diversity. Biol Conserv. 61:1-10.
- 23. Filee, J., P. Siguier, and M. Chandler. 2007. I am what I eat and I eat what I am: acquisition of bacterial genes by giant viruses. Trends Genet. 23:10-15.
- 24. Filee, J. 2015. Genomic comparison of closely related Giant Viruses supports an accordion-like model of evolution. Front Microbiol. 6:593.
- 25. Fischer, M.G., M.J. Allen, W.H. Wilson, and C.A. Suttle. 2010. Giant virus with a remarkable complement of genes infects marine zooplankton. Proc Natl Acad Sci USA. 107:19508-19513.
- 26. Flaviani, F., D.C. Schroeder, C. Balestreri, J.L. Schroeder, K. Moore, K. Paszkiewicz, M.C. Pfaff, and E.P. Rybicki. 2017. A Pelagic Microbiome (Viruses to Protists) from a Small Cup of Seawater. Viruses. 9:47.
- 27. Forterre, P. 2013. The virocell concept and environmental microbiology. ISME J. 7:233-236.
- 28. Gallot-Lavallee, L., A. Pagarete, M. Legendre, S. Santini, R.A. Sandaa, H. Himmelbauer, H. Ogata, G. Bratbak, and J.M. Claverie. 2015. The 474-Kilobase-Pair Complete Genome Sequence of CeV-01B, a Virus Infecting Haptolina (Chrysochromulina) ericina (Prymnesiophyceae). Genome Announc. 3.
- 29. Gallot-Lavallee, L., G. Blanc, and J.M. Claverie. 2017. Comparative Genomics of Chrysochromulina Ericina Virus and Other Microalga-Infecting Large DNA Viruses Highlights Their Intricate Evolutionary Relationship with the Established Mimiviridae Family. J Virol. 91.
- 30. Galperin, M.Y., K.S. Makarova, Y.I. Wolf, and E.V. Koonin. 2015. Expanded microbial genome coverage and improved protein family annotation in the COG database. Nucleic Acids Res. 43:D261-D269.
- 31. Gaze, W.H., G. Morgan, L. Zhang, and E.M. Wellington. 2011. Mimivirus-like particles in acanthamoebae from Sewage Sludge. Emerg Infect Dis. 17:1127-1129.
- 32. Hingamp, P., N. Grimsley, S.G. Acinas, et al. 2013. Exploring nucleo-cytoplasmic large DNA viruses in Tara Oceans microbial metagenomes. ISME J. 7:1678-1695.
- 33. Iyer, L.M., E.V. Koonin, and L. Aravind. 2003. Evolutionary connection between the catalytic subunits of DNA-dependent RNA polymerases and eukaryotic RNA-dependent RNA polymerases and the origin of RNA polymerases. BMC Struct Biol. 3:1.
- 34. Johannessen, T.V., G. Bratbak, A. Larsen, H. Ogata, E.S. Egge, B. Edvardsen, W. Eikrem, and R.A. Sandaa. 2015. Characterisation of three novel giant viruses reveals huge diversity among viruses infecting Prymnesiales (Haptophyta). Virology. 476:180-188.
- 35. Kanehisa, M., S. Goto, Y. Sato, M. Kawashima, M. Furumichi, and M. Tanabe. 2014. Data, information, knowledge and principle: back to metabolism in KEGG. Nucleic Acids Res. 42:D199-D205.
- 36. Katoh, K., and D.M. Standley. 2013. MAFFT multiple sequence alignment software version 7: improvements in performance and usability. Mol Biol Evol. 30:772-780.
- 37. Koonin, E.V., Y.I. Wolf, K. Nagasaki, and V.V. Dolja. 2008. The Big Bang of picorna-like virus evolution antedates the radiation of eukaryotic supergroups. Nat Rev Microbiol. 6:925-939.
- 38. Koonin, E.V., Y.I. Wolf, and P. Puigbo. 2009. The phylogenetic forest and the quest for the elusive tree of life. Cold Spring Harb Symp Quant Biol. 74:205-213.
- 39. Kusser, A.G., M.G. Bertero, S. Naji, T. Becker, M. Thomm, R. Beckmann, and P. Cramer. 2008. Structure of an archaeal RNA polymerase. J Mol Biol. 376:303-307.
- 40. La Scola, B., S. Audic, C. Robert, L. Jungang, X. de Lamballerie, M. Drancourt, R. Birtles, J.M. Claverie, and D. Raoult. 2003. A giant virus in amoebae. Science. 299:2033.
- 41. La Scola, B., A. Campocasso, R. N’Dong, G. Fournous, L. Barrassi, C. Flaudrops, and D. Raoult. 2010. Tentative characterization of new environmental giant viruses by MALDI-TOF mass spectrometry. Intervirology. 53:344-353.
- 42. Legendre, M., S. Audic, O. Poirot, et al. 2010. mRNA deep sequencing reveals 75 new genes and a complex transcriptional landscape in Mimivirus. Genome Res. 20:664-674.
- 43. Legendre, M., S. Santini, A. Rico, C. Abergel, and J.M. Claverie. 2011. Breaking the 1000-gene barrier for Mimivirus using ultra-deep genome and transcriptome sequencing. Virol J. 8:99.
- 44. Legendre, M., D. Arslan, C. Abergel, and J.M. Claverie. 2012. Genomics of Megavirus and the elusive fourth domain of Life. Commun Integr Biol. 5:102-106.
- 45. Legendre, M., J. Bartoli, L. Shmakova, et al. 2014. Thirty-thousandyear-old distant relative of giant icosahedral DNA viruses with a pandoravirus morphology. Proc Natl Acad Sci USA. 111:4274-4279.
- 46. Legendre, M., A. Lartigue, L. Bertaux, et al. 2015. In-depth study of Mollivirus sibericum, a new 30,000-y-old giant virus infecting Acanthamoeba. Proc Natl Acad Sci USA. 112:E5327-5335.
- 47. Li, W., and A. Godzik. 2006. Cd-hit: a fast program for clustering and comparing large sets of protein or nucleotide sequences. Bioinformatics. 22:1658-1659.
- 48. Matsen, F.A., R.B. Kodner, and E.V. Armbrust. 2010. pplacer: linear time maximum-likelihood and Bayesian phylogenetic placement of sequences onto a fixed reference tree. BMC Bioinformatics. 11:538.
- 49. Mihara, T., Y. Nishimura, Y. Shimizu, H. Nishiyama, G. Yoshikawa, H. Uehara, P. Hingamp, S. Goto, and H. Ogata. 2016. Linking virus genomes with host taxonomy. Viruses. 8:66.
- 50. Mirzakhanyan, Y., and P.D. Gershon. 2017. Multisubunit DNA-dependent RNA polymerases from vaccinia virus and other nucleocytoplasmic large-DNA viruses: Impressions from the age of structure. Microbiol Mol Biol Rev. 81.
- 51. Monier, A., J.M. Claverie, and H. Ogata. 2008. Taxonomic distribution of large DNA viruses in the sea. Genome Biol. 9:R106.
- 52. Monier, A., J.B. Larsen, R.A. Sandaa, G. Bratbak, J.M. Claverie, and H. Ogata. 2008. Marine mimivirus relatives are probably large algal viruses. Virol J. 5:12.
- 53. Moniruzzaman, M., G.R. LeCleir, C.M. Brown, C.J. Gobler, K.D. Bidle, W.H. Wilson, and S.W. Wilhelm. 2014. Genome of brown tide virus (AaV), the little giant of the Megaviridae, elucidates NCLDV genome expansion and host-virus coevolution. Virology. 466–467:60-70.
- 54. Moreira, D., and P. Lopez-Garcia. 2005. Comment on “The 1.2-megabase genome sequence of Mimivirus”. Science. 308:1114author reply 1114.
- 55. Moreira, D., and C. Brochier-Armanet. 2008. Giant viruses, giant chimeras: the multiple evolutionary histories of Mimivirus genes. BMC Evol Biol. 8:12.
- 56. Moreira, D., and P. Lopez-Garcia. 2009. Ten reasons to exclude viruses from the tree of life. Nat Rev Microbiol. 7:306-311.
- 57. Moreira, D., and P. Lopez-Garcia. 2015. Evolution of viruses and cells: do we need a fourth domain of life to explain the origin of eukaryotes? Philos Trans R Soc Lond, B Biol Sci. 37020140327.
- 58. Mueller, L., C. Bertelli, T. Pillonel, N. Salamin, and G. Greub. 2017. One year genome evolution of Lausannevirus in allopatric versus sympatric conditions. Genome Biol Evol. 9:1432-1449.
- 59. Nasir, A., K.M. Kim, and G. Caetano-Anolles. 2012. Giant viruses coexisted with the cellular ancestors and represent a distinct supergroup along with superkingdoms Archaea, Bacteria and Eukarya. BMC Evol Biol. 12:156.
- 60. Nayfach, S., and K.S. Pollard. 2016. Toward accurate and quantitative comparative metagenomics. Cell. 166:1103-1116.
- 61. O’Leary, N.A., M.W. Wright, J.R. Brister, et al. 2016. Reference sequence (RefSeq) database at NCBI: current status, taxonomic expansion, and functional annotation. Nucleic Acids Res. 44:D733-745.
- 62. Parent, C.E., D. Agashe, and D.I. Bolnick. 2014. Intraspecific competition reduces niche width in experimental populations. Ecol Evol. 4:3978-3990.
- 63. Philippe, N., M. Legendre, G. Doutre, et al. 2013. Pandoraviruses: amoeba viruses with genomes up to 2.5 Mb reaching that of parasitic eukaryotes. Science. 341:281-286.
- 64. Price, M.N., P.S. Dehal, and A.P. Arkin. 2009. FastTree: computing large minimum evolution trees with profiles instead of a distance matrix. Mol Biol Evol. 26:1641-1650.
- 65. Raoult, D., S. Audic, C. Robert, C. Abergel, P. Renesto, H. Ogata, B. La Scola, M. Suzan, and J.M. Claverie. 2004. The 1.2-megabase genome sequence of Mimivirus. Science. 306:1344-1350.
- 66. Raoult, D., and P. Forterre. 2008. Redefining viruses: lessons from Mimivirus. Nat Rev Microbiol. 6:315-319.
- 67. Renesto, P., C. Abergel, P. Decloquement, D. Moinier, S. Azza, H. Ogata, P. Fourquet, J.P. Gorvel, and J.M. Claverie. 2006. Mimivirus giant particles incorporate a large fraction of anonymous and unique gene products. J Virol. 80:11678-11685.
- 68. Rusch, D.B., A.L. Halpern, G. Sutton, et al. 2007. The Sorcerer II global ocean sampling expedition: northwest Atlantic through eastern tropical Pacific. PLoS Biol. 5:e77.
- 69. Santini, S., S. Jeudy, J. Bartoli, et al. 2013. Genome of Phaeocystis globosa virus PgV-16T highlights the common ancestry of the largest known DNA viruses infecting eukaryotes. Proc Natl Acad Sci USA. 110:10800-10805.
- 70. Schmidt, R., R. Kwiecien, A. Faldum, F. Berthold, B. Hero, and S. Ligges. 2015. Sample size calculation for the one-sample log-rank test. Stat Med. 34:1031-1040.
- 71. Schulz, F., N. Yutin, N.N. Ivanova, et al. 2017. Giant viruses with an expanded complement of translation system components. Science. 356:82-85.
- 72. Sharma, V., P. Colson, R. Giorgi, P. Pontarotti, and D. Raoult. 2014. DNA-dependent RNA polymerase detects hidden giant viruses in published databanks. Genome Biol Evol. 6:1603-1610.
- 73. Shimodaira, H. 2002. An approximately unbiased test of phylogenetic tree selection. Syst Biol. 51:492-508.
- 74. Steitz, T.A. 2009. The structural changes of T7 RNA polymerase from transcription initiation to elongation. Curr Opin Struct Biol. 19:683-690.
- 75. Sun, S., J. Chen, W. Li, et al. 2011. Community cyberinfrastructure for advanced microbial ecology research and analysis: the CAMERA resource. Nucleic Acids Res. 39:D546-551.
- 76. Sunagawa, S., L.P. Coelho, S. Chaffron, et al. 2015. Ocean plankton. Structure and function of the global ocean microbiome. Science. 348:1261359.
- 77. Takemura, M., S. Yokobori, and H. Ogata. 2015. Evolution of eukaryotic DNA polymerases via interaction between cells and large DNA viruses. J Mol Evol. 81:24-33.
- 78. Takemura, M. 2016. Morphological and taxonomic properties of Tokyovirus, the first Marseilleviridae member isolated from Japan. Microbes Environ. 31:442-448.
- 79. UniProt Consortium. 2015. UniProt: a hub for protein information. Nucleic Acids Res. 43:D204-212.
- 80. Werner, F. 2007. Structure and function of archaeal RNA polymerases. Mol Microbiol. 65:1395-1404.
- 81. Werner, F. 2008. Structural evolution of multisubunit RNA polymerases. Trends Microbiol. 16:247-250.
- 82. Werner, F., and D. Grohmann. 2011. Evolution of multisubunit RNA polymerases in the three domains of life. Nat Rev Microbiol. 9:85-98.
- 83. Williams, T.A., T.M. Embley, and E. Heinz. 2011. Informational gene phylogenies do not support a fourth domain of life for nucleocytoplasmic large DNA viruses. PLoS One. 6:e21080.
- 84. Wilson, W.H., I.C. Gilg, M. Moniruzzaman, et al. 2017. Genomic exploration of individual giant ocean viruses. ISME J. 11:1736-1745.
- 85. Yang, Z. 1997. PAML: a program package for phylogenetic analysis by maximum likelihood. CABIOS, Comput Appl Biosci. 13:555-556.
- 86. Yau, S., F.M. Lauro, M.Z. DeMaere, et al. 2011. Virophage control of antarctic algal host-virus dynamics. Proc Natl Acad Sci USA. 108:6163-6168.
- 87. Yoon, H.S., D.C. Price, R. Stepanauskas, V.D. Rajah, M.E. Sieracki, W.H. Wilson, E.C. Yang, S. Duffy, and D. Bhattacharya. 2011. Single-cell genomics reveals organismal interactions in uncultivated marine protists. Science. 332:714-717.
- 88. Yoosuf, N., I. Pagnier, G. Fournous, C. Robert, D. Raoult, B. La Scola, and P. Colson. 2014. Draft genome sequences of Terra1 and Terra2 viruses, new members of the family Mimiviridae isolated from soil. Virology. 452–453:125-132.
- 89. Yoshida, T., J.M. Claverie, and H. Ogata. 2011. Mimivirus reveals Mre11/Rad50 fusion proteins with a sporadic distribution in eukaryotes, bacteria, viruses and plasmids. Virol J. 8:427.
- 90. Yutin, N., Y.I. Wolf, and E.V. Koonin. 2014. Origin of giant viruses from smaller DNA viruses not from a fourth domain of cellular life. Virology. 466–467:38-52.
- 91. Zhang, W., J. Zhou, T. Liu, Y. Yu, Y. Pan, S. Yan, and Y. Wang. 2015. Four novel algal virus genomes discovered from Yellowstone Lake metagenomes. Sci Rep. 5:15131.
- 92. Zinger, L., L.A. Amaral-Zettler, J.A. Fuhrman, et al. 2011. Global patterns of bacterial beta-diversity in seafloor and seawater ecosystems. PLoS One. 6:e24570.


