Abstract
Endozoicomonas bacteria are commonly regarded as having a potentially symbiotic relationship with their coral hosts. However, their diversity and phylogeny in samples collected from various sources remain unclear. Therefore, we designed an Endozoicomonas-specific primer paired with a bacterial universal primer to detect the 16S ribosomal RNA (rRNA) genes of this taxon and conducted an in-depth investigation of the Endozoicomonas community structure in reef-building corals. The primer had high specificity in the V3–V4 region (95.6%) and its sensitivity was high, particularly when Endozoicomonas was rare in samples (e.g., in seawater, which had a higher alpha diversity of Endozoicomonas than corals). In coral samples, predominant V3–V4 ribotypes had greater divergence than predominant V1–V2 ribotypes, and were grouped into at least 9 novel clades in a phylogenetic tree, indicating Endozoicomonas had high phylogenetic diversity. Divergence within this genus was potentially higher than that among 7 outgroup genera based on the phylogenetic distances of partial 16S rDNA sequences, suggesting that the taxonomy of this genus needs to be revised. In conclusion, dominant Endozoicomonas populations had variable phylogenies; furthermore, the newly designed primers may be useful molecular tools for the reliable detection of the Endozoicomonas community in marine environments.
Coral-associated bacteria are a crucial component in coral holobionts and are commonly considered to affect coral health, disease, and nutrient supply (19, 45, 49, 50, 58). A highly diverse coral-associated bacterial community was prevalent in many surveys (5, 9, 47), resulting in difficulties with defining the core coral microbiota and elucidating their functions. However, a few microbes likely to be core symbionts of the holobiont were recently identified (1); these organisms may have important functions (28) and beneficial roles in the coral holobiont.
Bacteria of the genus Endozoicomonas are commonly suggested as core coral microbes, and are closely associated with their coral hosts (8, 12, 40). These bacteria were detected in their coral hosts before bleaching and showed resilience after bleaching, suggesting ecological associations between Endozoicomonas and coral health (6, 33). Moreover, these bacteria were rarely detected in parts affected by coral diseases, but were abundant in uninfected parts, supporting the assertion that Endozoicomonas is associated with healthy coral (20, 37).
The genus Endozoicomonas was first proposed by Kurahashi and Yokota in 2007 (30), whereas the genus Spongiobacter was initially identified from a marine sponge; however, this genus has not been validated. These two genera are phylogenetically mixed and not clarified (27, 61). Endozoicomonas are common microbial residents that are present not only in corals, but also in other marine invertebrates worldwide. They were recently reported in various marine invertebrates, e.g., scleractinian corals (31), octocorals (10, 56), sponges (41), sea slugs (30), sea squirts (13), sea anemones (14), hydras (53), pen shells (25), polychaetes (43), oysters (61), and bivalves (27), and also in various locations, including South Africa (54), Asia (60), North America (22), Central America (37), South America (51), Europe (32), the Red Sea (4), and the Great Barrier Reef (35). Although the biogeographical prevalence of Endozoicomonas bacteria has been reported, their phylogeny and diversity remain unclear.
Variations in Endozoicomonas spp. have been reported and were suggested to be associated with habitats or host species (4, 34, 35, 42, 46). However, a comparative phylogenetic study using datasets from these studies is questionable due to variations in the methods used for the identification of these bacteria. Although the 16S rRNA gene was frequently used in previous studies, the various hypervariable regions of the 16S rRNA gene (e.g., the V1–V3 or V4–V5 regions) used resulted in difficulties with comparing phylogenetic relationships, particularly at a lower taxonomic level. Moreover, 16S rRNA genes were commonly detected using a pair of universal primers for DNA amplification. The detection of Endozoicomonas may be unreliable, particularly when there is a limited bacterial population in samples. Hence, in order to categorize diversity and phylogenetic variations, a specific primer for the detection of Endozoicomonas is required.
In the present study, we designed a novel primer set that specifically targeted the 16S rRNA gene of Endozoicomonas, enabling detailed assessments of the Endozoicomonas-related community. Furthermore, the primers were tested with 30 samples from various sources (i.e., 9 genera of reef-building corals, 3 locations, and 4 sampling times), and 3 seawater samples from 3 locations. Primer specificity and sensitivity were assessed and the alpha and beta diversities of Endozoicomonas were compared among samples. To the best of our knowledge, this is the first study to demonstrate the higher alpha diversity of Endozoicomonas in seawater versus coral samples, despite the markedly lower relative abundance of Endozoicomonas in seawater. Based on these results, in addition to the high phylogenetic diversity of Endozoicomonas among coral samples, Endozoicomonas may prefer a host-associated lifestyle and exhibit high heterogeneity in physiology, genetics, and ecology.
Materials and Methods
Endozoicomonas-specific primer design and pretest results
The Endozoicomonas-specific primer set was comprised of a specific reverse primer, En771R (5′-TCAGTGTCARRCCTGAGT GT-3′) and a bacterial universal forward primer, 27F (5′-AGAGTT TGATCMTGGCTCAG-3′). En771R was designed from the consensus region in the 16S rRNA genes of Endozoicomonas and Spongiobacter sequences published in the NCBI database (accession numbers: FJ457274.1, DQ889891.1, DQ917830.1, DQ917863.1, DQ917871.1, DQ917877.1, DQ917879.1, DQ917887.1, DQ917896.1, DQ917901.1, AB205011.1, AB196667.1, FJ347758.1, JX152780.1, and KC878324.1). The SINA Alignment service was used to confirm that these sequences were affiliated with Endozoicomonas. The selected consensus region differed from other close genera of Hahellaceae (accession numbers: EU599216.4, AY130994.1, AB467279.1, and AB467280.1). In addition, we designed a mismatch base (T) for the primer to be specific for Endozoicomonas based on a pre-test.
In the pretest, the mismatched primer (En771R: 5′-TCAGTGT CARRCCTGAGTGT-3′) and matched 771R primer (5′-TCAGTG TCARRCCAGAGTGT-3′) were compared using PCR and electrophoresis. We tested primer specificity and searched for a suitable annealing temperature by pairing our primer with the bacterial universal forward primer 27F in gradient PCR (range, 52.9 to 60.2°C). The V1–V4 region of the 16S rRNA genes of E. elysicola, E. montiporae, and Simiduia agarivorans and the total DNA of coral Heliopora samples were amplified. It is noteworthy that S. agarivorans is one of the groups closest to Endozoicomonas, and not classified as an Endozoicomonas spp. Furthermore, S. agarivorans was selected for the PCR pretest because 2 uncultivable bacteria that belonged to Simiduia from environmental samples were matched to a matched 771R primer when the primer pair was tested in silico using a SILVA primer test tool. Therefore, we used it as a negative control to select the annealing temperature.
A suitable annealing temperature for the primer pair was selected by gradient PCR (temperature range, 49.8 to 60.8°C) with finer temperature intervals (1–2°C). The V1–V4 regions of the 16S rRNA genes of E. elysicola, E. montiporae, S. agarivorans, and Escherichia coli (the latter 2 species were used as negative controls) were amplified with the specific primer En771R and bacterial universal primer 27F. In gel electrophoresis, 5 μL of each PCR product was loaded on a 1.5% agarose gel, and the gel was run in 1× TAE buffer under 100 V for 1 h. The specified regions in the 16S rRNA genes of E. elysicola and E. montiporae were amplified when the annealing temperature exceeded 54°C, whereas there were no PCR products from S. agarivorans or E. coli DNA. Therefore, PCR conditions were an initial step of 94°C for 3 min, 35 cycles of 94°C for 30 s, 54°C for 30 s and 72°C for 45 s, with a final extension of 72°C for 10 min.
Sample collection
Permits for coral sampling were received from local governments. In order to detect Endozoicomonas in various reef-building coral samples, 30 healthy coral samples were collected from 3 locations (Table S1 and Fig. S1): Kenting (Taiwan, tropical region, 21°56′58.3″N, 120°45′11.9″E), Hemei (Taiwan, subtropical region, 25°05′34.45″N, 121°55′2.06″E), and Kochi (Japan, near temperate region, 32°46′42.95″N, 132°43′56.06″E). The taxonomic affiliations of the collected coral samples belonged to 9 genera and consisted of a robust clade in Hexacorallia (Stylophora and Favia), a complex clade in Hexacorallia (Porites, Euphyllia, Acropora, Isopora, and Montipora), Octocorallia (Heliopora), Zoantharia (Palythoa), and Hydrozoa (Millepora).
All corals and seawater were collected at depths of 5 to 7 m. Coral samples were collected using either bone scissors or a hammer and chisel, rinsed with sterilized seawater, and placed in 99% ethanol for transportation. Duplicate coral sampling was performed on 2 separate colonies of each selected coral genus, owing to limited financial support and sampling times. At each sampling site, 1 L of seawater was collected just before coral sampling, and then filtered through a cellulose acetate membrane with 0.2-μm pores (Advantec, Tokyo, Japan). Sample preparation, bench experiments, and bioinformatic analyses were summarized in a flowchart (Fig. S2).
Total DNA extraction and amplification of the mitochondrial COI gene in coral
Coral samples were stored in 99% ethanol and washed twice with TE buffer (10 mM Tris-HCl and 1 mM EDTA, pH 8) before DNA extraction. Coral tissue with a skeleton was frozen in liquid nitrogen and then ground using a sterile mortar and pestle. The powder was transferred into TE buffer for total DNA extraction, as described (23, 59).
The taxonomy of coral samples (genus level) was assessed by morphology, and verified using DNA barcoding in a mitochondrial cytochrome c oxidase subunit I (COI) gene. The COI primers used in PCR for coral host identification were LCO1490 (5′-GGTCAA CAAATCATAAAGATATTGG-3′) and HCO2198 (5′-TAAACTT CAGGGTGACCAAAAAATCA-3′) (17). The 50-μL PCR mixture contained 1.5 U TaKaRa Ex Taq (Takara Bio, Otsu, Japan), 1× TaKaRa Ex Taq buffer, 0.2 mM deoxynucleotide triphosphate mixture (dNTP), 0.2 mM of each primer, and 40 ng DNA. The thermocycler conditions employed were an initial step of 94°C for 5 min, 30 cycles of 94°C for 30 s, 45°C for 20 s, and 72°C for 40 s, with a final extension of 72°C for 10 min (24). PCR products (~650 bp) were sequenced by Sanger sequencing; sequences identified by BLAST (NCBI) are shown (Table S2 and S1 Text).
Amplification of the Endozoicomonas V1–V4 region in the 16S rRNA gene using specific primers, multiplex Roche 454 junior pyrosequencing, and sequence data processing
The V1–V4 regions of 16S rRNA genes in Endozoicomonas species were amplified with the specific primer En771R and bacterial universal primer 27F. PCR conditions were optimized in order to increase specificity and sensitivity to the target gene. PCR occurred in 50-μL reaction volumes, consisting of 2.5 U TaKaRa Ex Taq, 1× TaKaRa Ex Taq buffer, 0.2 mM dNTP, 0.25 mM of each primer, and 50 to 150 ng purified total DNA. The thermocycler was set to an initial step of 94°C for 3 min, 35 cycles of 94°C for 30 s, 54°C for 30 s and 72°C for 45 s, and a final extension of 72°C for 10 min. In order to tag each PCR product (~750 bp) with a unique barcode sequence, each tagged primer was designed with 4 overhanging nucleotides at the 5′ ends of the common primers En771R and 27F. The adding reaction was performed with 5-cycle PCR with modified primers; each cycle was run at 94°C for 30 s, 55.7°C for 20 s, and 72°C for 45 s. In Acr2S1 and Acr3S2 samples, due to the lower yield of PCR products, 40 cycles were used at Stage 2 of PCR amplification, and 10 cycles at Stage 2 of tagging PCR.
Final tagging PCR products were pooled and sequenced in 2 independent Roche 454 GS junior with Titanium chemistry pyrosequencing runs at the Institute of Molecular Biology, Academia Sinica (Taipei, Taiwan). Overall, 404,337 raw reads were obtained from pyrosequencing. Reads with any ambiguous bases (N) or <380 bp were excluded. According to specific barcode sequences corresponding to each sample, the remaining reads were sorted using our in-house pipeline (http://140.109.29.21/trimmer/; http://140.109.29.21/sorter/) (9). Potential chimeras were identified by UCHIME (15) and Chimera Slayer (21) and removed. A total of 241,539 qualified sequencing reads from both ends of the amplicons of the 16S rRNA gene were obtained after quality trimming and chimera checking.
Amplification of the bacterial V1–V2 region using the bacterial universal primer, pyrosequencing, and data processing
In 8 coral Acropora samples and 1 seawater sample collected from Kochi, regions V1–V2 of the bacterial 16S rRNA gene were amplified by PCR using the bacterial universal primers 27F and 341R (5′-CTGCTGCCTCCCGTAGG-3′). DNA tagging PCR was used to fuse unique tags to each PCR product, which was conducted as described (2). Amplicons from the 9 Kochi samples were quantified and pooled in equal amounts. Multiplex sequencing was performed with a Roche 454 GS junior with Titanium chemistry - System (Roche 454 Life Sciences, Branford, CT, USA) at Mission Biotech (Taipei, Taiwan).
Raw sequencing reads were sorted into samples according to barcodes using an in-house sorter script (http://140.109.29.21/scripts/). After sorting and trimming with data from specific primers, high-quality reads were extracted using MOTHUR (52) with the following criteria: 1) read lengths between 280 and 350 bp; 2) average quality score >20; 3) homopolymer length <8 bp; and 4) removal of reads with any ambiguous base (N). Thereafter, the 4 nucleotide tags and primer sequences were removed. Chimeric reads were inspected and eliminated by UCHIME (15) with USEARCH v7.0.1090 (parameters: reference mode, rdp_gold database, and mindiv of 3). A total of 91,211 qualified sequences were retained for subsequent analyses.
Taxonomic identification of V1–V2 and V3–V4 region sequences for primer specificity
A total of 165,481 V1–V2 and 76,058 V3–V4 qualified sequences were obtained using the specific primer in PCR, whereas there were 91,211 qualified sequences obtained using the bacterial universal primer. Their taxa were identified using the Naïve Bayesian Classifier (v16) (57) of the Ribosomal Database Project (RDP, release no. 10.31), with a bootstrap value of 0.8. A bar chart of the bacterial composition from the specific primer was presented after discarding 276 and 507 unclassified sequences (No hit) in the V1–V2 and V3–V4 sequences, respectively.
In order to assess the specificity of our designed primer, unclassified sequences of Bacteria, Proteobacteria, Gammaproteobacteria, Oceanospirillales, and Hahellaceae in the histogram were further classified by searching against the SILVA and Greengenes databases (v128 and ver. gg_13_8_99) implemented in MOTHUR. Sequences annotated as Endozoicomonas in the RDP database or Endozoicimonaceae in the Greengenes database were selected for subsequent analyses.
Unique sequence profile, diversity index estimation, and rarefaction curve construction
The 13,693 V1–V2 and 3,633 V3–V4 distantly related Endozoicomonas sequences, defined by the Classifier of RDP (v16) and Greengenes database (gg_13_8_99) (36), were discarded. The remaining 151,788 V1–V2 and 72,425 V3–V4 sequences were subjected to further analyses.
In order to compare compositional variations in Endozoicomonas among samples on a finer scale, all remaining V1–V2 and V3–V4 sequencing reads affiliated with Endozoicomonas were aligned against the 28 aligned Endozoicomonas-related sequences downloaded from NCBI (accession numbers of sequences: HE818335.1, HE818343.1, AB695089.1, DQ917901.1, FJ347758.1, JX488685.1, JX488684.2, AB196667.1, JX152780.1, KC878324.1, DQ889929.1, DQ917830.1, DQ889931.1, DQ889906.1, DQ889891.1, DQ889911.1, DQ917896.1, DQ917887.1, FJ457274.1, AB205011.1, DQ917871.1, DQ917863.1, DQ917879.1, DQ917877.1 EU599216.4, AY130994.1, AB467280.1, and AB467279.1) using Nearest Alignment Space Termination (NAST) (11). Two V3–V4 reads in the alignment that lacked homologous sequences were removed. The qualified alignment was trimmed to a consistent length. A total of 51,934 V1–V2 and 28,349 V3–V4 unique reads were obtained after removing redundant identical sequences. The ratio of each unique sequence in each sample was calculated and profiled using R language (www.r-project.org). The ratio of each unique sequence in each sample was calculated by the read number of each unique sequence, divided by the total read number in each sample, and values were then transformed to a percentile.
Qualified multiple sequence alignments were used in subsequent analyses using the UPARSE pipeline (16), including the assessment of operational taxonomic units (OTUs) with a cut-off at 3% divergence at a species-like level, the composition of OTUs in each sample, and the estimation of indices for alpha diversity (i.e., values of richness, Shannon-Weaver index, Gini-Simpson index, and evenness). In UPARSE, de-replication was performed and singleton was included (options: –derep_prefix and –minsize 1). Alpha diversity was also present after rarefying to an even 500 sequence depth in each sample by USEARCH (v9.2; options: -otutab_norm).
Phylogenetic analysis of 16S rRNA gene sequences of Endozoicomonas and Spongiobacter
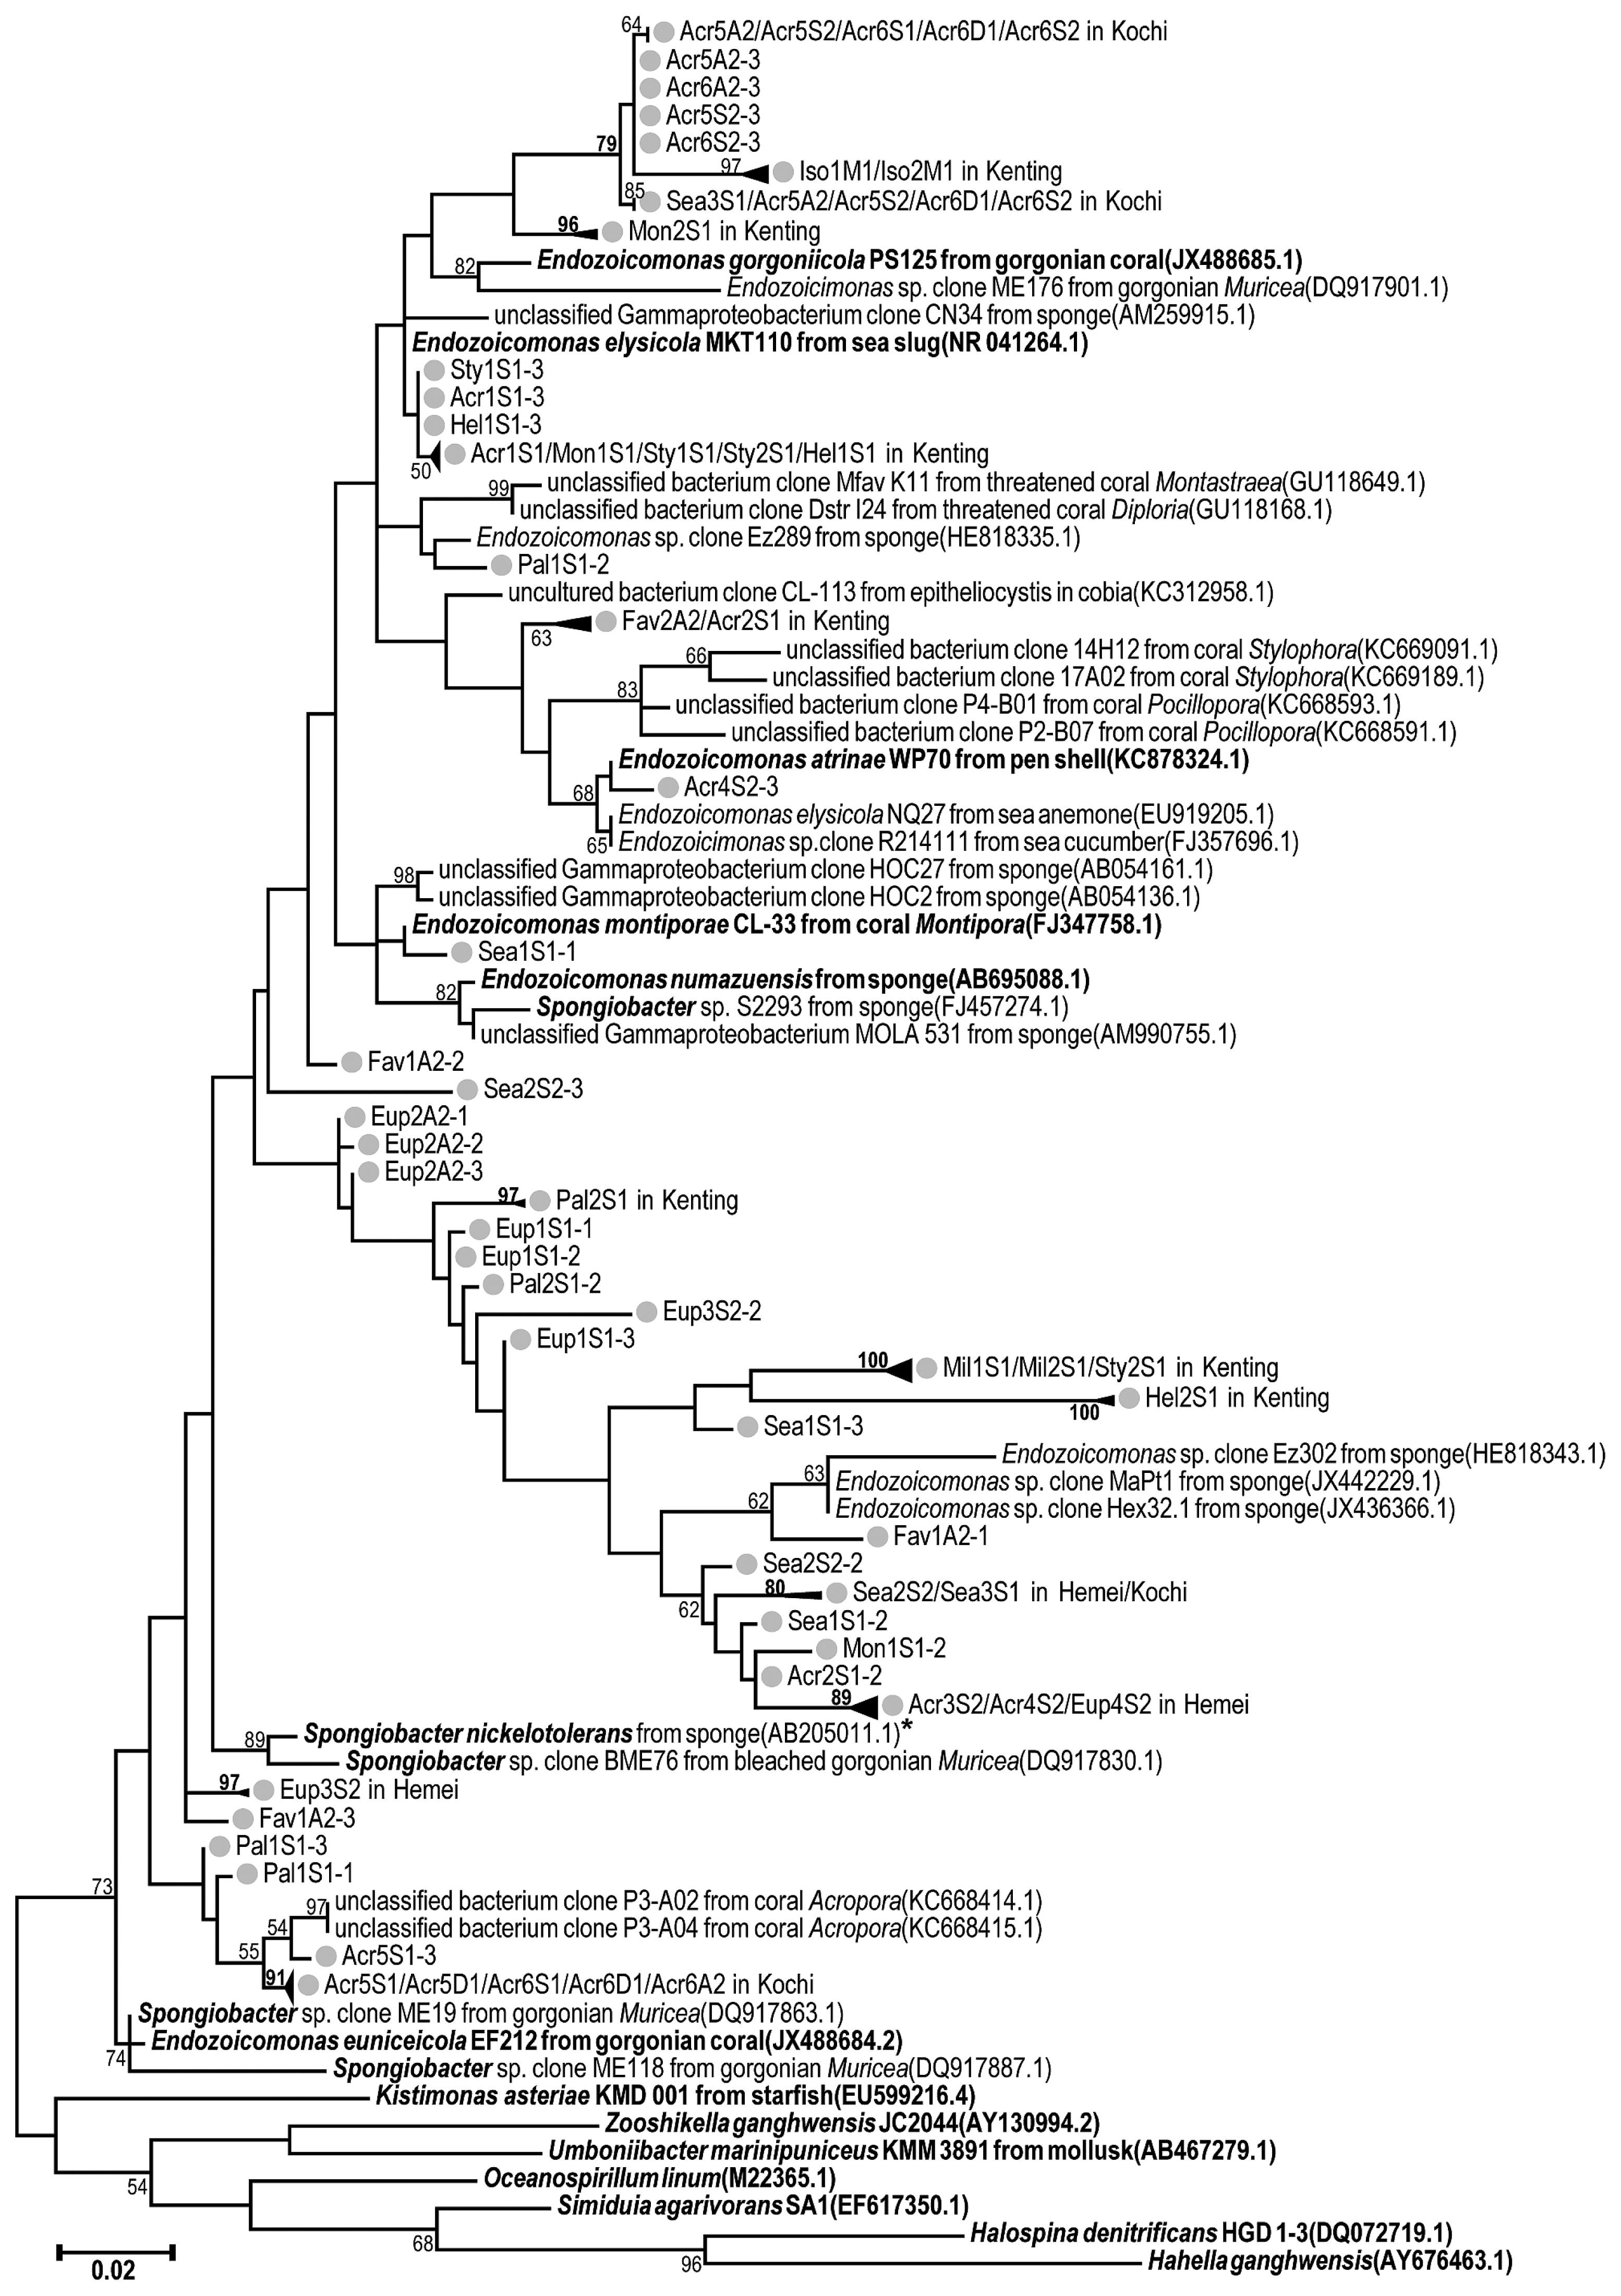
In the analysis of the phylogenetic relationships of unique Endozoicomonas sequences detected in samples, the phylogenetic tree included the top 3 most abundant unique sequences from each sample, and 31 reference sequences of the 16S rRNA genes of Spongiobacter and Endozoicomonas (downloaded from GenBank; accession numbers are listed in Fig. 1) were included. In addition, 7 reference sequences as outgroups in the phylogenetic tree downloaded from GenBank belonged to the family Hahellaceae (i.e., Kistimonas asteriae, Zooshikella ganghwensis, Halospina denitrificans, and Hahella ganghwensis), the order Oceanospirillales (i.e., Oceanospirillum linum), and unclassified Gamma-proteobacteria (i.e., Umboniibacter marinipuniceus and S. agarivorans), which are phylogenetically close to Endozoicomonas (48, 60).
The tree, based on the V1–V2 or V3–V4 datasets, was generated using the maximum-likelihood method with the Tamura-Nei model and 1,000 bootstrap replicates in MEGA 7 (29). All base positions containing gaps or missing data in the sequence alignment were discarded. A total of 305/415 informative sites in the alignment of V1–V2/V3–V4 data were available for the analysis in the phylogenetic tree.
Divergence among all 137 sequences in the tree was assessed by pairwise distance estimates of evolutionary divergence with a Kimura 2-parameter model in MEGA 7 (29), and performed as a boxplot using the R platform.
In order to examine the uncertain relationship between Endozoicomonas and Spongiobacter, 28 of the nearly full-length 16S rRNA gene sequences of both bacterial groups were downloaded from GenBank as representative sequences for a relation analysis (accession numbers of sequences: HE818335.1, HE818343.1, AB695089.1, DQ917901.1, FJ347758.1, JX488685.1, JX488684.2, AB196667.1, JX152780.1, KC878324.1 for Endozoicomonas group; DQ889929.1, DQ917830.1, DQ889931.1, DQ889906.1, DQ889891.1, DQ889911.1, DQ917896.1, DQ917887.1, FJ457274.1, AB205011.1, DQ917871.1, DQ917863.1, DQ917879.1, and DQ917877.1 for the Spongiobacter group; and EU599216.4, AY130994.1, AB467280.1, and AB467279.1 for the outgroup). The divergence of selected sequences was assessed by distance estimates of average evolutionary divergence with the Kimura 2-parameter model in MEGA 7. All base positions containing gaps or missing data in the sequence alignment were discarded; thereafter, 1,151 informative sites in the alignment were available for analysis.
Identification of V1–V2 amplicons from universal or specific primers for primer sensitivity
In order to assess the sensitivity of the Endozoicomonas-specific primer, the V1–V2 amplicon dataset from using specific primers in PCR was compared to the other V1–V2 amplicon dataset from using bacterial universal primers. In order to compare alpha diversity and the community composition of Endozoicomonas spp. in both datasets, Endozoicomonas sequences in the 9 Kochi samples from both datasets were combined into a single file, aligned using MOTHUR (52), and then assigned OTUs with a cut-off value at 97% identity by the UPARSE pipeline (16), as described above.
The alpha diversity and composition of Endozoicomonas OTUs in each Kochi sample were compared after rarefying to an even 2,496 sequence depth in each coral sample, based on the least number of sequences among Kochi coral samples, except the seawater sample in Kochi. After excluding singleton OTUs, the OTU composition in each Kochi sample from both datasets was presented in a bar chart, and the total number of Endozoicomonas OTUs in each dataset was also calculated.
Data accessibility
Multiplex sequenced reads (the bacterial 16S region) were deposited in the NCBI Sequence Read Archive under BioProject (PRJNA268432). Accession number: SUB755584 for V3–V4 sequences amplified by specific primers, SUB2807188 for V1–V2 sequences amplified by specific primers, and SUB2990890 for V1–V2 sequences amplified by universal primers.
Results
Specificity of matched and mismatched primers for detecting
Endozoicomonas The designed Endozoicomonas-specific reverse primer (771R) with 1 base mismatched (En771R: 5′-TCAGTGTC ARRCCTGAGTGT-3′) was compared to the reverse primer designed without mismatching (matched 771R: 5′-TCAGT GTCARRCCAGAGTGT-3′) by both being paired with the bacterial universal forward primer 27F in PCR (Fig. 2). We designed a one-base mismatched primer (En771R) to increase variations between the primer and sequences of S. agarivorans because there are 3 CAG repeats in the matched 771R primer and 4 CAG repeats in the region of S. agarivorans (Fig. 2a). We tested primer specificity and searched for a suitable annealing temperature by gradient PCR (range: 52.9 to 60.2°C).

Using the mismatched En771R primer, the specified region (~750 bp) in the 16S rRNA genes of E. elysicola and E. montiporae was amplified when the annealing temperature was 52.9–60.2°C, whereas there were no PCR products from cultivable S. agarivorans DNA (Fig. 2b). However, the 16S rRNA gene of S. agarivorans was amplified with the matched 771R primer under annealing temperatures from 52.9 to 57.1°C (red arrow in Fig. 2b). When the annealing temperature was increased to 60.2°C, there was no non-specific PCR product from S. agarivorans DNA using the matched primer or mismatched primer. However, the condition also yielded more non-specific 1-kb products (red arrow in Fig. 2b) from E. montiporae and E. elysicola DNA and a weak target band from coral Heliopora DNA, which had abundant E. elysicola close-relatives. Therefore, the mismatched primer (En771R) was selected for the subsequent primer test.
After the mismatched En771R was considered suitable for the detection of Endozoicomonas in subsequent experiments, we also paired this reverse primer with other forward primers (i.e., bacterial universal 341F or Endozoicomonas-specific forward primers that we designed) in order to amplify a shorter PCR product (<400 bp) for Roche 454 GS junior pyrosequencing in 2013. However, none of these combinations had better specificity and yield than the 27F/En771R primer pair (tests were performed with gradient PCR and electrophoresis; data not shown).
Specificity of designed primers for the detection of Endozoicomonas 16S rRNA genes
In order to examine the specificity and sensitivity of the primer pair 27F/En771R for detecting Endozoicomonas in coral samples, 30 coral samples that belonged to 9 genera and 3 seawater samples were collected from 3 locations (Table S1). The V1–V4 regions of 16S rRNA genes in Endozoicomonas species were amplified with the primer pair and amplified products were sequenced in a Roche 454 GS junior pyrosequencing. The qualified forward and reverse reads (380–550 bp) from pyrosequencing were shorter than the PCR products (~750 bp); therefore, we separately analyzed the forward and reverse reads (datasets for the V1–V2 and V3–V4 regions, respectively).
In order to estimate specificity, each qualified bacterial sequence in both datasets was classified. The V3–V4 region of 16S rRNA tag sequencing yielded 86.4% sequences (65,305/75,551 sequences) affiliated to the genus Endozoicomonas by the method Classifier of RDP (v16). Every sample had Endozoicomonas, and most were comprised of >80% Endozoicomonas sequences (Fig. 3). Notably, some coral samples had many unclassified sequences (grayscale bars and bold keys in Fig. 3), particularly samples from Hemei, Taiwan. A total of 13.1% of V3–V4 sequences (9,895/75,551 sequences) were assigned as unclassified Hahellaceae, Oceanospirillales, Gammaproteobacteria, Proteobacteria, or Bacteria in RDP.

Among the 9,895 unclassified sequences in all samples, approximately 59.5% (5,884/9,895 sequences) or 70.2% (6,948/9,895 sequences) were assigned to Endozoicomonas in the SILVA database (v.128) or to Endozoicimonaceae in the Greengene database (ver. gg_13_8_99). A total of 86.4 to 95.6% (65,305 plus 6,948 in all 75,551 sequences) of the qualified sequences among samples corresponded to Endozoicomonas-related species in the V3–V4 region dataset.
In the V1–V2 region dataset, 81.3% sequences (134,325/165,205 sequences) affiliated to the genus Endozoicomonas with the method Classifier of RDP v16 (Fig. 3), and there were 17.4% unclassified Hahellacea, Oceanospirillales, Gammaproteobacteria, Proteobacteria, and Bacteria sequences (28,813) detected in all samples. We further classified these 28,813 unclassified sequences against the SILVA or Greengenes database (v.128 and ver. gg_13_8_99); using various databases, approximately 38.7% (11,157/28,813) or 60.6% (17,463/28,813 sequences) were identified as Endozoicomonas or Endozoicimonaceae, respectively.
Collectively, approximately 91.9% (134,325 plus 17,463 in all 165,205 sequences; 151,788/165,205) of the qualified V1–V2 sequences and 95.6% (72,253/75,551 sequences) of the qualified V3–V4 sequences corresponded to Endozoicomonas-related species.
Sensitivity of designed primers for the detection of Endozoicomonas
In order to evaluate the sensitivity of the specific primer En771R, high variable V1–V2 sequences amplified from Endozoicomonas-specific primers (27F and En771R) were compared to V1–V2 sequences amplified from bacterial universal primers (27F and 341R). The V1–V2 sequences assigned as Endozoicomonas in 9 Kochi samples were selected for comparison. The number of sequences in each sample was rarefied to an even 2,496 sequence depth in each sample, which is the least number of sequences among all Kochi samples, except the seawater sample, in a universal primer dataset, and singleton OTUs were removed to prevent the overestimation of sensitivity. There were 159 Endozoicomonas OTUs, and the specific primer dataset had 138 Endozoicomonas OTUs, more than 103 Endozoicomonas OTUs in the universal primer data (Fig. 4 and Table 1). They shared 82 common OTUs between 2 datasets.

Table 1
Sequence information and diversity estimates, including singleton OTUs after rarefying to an even 2,496 sequence depth, of the
Endozoicomonas community in coral and seawater samples from Kochi, as represented in V1–V2 regions of the 16S rRNA gene, detected with bacterial universal primers (U) and
Endozoicomonas-specific primers (S).
| Sample |
Na |
OTUb |
Richnessc |
Gini-Simpson |
Shannon |
Evennessd |
| Primer |
U |
S |
U |
S |
C |
U |
S |
U |
S |
U |
S |
U |
S |
| Sea3S1 |
1 |
2509 |
1 |
88 |
0 |
N.D. |
0.416 |
N.D. |
0.774 |
N.D. |
2.20 |
N.D. |
0.491 |
| Acr6S1 |
2476 |
2500 |
53 |
69 |
29 |
0.407 |
0.643 |
0.863 |
0.843 |
2.28 |
2.16 |
0.575 |
0.509 |
| Acr5S1 |
2474 |
2502 |
62 |
54 |
28 |
0.270 |
0.436 |
0.819 |
0.858 |
2.35 |
2.34 |
0.570 |
0.586 |
| Acr6D1 |
2490 |
2498 |
71 |
56 |
37 |
0.514 |
0.509 |
0.816 |
0.827 |
2.27 |
2.12 |
0.531 |
0.526 |
| Acr5D1 |
2480 |
2506 |
71 |
73 |
38 |
0.361 |
0.486 |
0.879 |
0.844 |
2.53 |
2.31 |
0.593 |
0.539 |
| Acr6A2 |
2485 |
2500 |
57 |
60 |
36 |
0.362 |
0.492 |
0.796 |
0.841 |
2.12 |
2.14 |
0.525 |
0.523 |
| Acr5A2 |
2480 |
2496 |
59 |
47 |
28 |
0.467 |
0.542 |
0.447 |
0.290 |
1.35 |
0.88 |
0.331 |
0.228 |
| Acr6S2 |
2491 |
2500 |
53 |
58 |
31 |
0.370 |
0.492 |
0.460 |
0.397 |
1.37 |
1.14 |
0.346 |
0.282 |
| Acr5S2 |
2484 |
2501 |
49 |
46 |
29 |
0.320 |
0.340 |
0.377 |
0.398 |
1.15 |
1.16 |
0.295 |
0.304 |
|
| Total |
– |
– |
103 |
138 |
82 |
– |
– |
– |
– |
– |
– |
– |
– |
U=Bacterial universal primers; S=Endozocomonas-specific primers; C=Common OTUs shared between U and S data.
N.D.=undetectable in samples.
a N defined as the number of sequences.
b Calculations were based on operational taxonomic units (OTUs) formed at an evolutionary distance of <0.03 (or approximately 97% similarity).
There were total 159 OTUs.
c Calculated as S/(N+1) where S is the number of singleton OTUs and N is the total number of OTUs.
d Shannon index divided by the logarithm of the number of OTUs
Based on common abundant OTUs, OTU compositions in samples were similar between primer sets (Fig. 4), as were the alpha diversities, estimated including singleton OTUs, of each sample between 2 datasets (Table 1). Notably, only 1 sequence in seawater was classified as Endozoicomonas when using the universal primer. In contrast, when using the specific primer, there were more Endozoicomonas sequences, with 88 OTUs detected in the seawater sample (that included singleton OTUs after rarefying), even more than those in coral samples.
Diversity of the Endozoicomonas community in corals and seawater categorized with specific primers
In order to use our newly designed specific primer En771R paired with the 27F primer to characterize the composition of the Endozoicomonas community in corals from various sources, the alpha and beta diversities of Endozoicomonas in coral and seawater samples were estimated based on V1–V2 and V3–V4 sequences in the specific primer dataset. The alpha diversity, including the Shannon index, Gini-Simpson index, and evenness, of coral samples was lower than that of seawater samples (Table 2). For example, the Shannon index of Endozoicomonas was higher in seawater samples (2.34 to 3.31), but lower in coral samples (range 0.08 to 2.61, with most <2.0). In coral, diversities were also variable among samples. For example, samples of Favia (Fav1A1 and Fav1A2) and Palythoa (PalS1 and PalS2) from Kenting had more OTUs than others, whereas Millepora samples (Mil1S1 and Mil2S1) from Kenting had lower values.
Table 2
Sequence information and diversity estimates using our newly designed
Endozoicomonas-specific primers in V1–V2 and V3–V4 regions of the 16S rRNA gene.
| Sample |
Na |
OTUb |
Gini-Simpson |
Shannon |
Evennessc |
| Primer |
V1V2 |
V3V4 |
V1V2 |
V3V4 |
V1V2 |
V3V4 |
V1V2 |
V3V4 |
V1V2 |
V3V4 |
| Mil1S1 |
5094 |
2132 |
21 |
11 |
0.11 |
0.03 |
0.26 |
0.10 |
0.08 |
0.04 |
| Mil2S1 |
5626 |
2664 |
36 |
19 |
0.04 |
0.03 |
0.15 |
0.12 |
0.04 |
0.04 |
| Hel1S1 |
8829 |
4336 |
56 |
27 |
0.10 |
0.04 |
0.31 |
0.14 |
0.08 |
0.04 |
| Hel2S1 |
701 |
405 |
30 |
29 |
0.72 |
0.75 |
1.95 |
2.05 |
0.57 |
0.61 |
| Pal1S1 |
4129 |
4917 |
81 |
47 |
0.85 |
0.72 |
2.43 |
1.56 |
0.55 |
0.41 |
| Pal2S1 |
7428 |
4723 |
69 |
43 |
0.41 |
0.26 |
1.15 |
0.76 |
0.27 |
0.20 |
| Sty1S1 |
4197 |
2220 |
32 |
17 |
0.13 |
0.12 |
0.37 |
0.35 |
0.11 |
0.12 |
| Sty2S1 |
189 |
78 |
9 |
9 |
0.40 |
0.62 |
0.83 |
1.38 |
0.38 |
0.63 |
| Fav1A2 |
2205 |
2507 |
63 |
39 |
0.68 |
0.82 |
1.90 |
2.21 |
0.46 |
0.60 |
| Fav2A2 |
4298 |
2220 |
82 |
51 |
0.85 |
0.83 |
2.35 |
2.31 |
0.53 |
0.59 |
| Iso1M1 |
5543 |
2663 |
43 |
22 |
0.23 |
0.03 |
0.59 |
0.11 |
0.16 |
0.04 |
| Iso2M1 |
7881 |
4618 |
49 |
21 |
0.51 |
0.03 |
1.04 |
0.13 |
0.27 |
0.04 |
| Acr1S1 |
8286 |
5155 |
33 |
14 |
0.07 |
0.02 |
0.22 |
0.08 |
0.06 |
0.03 |
| Acr2S1 |
8092 |
4336 |
74 |
38 |
0.82 |
0.50 |
2.07 |
0.95 |
0.48 |
0.26 |
| Mon1S1 |
4779 |
3055 |
54 |
35 |
0.42 |
0.55 |
1.16 |
1.27 |
0.29 |
0.36 |
| Mon2S1 |
5276 |
3874 |
76 |
33 |
0.20 |
0.55 |
0.70 |
1.14 |
0.16 |
0.33 |
| Eup1S1 |
7706 |
4426 |
64 |
39 |
0.69 |
0.78 |
1.57 |
1.82 |
0.38 |
0.50 |
| Eup2A2 |
6630 |
3454 |
45 |
25 |
0.78 |
0.52 |
1.86 |
1.08 |
0.49 |
0.34 |
| Acr3S2 |
2840 |
1415 |
38 |
25 |
0.65 |
0.66 |
1.73 |
1.43 |
0.48 |
0.44 |
| Acr4S2 |
824 |
207 |
20 |
10 |
0.64 |
0.69 |
1.36 |
1.46 |
0.45 |
0.64 |
| Eup3S2 |
1896 |
325 |
62 |
25 |
0.47 |
0.64 |
1.36 |
1.76 |
0.33 |
0.55 |
| Eup4S2 |
1964 |
725 |
15 |
9 |
0.24 |
0.49 |
0.62 |
0.77 |
0.23 |
0.35 |
| Acr5S1 |
2435 |
565 |
54 |
14 |
0.88 |
0.57 |
2.61 |
1.30 |
0.65 |
0.49 |
| Acr6S1 |
3091 |
654 |
46 |
16 |
0.84 |
0.40 |
2.14 |
0.96 |
0.56 |
0.35 |
| Acr5D1 |
2890 |
725 |
59 |
16 |
0.84 |
0.20 |
2.31 |
0.56 |
0.57 |
0.20 |
| Acr6D1 |
2749 |
570 |
44 |
13 |
0.83 |
0.53 |
2.13 |
1.06 |
0.56 |
0.41 |
| Acr5A2 |
2473 |
1585 |
43 |
16 |
0.39 |
0.38 |
0.83 |
0.88 |
0.22 |
0.32 |
| Acr6A2 |
2609 |
455 |
45 |
11 |
0.84 |
0.41 |
2.11 |
0.90 |
0.56 |
0.37 |
| Acr5S2 |
2705 |
419 |
40 |
8 |
0.46 |
0.51 |
1.13 |
1.10 |
0.31 |
0.53 |
| Acr6S2 |
3090 |
527 |
38 |
12 |
0.52 |
0.48 |
1.21 |
1.05 |
0.33 |
0.42 |
| Sea1S1 |
1288 |
860 |
98 |
71 |
0.94 |
0.94 |
3.27 |
3.24 |
0.71 |
0.76 |
| Sea2S2 |
666 |
451 |
60 |
61 |
0.94 |
0.93 |
3.20 |
3.31 |
0.78 |
0.81 |
| Sea3S1 |
2909 |
1916 |
88 |
73 |
0.81 |
0.88 |
2.34 |
2.77 |
0.52 |
0.65 |
The highest values in each column are in bold.
a N defined as the number of sequences.
b Operational taxonomic units (OTUs) formed at an evolutionary distance of <0.03 (or approximately97% similarity).
c Shannon index divided by the logarithm of the number of OTUs
Since there were only a few samples with a lower number of sequences (<500), diversity indices were rarefied to a 500 sequence depth (Table S3). Although the number of OTUs and values of richness, evenness, and diversity decreased after rarefying, comparative results of these values did not change among samples.
In order to detect the beta diversity of Endozoicomonas at the subtype level and prevent overlooking finer scale variations among samples, the unique sequence profiles of Endozoicomonas were analyzed (Fig. 5). Each unique sequence was comprised of identical sequences only as a proxy for a subtype. In the V3–V4 dataset (Fig. 5b), the proportions of the most abundant unique sequences in each coral sample ranged between 6.3 and 46.4%, whereas these proportions were all <5.0% in the 3 seawater samples. There was a similar pattern in the V1–V2 dataset (Fig. 5a), except for seawater samples from Kochi (Sea3S1).

Furthermore, the Endozoicomonas-subtype signatures of coral samples differed from those of seawater samples derived from the same location. Most of the profiles of 2 biological repeats of coral samples were similar and had the same highest unique sequences. Variations among coral samples were generally discernible, and resulted from differences among samples for the most abundant subtypes.
Phylogenetic distance of Endozoicomonas and its related species when using the specific primers
In order to comprehend the phylogenetic analysis of the dominant 16S rRNA gene sequences of Endozoicomonas, the top 3 abundant unique sequences from each sample and 31 reference sequences of the 16S rRNA gene of Spongiobacter and Endozoicomonas and 7 outgroup sequences (downloaded from GenBank; accession numbers are listed in Fig. 1) were included.
Endozoicomonas-related sequences were highly diverse and demonstrated divergence, particularly in the V3–V4 region (Fig. 6). Pairwise distances among Endozoicomonasor Spongiobacter-related sequences ranged between 0 and 0.155 nucleotide substitutions per site in V3–V4 data (Fig. 6b), which were higher than those in V1–V2 data (from 0 to 0.134 nucleotide substitutions per site; Fig. 6a), whereas distances among 7 outgroup sequences, which belonged to the Hahellaceae family (K. asteriae, Z. ganghwensis, H. denitrificans, and H. ganghwensis), Oceanospirillales order (O. linum), and even unclassified Gamma-proteobacteria (S. agarivorans and U. marinipuniceus), ranged between 0.087 and only 0.167 nucleotide substitutions per site in V3–V4 data (Fig. 6b). All 3 medians of pairwise distances in the Endozoicomonas group were >0.05 nucleotide substitutions per site (at the genus level) in V3–V4 data (Fig. 6b), even though many pairwise distances were 0 nucleotide substitutions per site between sequences in the Endozoicomonas group. In contrast, the 3 medians of the pairwise distance in Endozoicomonas were <0.05 nucleotide substitutions per site in V1–V2 data (Fig. 6a). In V1–V2 and V3–V4 data, many values of pairwise distances in the Endozoicomonas group were >0.1 nucleotide substitutions per site, consistent with variations in the order level.

In order to estimate the phylogenetic diversity of Endozoicomonas in coral samples, the V3–V4 region had better resolution than the V1–V2 region for the phylogenetic analysis at the genus level (Fig. 1 and S4). The 7 outgroup sequences in the phylogenetic tree based on V1–V2 data were mixed with Endozoicomonas sequences (Fig. S4), whereas outgroup sequences were clearly separated from Endozoicomonas and Spongiobacter sequences in a phylogenetic tree constructed from the V3–V4 region (Fig. 1). Therefore, we selected only the V3–V4 region in subsequent phylogenetic analyses. Many Endozoicomonas species detected in the present study were novel clades from sequences in public databases (Fig. 1). For example, all of the top 3 abundant Endozoicomonas sequences from Millepora in Kenting had a high bootstrap value (100) as a new group in a phylogeny tree. In addition, there were at least 9 new Endozoicomonas clades, with a bootstrap value >70 (marked as bold in Fig. 1), detected by our newly designed primers.
Despite the unusually high variation within the Endozoicomonas group, including Spongiobacter (Fig. 6), Spongiobacter and Endozoicomonas were highly related in the phylogenetic tree (Fig. 1). The high bootstrap value (73) supported branching of the clade of Endozoicomonas/ Spongiobacter from the other outgroup genera, such as Kistimonas and Zooshikella (that belonged to the same family of Hahellaceae). In order to clarify the relationship between Endozoicomonas and Spongiobacter, 28 nearly full-length 16S rRNA genes (1,151 informative sites in total) of Endozoicomonas and Spongiobacter were compared using phylogenetic distances to estimate divergence among sequences. Average distances within the Endozoicomonas or Spongiobacter groups were 0.049 (SE=0.004) and 0.036 (SE=0.003), respectively. Similarly, the average distance between Endozoicomonas and Spongiobacter was 0.048 (SE=0.003). In contrast, average distances between Endozoicomonas or Spongiobacter and other members from Hahellaceae (Kistimonas and Zooshikella) or a closely related sequence (Umboniibacter) were markedly higher at 0.087 and 0.092 (SEs=0.006 and 0.007). Hence, the distance between Endozoicomonas and Spongiobacter was markedly smaller than other genera in the family Hahellaceae.
Discussion
The newly designed primer was highly specific for the detection of Endozoicomonas
We successfully designed what is apparently the first specific primer for the detection of Endozoicomonas for a community study and used it to measure changes in the Endozoicomonas community in corals and seawater (in which Endozoicomonas were very rare; Fig. S3) (3, 26). This primer was highly accurate in the V3–V4 region (95.6%) and specific for the detection of Endozoicomonas. The lower specificity in the V1–V2 region (91.9%) may have been due to less discrimination for identifying bacterial taxonomy at a genus level using the V1–V2 region than the V3–V4 region (Fig. 1 and S4), and the lack of an informative V1–V2 region in Endozoicomonas reference sequences in the database. Therefore, we recommend using the V3–4 region of specific primer-amplified 16S rDNA due to its high accuracy and specificity, making it more suitable for interpreting the community of Endozoicomonas.
The newly designed primer was sensitive for the detection of Endozoicomonas
Primer sensitivity was assessed by comparisons with the universal primer in the V1–V2 region, and was also evident in the V3–V4 region based on the high divergence between the detected sequences of Endozoicomonas (Fig. 6) and new clades of Endozoicomonas identified (Fig. 1). In the V1–V2 datasets, specific primer data had similar numbers of Endozoicomonas OTUs with data from the universal primer in each sample (Fig. 4 and Table 1). Among all 9 samples, PCR with the specific primer detected more Endozoicomonas OTUs than that with the universal primer, but there were 21 Endozoicomonas OTUs detected only by the universal primer. The plausible reason for the undetectable by using the specific primer may result from the limited sequencing size from 2,496 to 3,330 sequences before rarefying (Table S5), but there are more than twice as the sequences (from 6,538 to 13,066) of samples detected using the universal primer. After rarefying all the samples down to 2,496 reads, those 21 OTUs detected only by the universal primer were represented by only 1 read for each OTU, which could be selected by chance and should be very low abundant in the samples.
However, more OTUs (56>21 OTUs) could be detected only by the specific primer after rarefying when the relative abundance of Endozoicomonas OTUs were low (Table 1, Fig. S5, and Sea3S1 sample in Fig. S3). In short, the sensitivity of the Endozoicomonas-specific primer for detecting Endozoicomonas was higher than that of the bacterial universal primer, especially for rare Endozoicomonas OTUs.
In analyses of the V3–V4 region, higher richness and diverse populations of Endozoicomonas in seawater than in coral sample were also detected (Table 2 and S3). Endozoicomonas in seawater was rare (3, 26) and barely detected using bacterial universal primers due to limitation of sequencing size and PCR bias. Furthermore, many Endozoicomonas species detected in the present study were novel clades (compared to sequences in public databases; Fig. 1). For example, the top 3 abundant Endozoicomonas sequences from Millepora in Kenting had a high bootstrap value as a new and monophyletic group in a phylogeny tree. In addition, our newly designed primers detected at least 9 new Endozoicomonas clades, with a bootstrap value >70. Moreover, sequences phylogenetically close to the representative cultivable species, E. elysicola, E. montiporae, E. atrinae, E. gorgonicola, and E. eunicicola, were all detected in our samples, suggesting a good detection range for the specific primer. Furthermore, the highly phylogenetic divergence of Endozoicomonas spp. was detected using our designed primer, in which the pairwise distances between Endozoicomonas sequences may be >0.1 nucleotide substitutions per site as the variation in order level (Fig. 6). The newly designed primer was very useful and has considerable potential to characterize the composition, diversity, dynamics, and location of Endozoicomonas in host cells.
The V3–V4 region was superior to the V1–V2 region for a phylogenetic analysis of Endozoicomonas
The V1–V2 region had lower within-group distances of Endozoicomonas than the V3–V4 region (Fig. 6), whereas mean distances between Endozoicomonas and outgroup sequences were also lower in the V1–2 region than in the V3–V4 region (Table S4). This may account for the high bootstrap value, i.e., 73, which supported a clade of Endozoicomonas and Spongiobacter away from other outgroup sequences in the V3–V4 region-based phylogenetic tree (Fig. 1), but not in the V1–V2 based phylogenetic tree (Fig. S4), despite higher divergence in the V3–V4 region than in the V1–V2 region from 16S rRNA in Endozoicomonas. In a previous study, the V3–V4 region was also reported to have better resolution for bacterial taxa identification, particularly at the genus level, and was also recommended for analyzing bacterial communities with either single-read or paired-end strategies (38). Therefore, we inferred that the V3–V4 region was superior to the V1–V2 region in 16S rRNA sequences for the phylogenetic analysis of Endozoicomonas.
The host-associated lifestyle was more selective, but favorable for some Endozoicomonas sp
Our study appears to be the first to report a high level of Endozoicomonas diversity in seawater. The diversity of Endozoicomonas bacteria in corals was lower than that in seawater (Table 1 and S3), suggesting that environments in corals were more selective to Endozoicomonas than those in seawater. However, in previous studies, bacteria of the genus Endozoicomonas were identified at markedly higher relative abundance in corals than in seawater (3, 26) and the density of bacteria in corals was commonly 2.8- to 4.3-fold higher than that in seawater (18). Therefore, a part of Endozoicomonas bacteria may prefer to live in corals than in seawater.
Combining the results of the higher species diversity, but lower abundance of Endozoicomonas in seawater than in coral (Table 2 and Fig. 5), seawater from the nearby reef may have been a relatively neutral environment (compared to host association) for Endozoicomonas. In contrast, the host-associated environment for Endozoicomonas was more selective, but more favorable for partial populations of Endozoicomonas, in which the diversity of Endozoicomonas species was low and the relative abundance of dominant species increased in coral samples. Thus, our results also supported the hypothesis that Endozoicomonas preferred a host-associated lifestyle (12).
Diverse relationships of Endozoicomonas and corals
The high variation among Endozoicomonas-related sequences in databases may have been due to differences in experimental procedures or strategies among studies. Nevertheless, variations in Endozoicomonas sequences from this study had an unusual level of diversity and divergence (Fig. 1 and 6). Based on the phylogenetic diversity and different host specificity of Endozoicomonas in the present study, we inferred that interactions between these bacteria and their coral hosts were diverse and complex. Previous studies indicated that bacteria were only present or abundant in healthy corals (6, 20, 37). However, other studies showed that Endozoicomonas bacteria were also dominant in unhealthy corals, such as those with white patch syndrome in Porites (54) and in water with eutrophication and overfishing (26). Based on these inventory studies, difficulties were associated with interpreting the role of these bacteria in corals. Nevertheless, based on a fluorescence in situ hybridization (FISH) analysis, Endozoicomonas bacteria gathered close to symbiotic algae in the endodermal tissues of Stylophora pistillata in the Red Sea, suggesting that these bacteria have specific habitats inside corals (4). Notably, some Spongiobacter bacteria were able to consume dimethylsulfoniopropionate (DMSP) produced by the symbiotic algae of corals (7, 44) that indirectly supported these bacteria detected close to the algae inside corals. However, many Endozoicomonas bacteria have been detected in the mucus layer of healthy corals (20, 33, 37, 39, 55), indicating that these bacteria have a broad habitat range with corals. Hence, the habitat variations of Endozoicomonas may be more profound than expected.
A proposal to combine Spongiobacter and Endozoicomonas into a single taxon
Since the phylogenetic distance between the 2 genera (0.048 nucleotide substitutions per site) was smaller than that within the same genus (0.049 nucleotide substitutions per site), we propose to combine Spongiobacter and Endozoicomonas into a single taxon. The genus Spongiobacter was first proposed by Nishijima et al. in 2005 (unpublished), who described a nickel-tolerant bacterial isolate in a marine sponge. However, the genus name was not formally registered as a taxon. Nevertheless, with the publication of more marine invertebrate-associated microbial community surveys, several 16S rDNA sequences annotated as “Spongiobacter sp.” (based on the blast result in NCBI) were highly similar to Endozoicomonas species (61). Since the genus Spongiobacter lacked any specific description and no isolates were available in the authorized collection institutes, as well as a lack of evidence that distinguished this genus from Endozoicomonas, we proposed that Spongiobacter and Endozoicomonas be combined into the single genus Endozoicomonas. Furthermore, we may even consider Endozoicimonaceae or Endozoicimonaceae to be a new family (26, 13) due to the high divergence of this group (Fig. 1 and 6). In our view, unifying the nomenclature is critically important, particularly to facilitate phylogenetic diversity studies.
Conclusions
Using a newly-designed specific primer, we detected the Endozoicomonas community in coral samples from various sources, different coral species, across divergent locations and at various times. The sensitivity and specificity of the specific primer were clearly evident. Many new Endozoicomonas 16S rDNA ribotypes and Endozoicomonas bacteria widely dispersed in all coral and seawater samples were detected. Based on lower diversity than seawater and only a few dominant ribotypes detected in each coral sample, we suggested that environments in corals were more selective to these bacteria than those in seawater. These dominant Endozoicomonas populations were highly variable; therefore, we infer that the Endozoicomonas community is highly diverse. Hence, searching for a consistent relationship between corals and Endozoicomonas appeared to be simplistic and perhaps inappropriate. Nevertheless, a comprehensive list of members in the genus Endozoicomonas will be important for identifying the co-occurrence of particular ribotypes of Endozoicomonas and coral species. Fortunately, we are optimistic that our new method will facilitate these studies. Our designed primer may also be used as a FISH probe to localize Endozoicomonas inside host cells.
Acknowledgements
This work was financially supported by the Ministry of Science and Technology of Taiwan (Grant MOST 101-2628-B-001-001-MY3) and Academia Sinica (AS-100-TP2-A02-3) of Taiwan. We thank the Microarray Core Facility at the Institute of Molecular Biology of Academia Sinica for performing Roche 454 GS junior pyrosequencing. Coral samples from Kochi were collected by the Biological Institute of Kuroshio. Dr. Sung-Yin Yang helped to identify (based on morphology) the genus Palythoa in Zoantharia.
References
- 1. Ainsworth, T.D., L. Krause, T. Bridge, et al. 2015. The coral core microbiome identifies rare bacterial taxa as ubiquitous endosymbionts. ISME J. 9:2261-2274.
- 2. Baatar, B., P.W. Chiang, D.Y. Rogozin, Y.T. Wu, C.H. Tseng, C.Y. Yang, H.H. Chiu, B. Oyuntsetseg, A.G. Degermendzhy, and S.L. Tang. 2016. Bacterial Communities of three saline meromictic lakes in central Asia. PLoS One. 11:e0150847.
- 3. Bayer, T., C. Arif, C. Ferrier-Pages, D. Zoccola, M. Aranda, and C.R. Voolstra. 2013. Bacteria of the genus Endozoicomonas dominate the microbiome of the Mediterranean gorgonian coral Eunicella cavolini. Mar Ecol Prog Ser. 479:75-84.
- 4. Bayer, T., M.J. Neave, A. Alsheikh-Hussain, M. Aranda, L.K. Yum, T. Mincer, K. Hughen, A. Apprill, and C.R. Voolstra. 2013. The microbiome of the Red Sea coral Stylophora pistillata is dominated by tissue-associated Endozoicomonas bacteria. Appl Environ Microbiol. 79:4759-4762.
- 5. Bourne, D.G., and C.B. Munn. 2005. Diversity of bacteria associated with the coral Pocillopora damicornis from the Great Barrier Reef. Environ Microbiol. 7:1162-1174.
- 6. Bourne, D.G., Y. Iida, S. Uthicke, and C. Smith-Keune. 2008. Changes in coral-associated microbial communities during a bleaching event. ISME J. 2:350-363.
- 7. Bourne, D.G., P.G. Dennis, S. Uthicke, R.M. Soo, G.W. Tyson, and N. Webster. 2013. Coral reef invertebrate microbiomes correlate with the presence of photosymbionts. ISME J. 7:1452-1458.
- 8. Bourne, D.G., K.M. Morrow, and N.S. Webster. 2016. Insights into the coral microbiome: underpinning the health and resilience of reef ecosystems. Annu Rev Microbiol. 70:317-340.
- 9. Chen, C.P., C.H. Tseng, C.A. Chen, and S.L. Tang. 2011. The dynamics of microbial partnerships in the coral Isopora palifera. ISME J. 5:728-740.
- 10. Correa, H., B. Haltli, C. Duque, and R. Kerr. 2013. Bacterial communities of the gorgonian octocoral Pseudopterogorgia elisabethae. Microb Ecol. 66:972-985.
- 11. DeSantis, T.Z., P. Hugenholtz, K. Keller, E.L. Brodie, N. Larsen, Y.M. Piceno, R. Phan, and G.L. Andersen. 2006. NAST: a multiple sequence alignment server for comparative analysis of 16S rRNA genes. Nucleic Acids Res. 34:W394-W399.
- 12. Ding, J.Y., J.H. Shiu, W.M. Chen, Y.R. Chiang, and S.L. Tang. 2016. Genomic insight into the host-endosymbiont relationship of Endozoicomonas montiporae Cl-33(T) with its coral host. Front Microbiol. 7:251.
- 13. Dishaw, L.J., J. Flores-Torres, S. Lax, et al. 2014. The gut of geographically disparate Ciona intestinalis harbors a core microbiota. PLoS One. 9:e93386.
- 14. Du, Z.J., W.Y. Zhang, H.J. Xia, G.Q. Lu, and G.J. Chen. 2010. Isolation and diversity analysis of heterotrophic bacteria associated with sea anemones. Acta Oceanol Sin. 29:62-69.
- 15. Edgar, R.C., B.J. Haas, J.C. Clemente, C. Quince, and R. Knight. 2011. UCHIME improves sensitivity and speed of chimera detection. Bioinformatics. 27:2194-2200.
- 16. Edgar, R.C. 2013. UPARSE: highly accurate OTU sequences from microbial amplicon reads. Nat Methods. 10:996-998.
- 17. Folmer, O., M. Black, W. Hoeh, R. Lutz, and R. Vrijenhoek. 1994. DNA primers for amplification of mitochondrial cytochrome c oxidase subunit I from diverse metazoan invertebrates. Mol Mar Biol Biotechnol. 3:294-299.
- 18. Garren, M., and F. Azam. 2010. New method for counting bacteria associated with coral mucus. Appl Environ Microbiol. 76:6128-6133.
- 19. Garren, M., and F. Azam. 2012. New directions in coral reef microbial ecology. Environ Microbiol. 14:833-844.
- 20. Glasl, B., G.J. Herndl, and P.R. Frade. 2016. The microbiome of coral surface mucus has a key role in mediating holobiont health and survival upon disturbance. ISME J. 10:2280-2292.
- 21. Haas, B.J., D. Gevers, A.M. Earl, et al. 2011. Chimeric 16S rRNA sequence formation and detection in Sanger and 454-pyrosequenced PCR amplicons. Genome Res. 21:494-504.
- 22. Hansson, L., M. Agis, C. Maier, and M.G. Weinbauer. 2009. Community composition of bacteria associated with cold-water coral Madrepora oculata: within and between colony variability. Mar Ecol Prog Ser. 397:89-102.
- 23. Hong, M.J., Y.T. Yu, C.A. Chen, P.W. Chiang, and S.L. Tang. 2009. Influence of species specificity and other factors on bacteria associated with the coral Stylophora pistillata in Taiwan. Appl Environ Microbiol. 75:7797-7806.
- 24. Hsu, C.M., S. de Palmas, C.Y. Kuo, V. Denis, and C.A. Chen. 2014. Identification of Scleractinian coral recruits using fluorescent censusing and DNA barcoding techniques. PLoS One. 9:e107366.
- 25. Hyun, D.W., N.R. Shin, M.S. Kim, S.J. Oh, P.S. Kim, T.W. Whon, and J.W. Bae. 2014. Endozoicomonas atrinae sp. nov., isolated from the intestine of a comb pen shell Atrina pectinata. Int J Syst Evol Microbiol. 64:2312-2318.
- 26. Jessen, C., J.F.V. Lizcano, T. Bayer, C. Roder, M. Aranda, C. Wild, and C.R. Voolstra. 2013. In-situ effects of eutrophication and overfishing on physiology and bacterial diversity of the Red Sea coral Acropora hemprichii. PLoS One. 8:e62091.
- 27. Jensen, S., S. Duperron, N.K. Birkeland, and M. Hovland. 2010. Intracellular Oceanospirillales bacteria inhabit gills of Acesta bivalves. FEMS Microbiol Ecol. 74:523-533.
- 28. Krediet, C.J., K.B. Ritchie, V.J. Paul, and M. Teplitski. 2013. Coral-associated micro-organisms and their roles in promoting coral health and thwarting diseases. Proc R Soc B. 280:20122328.
- 29. Kumar, S., G. Stecher, and K. Tamura. 2016. MEGA7: Molecular evolutionary genetics analysis version 7.0 for bigger datasets. Mol Biol Evol. 33:1870-1874.
- 30. Kurahashi, M., and A. Yokota. 2007. Endozoicomonas elysicola gen. nov., sp. nov., a gamma-proteobacterium isolated from the sea slug Elysia ornata. Syst Appl Microbiol. 30:202-206.
- 31. Kvennefors, E.C.E., E.M. Sampayo, T. Ridgway, A.C. Barnes, and O. Hoegh-Guldberg. 2010. Bacterial communities of two ubiquitous Great Barrier Reef corals reveals both site- and species-specificity of common bacterial associates. PLoS One. 5:e10401.
- 32. La Riviére, M., M. Roumagnac, J. Garrabou, and M. Bally. 2013. Transient shifts in bacterial communities associated with the temperate gorgonian Paramuricea clavata in the Northwestern Mediterranean Sea. PLoS One. 8:e57385.
- 33. Lee, S.T.M., S.K. Davy, S.L. Tang, T.Y. Fan, and P.S. Kench. 2015. Successive shifts in the microbial community of the surface mucus layer and tissues of the coral Acropora muricata under thermal stress. FEMS Microbiol Ecol. 91:12.
- 34. Lema, K.A., B.L. Willis, and D.G. Bourne. 2014. Amplicon pyrosequencing reveals spatial and temporal consistency in diazotroph assemblages of the Acropora millepora microbiome. Environ Microbiol. 10:3345-3359.
- 35. Littman, R.A., B.L. Willis, C. Pfeffer, and D.G. Bourne. 2009. Diversities of coral-associated bacteria differ with location, but not species, for three acroporid corals on the Great Barrier Reef. FEMS Microbiol Ecol. 68:152-163.
- 36. McDonald, D., M.N. Price, J. Goodrich, E.P. Nawrocki, T.Z. DeSantis, A. Probst, G.L. Andersen, R. Knight, and P. Hugenholtz. 2012. An improved Greengenes taxonomy with explicit ranks for ecological and evolutionary analyses of bacteria and archaea. ISME J. 6:610-618.
- 37. Meyer, J.L., V.J. Paul, and M. Teplitski. 2014. Community shifts in the surface microbiomes of the coral Porites astreoides with unusual lesions. PLoS One. 9:e100316.
- 38. Mizrahi-Man, O., E.R. Davenport, and Y. Gilad. 2013. Taxonomic classification of bacterial 16S rRNA genes using short sequencing reads: evaluation of effective study designs. PLoS One. 8:e53608.
- 39. Morrow, K.M., A.G. Moss, N.E. Chadwick, and M.R. Liles. 2012. Bacterial associates of two Caribbean coral species reveal species-specific distribution and geographic variability. Appl Environ Microbiol. 78:6438-6449.
- 40. Neave, M.J., R. Rachmawati, L. Xun, C.T. Michell, D.G. Bourne, A. Apprill, and C.R. Voolstra. 2017. Differential specificity between closely related corals and abundant Endozoicomonas endosymbionts across global scales. ISME J. 11:186-200.
- 41. Nishijima, M., K. Adachi, A. Katsuta, Y. Shizuri, and K. Yamasato. 2013. Endozoicomonas numazuensis sp. nov., a gammaproteobacterium isolated from marine sponges, and emended description of the genus Endozoicomonas Kurahashi and Yokota 2007. Int J Syst Evol Microbiol. 63:709-714.
- 42. Pantos, O., P. Bongaerts, P.G. Dennis, G.W. Tyson, and O. Hoegh-Guldberg. 2015. Habitat-specific environmental conditions primarily control the microbiomes of the coral Seriatopora hystrix. ISME J. 9:1916-1927.
- 43. Plante, C.J., K.M. Coe, and R.G. Plante. 2008. Isolation of surfactant-resistant bacteria from natural, surfactant-rich marine habitats. Appl Environ Microbiol. 74:5093-5099.
- 44. Raina, J.B., D. Tapiolas, B.L. Willis, and D.G. Bourne. 2009. Coral-associated bacteria and their role in the biogeochemical cycling of sulfur. Appl Environ Microbiol. 75:3492-3501.
- 45. Reshef, L., O. Koren, Y. Loya, I. Zilber-Rosenberg, and E. Rosenberg. 2006. The coral probiotic hypothesis. Environ Microbiol. 8:2068-2073.
- 46. Roder, C., T. Bayer, M. Aranda, M. Kruse, and C.R. Voolstra. 2015. Microbiome structure of the fungid coral Ctenactis echinata aligns with environmental differences. Mol Ecol. 24:3501-3511.
- 47. Rohwer, F., V. Seguritan, F. Azam, and N. Knowlton. 2002. Diversity and distribution of coral-associated bacteria. Mar Ecol Prog Ser. 243:1-10.
- 48. Romanenko, L.A., N. Tanaka, and G.M. Frolova. 2010. Umboniibacter marinipuniceus gen. nov., sp. nov., a marine gammaproteobacterium isolated from the mollusc Umbonium costatum from the Sea of Japan. Int J Syst Evol Microbiol. 60:603-609.
- 49. Rosenberg, E., O. Koren, L. Reshef, R. Efrony, and I. Zilber-Rosenberg. 2007. The role of microorganisms in coral health, disease and evolution. Nat Rev Microbiol. 5:355-362.
- 50. Rosenberg, E., A. Kushmaro, E. Kramarsky-Winter, E. Banin, and L. Yossi. 2009. The role of microorganisms in coral bleaching. ISME J. 3:139-146.
- 51. Rua, C.P., A.E. Trindade-Silva, and L.R. Appolinario. 2014. Diversity and antimicrobial potential of culturable heterotrophic bacteria associated with the endemic marine sponge Arenosclera brasiliensis. PeerJ. 2:e419.
- 52. Schloss, P.D., S.L. Westcott, and T. Ryabin. 2009. Introducing mothur: open-source, platform-independent, community-supported software for describing and comparing microbial communities. Appl Environ Microbiol. 75:7537-7541.
- 53. Schuett, C., and H. Doepke. 2010. Endobiotic bacteria and their pathogenic potential in cnidarian tentacles. Helgol Mar Res. 64:205-212.
- 54. Séré, M.G., P. Tortosa, P. Chabanet, J. Turquet, J.P. Quod, and M.H. Schleyer. 2013. Bacterial communities associated with Porites white patch syndrome (PWPS) on three western Indian Ocean (WIO) coral reefs. PLoS One. 8:e83746.
- 55. Speck, M.D., and S.P. Donachie. 2012. Widespread Oceanospirillaceae bacteria in Porites spp. J Mar Biol. 2012:746720.
- 56. Vezzulli, L., E. Pezzati, C. Huete-Stauffer, C. Pruzzo, and C. Cerrano. 2013. 16SrDNA pyrosequencing of the Mediterranean gorgonian Paramuricea clavata reveals a link among alterations in bacterial holobiont members, anthropogenic influence and disease outbreaks. PLoS One. 8:e67745.
- 57. Wang, Q., G.M. Garrity, J.M. Tiedje, and J.R. Cole. 2007. Naive Bayesian classifier for rapid assignment of rRNA sequences into the new bacterial taxonomy. Appl Environ Microbiol. 73:5261-5267.
- 58. Wegley, L., R. Edwards, B. Rodriguez-Brito, H. Liu, and F. Rohwer. 2007. Metagenomic analysis of the microbial community associated with the coral Porites astreoides. Environ Microbiol. 9:2707-2719.
- 59. Wilson, K. 2001. Preparation of genomic DNA from bacteria. Curr Protoc Mol Biol. Chapter 2(Unit 2.4Willey, Hoboken.
- 60. Yang, C.S., M.H. Chen, A.B. Arun, C.A. Chen, J.T. Wang, and W.M. Chen. 2010. Endozoicomonas montiporae sp. nov., isolated from the encrusting pore coral Montipora aequituberculata. Int J Syst Evol Microbiol. 60:1158-1162.
- 61. Zurel, D., Y. Benayahu, A. Or, A. Kovacs, and U. Gophna. 2011. Composition and dynamics of the gill microbiota of an invasive Indo-Pacific oyster in the eastern Mediterranean Sea. Environ Microbiol. 13:1467-1476.
