Abstract
Changes in 15N/14N in the soil microbial biomass during nitrogen (N) mineralization have been hypothesized to influence 15N/14N in soil organic matter among ecosystem sites. However, a direct experimental test of this mechanism has not yet been performed. To evaluate the potential control of microbial N mineralization on the natural N isotope composition, we cultured fungi (Aspergillus oryzae) in five types of media of varying C:N ratios of 5, 10, 30, 50, and 100 for 4 d, and tracked changes in δ15N in the microbial biomass, NH4+, and dissolved organic N (DON: glycine) over the course of the experiment. High rates of NH4+ excretion from A. oryzae were accompanied by an increase in δ15N in the microbial biomass in low C:N media (i.e., C/N<30). In contrast, NH4+ was strongly retained in higher C/N treatments with only minor (i.e., <1 ‰) changes being detected in δ15N in the microbial biomass. Differences in δ15N in the microbial biomass were attributed to the loss of low-δ15N NH4+ in low, but not high C/N substrates. We also detected a negative linear correlation between microbial nitrogen use efficiency (NUE) and Δ15N (δ15N-biomass–δ15N-glycine). These results suggest an isotope effect during NH4+ excretion in relatively N-repleted environments in which microbial NUE is low, which may explain the vertical patterns of organic matter δ15N in soil profiles.
Soil microbial processes strongly regulate the terrestrial nitrogen (N) cycle. The microbial decomposition of soil organic matter (SOM) aids in the mineralization of N in plants, which maintains primary productivity (39, 53) and influences the magnitude of denitrification and nitrification (23, 55). Increasing levels of atmospheric CO2 and elevated N deposition rates markedly affect the N cycle (19, 30, 51), partly by changing the quantity and quality of SOM (61). Therefore, it is important to clarify the relationships between soil microbial processes and N and carbon (C) availabilities in order to predict changes in terrestrial ecosystem N cycling.
The soil microbial biomass (SMB) accounts for a significant fraction of the soil N pool (64) and contributes to SOM production and consumption (40, 49). For example, 13C and 15N NMR analyses revealed that SMB in soil minerals contributed to SOM pools (21, 33). The fungal biomass is a demonstrated precursor of SOM formation (9, 17, 31), e.g. the dominant pathway (62%) through which C enters the SOM pool, exceeding C input via leaf litter and fine root turnover, with potentially similar patterns for N (22).
The natural abundance of 15N/14N (δ15N; δ15N is expressed as 15N/14Nsample/15N/14Nstandard–1, where 15N/14Nstandard is atmospheric N2 and treated in units mil−1 [‰]) was previously used to examine relationships among SOM and SMB (13). While whole-soil δ15N patterns are driven by variations in the δ15N of inputs and the balance among leaching and isotopic fractionating gaseous N loss over time (28, 29, 37, 45), the within soil profile δ15N is a product of the downward transport of δ15N, microbial processing, and variations in δ15N in root and litter inputs. The δ15N of surface (i.e., ~top 10 cm) SOM markedly varies among ecosystems, from −7.8‰ in acidic tundra (3) to as high as 22.0‰ in South Africa (13); however, the mechanisms responsible for these variations remain unclear (13, 26).
A primary factor contributing to δ15N-SOM patterns may be the rates of SOM decomposition (11, 35, 38, 56, 59). Kramer et al. (38) reported a strong positive relationship between δ15N-SOM and an index for SOM decomposition (Aliphatic/O-Alkyl), and Sollins et al. (56) demonstrated that δ15N-SOM increased with greater densities in the SOM fraction. These findings imply that high δ15N in SMB-derived compounds is either incorporated into SOM, 15N-depleted SOM is lost during decomposition, or both.
δ15N-SMB, which is measured using a chloroform-fumigation-extraction procedure (14, 62), was shown to be higher than δ15N-SOM in most soils, with the level of 15N enrichment of SMB (Δ15N=δ15N-SMB–δ15N-SOM) varying widely across soils (Table 1). Furthermore, Δ15N increases with decreasing soil C/N (16, 41). Dijkstra et al. (16) hypothesized that the 15N/14N of SMB is controlled by the excretion of 15N-depleted ammonia from the microbial biomass. In this case, δ15N-SMB is expected to increase when soil microbes actively mineralize organic N at low C/N (N sufficient conditions), while δ15N-SMB shows markedly less enrichment when net N is immobilized (incorporate) at high C/N (N limited conditions).
Table 1
Previous findings on differences between δ
15N-SMB and δ
15N-SOM (Δ
15N).
| Δ15N (‰)(=δ15NSMB–δ15NSOM) |
n= |
Depth (cm) |
Period |
Location |
Information |
Reference |
| +0.1 to +0.6 |
3 for each treatment |
0–5 |
October, 1996 |
Kansas, USA |
8-year treated soils including no chamber, an ambient CO2 chamber, and an elevated CO2 chamber |
Williams et al., 2006 (62) |
| +3.1±0.2 |
136 |
A0, 0–10, 0–15 |
1997 to 2004 |
Arizona and Florida, USA |
six experiments covering a broad range of soil types, vegetation cover, climates, land-use practices, and analytical procedures |
Dijkstra et al., 2006a (14) |
| +0 to +4 |
19 |
0–10 |
October 2002
September 2003 |
Hawaii and Arizona, USA |
soils at different elevations |
Dijkstra et al., 2008 (16) |
| −1 to +7 (+5.6±0.5) |
22 |
0–10 |
March, 2003 |
Arizona, USA |
soils in a cattle manure gradient |
Dijkstra et al., 2006b (15) |
| +2 to +10 (+7.2±0.7) |
31 |
0–10 |
March, 2005 |
northern Arizona, USA |
four study sites with different substrate ages of 930 y, 55,000 y, 750,000 y, and 3,000,000 y |
Coyle et al., 2009 (12) |
| +0.3±0.3 to +2.2±0.3 (from day 0 to day 180) |
3 |
0–30 |
|
Varsailles, France |
soil incubation for 6 months |
Lerch et al., 2011 (41) |
| −2 to +1 |
8 for each plot |
0–5 |
April to September, 2007 |
Kansas, USA |
4 plots including fertilized, unfertilized, hayed, and non-hayed |
Tiemann and Billings, 2011 (58) |
| +0 to +8 |
15 |
0–10 |
November, 2014 |
Danjiangkou Reservoir area, China |
soils in woodland plantation, shrubland plantation, cropland, and open areas |
Wu et al., 2016 (63) |
| +17 |
30 |
thin humus layer |
July, 2011 |
nothern Norway |
soils in tundra sites |
Barthelemy et al., 2017 (1) |
15N/14N enrichment in organisms vs. substrates is common. Animals are commonly enriched in 15N by ~3–5‰ vs. food sources, with the δ15N of excreted compounds (NH4+, urea, and urine) being lower than that of the biomass in cows (57), guppies (44), and zooplankton (6). In contrast, less direct evidence is available for microbial 15N enrichment vs. N sources; however, several observations point to this possibility. For example, the δ15N of bacteria grown on alanine as a single nitrogen substrate was 3.6‰ higher than that of alanine (42). Yamaguchi et al. (65) cultured bacteria, fungi, and archaea with casamino acids, and observed 15N enrichment of the biomass in the order of 0.6±0.2, 3.6±0.2, and 5.0±1.0‰, respectively, vs. substrate δ15N. In a controlled culture experiment, Collins et al. (10) demonstrated an increase in δ15N in bacterial cells during N mineralization.
Previous studies suggested that N availability and the degree of N limitation are primary factors contributing to the level of microbial 15N enrichment, which may be expressed through the concept of nitrogen use efficiency (NUE). NUE is defined as the ratio of N incorporation into the microbial biomass to organic N uptake (46) and is expected to decrease when soil microbes actively mineralize organic N at low C/N. In contrast, NUE increases when net N is immobilized at high C/N owing to microbial N limitations. Thus, we hypothesize that NUE controls Δ15N and, thus, δ15N-SOM patterns.
We herein investigated the mechanisms underlying the 15N enrichment of fungi via a controlled culture experiment, and measured δ15N in the biomass, substrates, and NH4+. Fungi were cultured in media with different C:N ratios to examine the hypothesis that NUE is a primary factor responsible for the level of isotopic expression. In the present study, we provide direct evidence to show that the δ15N of fungi is influenced by NUE.
Materials and Methods
Experimental design
Aspergillus oryzae (RIB40, NFRI1599), a well-studied, cosmopolitan strain of fungi, was used in the present study. Five milliliters of A. oryzae (ca. 8×10⁷ cells) was inoculated into 500-mL flasks with 250 mL of medium. Cultures were incubated at 27°C with shaking (180 rpm) for 96 h. Porous silicon plugs were used to maintain aerobic conditions. We used glycine and glucose as the sole C and N sources to adjust the C:N ratio of medium. Five types of media with C:N ratios of 5, 10, 30, 50, and 100 (hereafter CN5, CN10, CN30, CN50, and CN100, respectively) contained glycine and D(+)-glucose at the following amounts: 3.26 and 4 g L−1, 1.63 and 5.2 g L−1, 0.5 and 5.6 g L−1, 0.25 and 4.8 g L−1, and 0.2 and 7.9 g L−1, respectively. The actual initial C:N ratios of media were 5.4±0.1, 11.1±0.2, 31.3±0.5, 52.5±2.0, and 103.6±3.8 (mol mol−1; means±S.D.). All media contained 0.5 g L−1 MgSO4·7H2O, 0.07 g L−1 CaCl2·2H2O, 0.01 g L−1 FeSO4·7H2O, 4.65 mg L−1 MnSO4·5H2O, 5.0 mg L−1 ZnSO4·7H2O, and 1.0 mg L−1 CoCl·6H2O. pH was adjusted to between 5.7 and 5.9 by adding 0.92 g L−1 K2HPO4 and 6.86 g L−1 KH2PO4. Media were filtered through pre-sterilized membrane filters (pore size of 0.22 μm; Stericup and Steritop, Millipore, Burlington, MA, USA), and filtrates were poured into pre-combusted (450°C, 4 h) 500-mL flasks. A total of 1.0 mg L−1 FeSO4·7H2O was added to medium without sterilization because of its oxidization during autoclaving as well as its precipitation. We had 3 replicates, except for CN 5 which had 4 replicates.
Samples were collected every 24 h for a total of 4 d. Five milliliters of media, including the biomass, was collected using a 5-mL pipette and filtered through pre-combusted (450°C, 4 h) glass fiber filters (GF/F; Whatman, Tokyo, Japan) with a pore size of 0.22 μm (Steriflip Filter Unit, Millipore), while all media in the flasks were filtered with a membrane filter (pore size of 0.22 μm; Stericup and Steritop, Millipore) to completely recover the biomass in the flask at 96 h. The filtrate was frozen for later analyses. The biomass on the filter was washed 4 times with 5 mL (total of 20 mL) of 0.9% (w/v) NaCl solution, separated from the filter, transferred to a microtube, and freeze-dried. The growth of A. oryzae was calculated from the freeze-dried biomass weight.
Data collection and analysis
The concentrations of NH4+ and NO3− ([NH4+] and [NO3−], respectively) in filtrates were assessed by colorimetric methods using an autoanalyzer (QuAAtro2-HR; BL-TEC, Tokyo, Japan). [NO3−] was not detected in any samples (the detection limit of 0.1 μM for the sum of NO2− and NO3−). The concentrations of dissolved organic C ([DOC]) and total dissolved N ([TDN]) were measured using a TOC analyzer with a TN unit (TOC-L/TNM-L; Shimadzu, Kyoto, Japan). The concentration of dissolved organic N ([DON]) was calculated as follows: (DON)=(TDN)–(NH4+). The C:N ratio of medium (DOC/TDN) was calculated as DOC/TDN=(DOC)/(TDN).
The recovery % of N during the incubation was calculated as follows: Recovery N (%)=([TDN]+[biomass N])/(TDNinitial)×100, where (TDNinitial) is the concentration of TDN at 0 h and (biomass N) is the concentration of the biomass N. Microbial NUE was calculated as ([DONconsumption]–[NH4+production])/(DONconsumption), where (DONconsumption) represents the difference between initial DON and DON concentrations over the course of the experiment, and (NH4+production) is the difference between NH4+ concentrations and vs. initial NH4+ measured.
The concentrations of biomass carbon ([biomass C]) and (biomass N) and the δ15N values of the biomass (δ15N-biomass) were measured using an elemental analyzer (EA1112; Thermo Fisher Scientific, Yokohama, Japan) interfaced with an isotope ratio mass spectrometer (Delta-XP; Thermo Fisher Scientific). Calibrated in-house standards, such as DL-alanine (δ15N=−1.7‰), glycine (δ15N=10.0‰), and L-histidine (δ15N=−8.0‰), were used to obtain the calibration curve to correct the measured isotopic values. The average standard deviations for a replicate analysis of individual samples were ±0.4‰ for δ15N after blank corrections. The biomass C/N (mol mol−1) was calculated as biomass C/N=(biomass C)/(biomass N).
The δ15N values of NH4+ (δ15N-NH4+) were measured for samples with CN5 and CN10 only after 48 h with sufficient concentrations of (NH4+) that allowed for the assessment of δ15N-NH4+. δ15N-NH4+ was measured using the methods described by Koba et al. (36). In brief, NH4+ was concentrated on the pre-combusted (450°C, 4 h) glass fiber filter (GF/D, diameter of 1 cm, Whatman) using the diffusion method (27), and concentrated NH4+ was then oxidized to NO3− using persulfate (34). The δ15N of converted NO3− from NH4+ was measured using the denitrifier method (4, 54) with an isotope ratio mass spectrometer (IRMS; 20–22: Sercon, Cheshire, UK) coupled with an autosampler (GX-271: GILSON, Middleton, WI, USA) and CryoPrep (Sercon) equipped with a gas chromatograph (GC-4000, GL Sciences, Tokyo, Japan). The denitrifying bacterium, Pseudomonas aureofaciens (ATCC#13985), which lacks nitrous oxide reductase activity, was used to convert NO3− into N2O gas before the isotope analysis. The isotopic standards, USGS25 (δ15N=−30.4‰), USGS26 (δ15N=53.7‰), and IAEA N2 (δ15N=20.3‰), were used for data calibration. The average standard deviations from the replicate analysis of individual samples were large (±1.4‰) for δ15N after blank corrections, and this was attributed to samples with low (NH4+) (CN10 at 48 h). The average standard deviations from the replicate analysis were ±0.1‰ without these low (NH4+) samples after blank corrections.
The δ15N of glycine at 0 h (δ15N-glycine) and δ15N of TDN (δ15NTDN) were measured via the denitrifier method, in which total N was digested to NO3− using the persulfate method (36). Calibrated in-house standards of DL-alanine (δ15N=−1.7‰), glycine (δ15N=10.0‰), and L-histidine (δ15N=−8.0‰) were used for the calibration. The average standard deviations for the replicate analysis of individual samples were ±0.2‰ for δ15N after blank corrections. Δ15N was calculated as the difference between δ15N-biomass and δ15N-glycine (Δ15N=δ15N-biomass–δ15N-glycine).
In some cases, (TDN) was lower than (NH4+) because of the inaccurate assessment of high (NH4+), and we were unable to calculate δ15N-DON with the concentrations and δ15N data of TDN and NH4+. On the other hand, the concentration of Glyused, glycine utilized by A. oryzae, (Glyused), was calculated as (Glyused)=(biomass N)+(NH4+). The δ15N of Glyused (δ15N-Glyused) was then calculated with the concentrations and δ15N values of biomass N and NH4+ as δ15N-Glyused= δ15Nmicrobe×fmicrobe+δ15N-NH4+×fNH4+ and fmicrobe+fNH4+=1, where fNH4+ is the ratio of the concentration of initial NH4+ to TDN and fmicrobe= 1–fNH4+. δ15N-Glyused was not calculated in CN30, CN50, and CN100 because the concentrations of NH4+ were too low to measure δ15N-NH4+. The standard deviations of δ15N-Glyused were evaluated using the Monte Carlo method described by Koba et al. (37).
Statistical analyses were conducted using R software (R version 3.4.2, R core Team [2017]). An α level of 0.05 was considered to indicate significance. The Student’s t-test was used to investigate whether concentrations or δ15N values were significantly different between (DOC)/(TDN) and biomass C/N on each d in all treatments, between δ15N-biomass at 96 h and initial δ15N-glycine (0.1±0.3‰) in all treatments, and between δ15N-Glyused in CN5 and CN10 and initial δ15N-glycine (0.1±0.3‰) on each d. The paired Student’s t-test was used to clarify whether concentrations or δ15N values were significantly different between δ15N-biomass at 24 and 96 h in all treatments, and between δ15N-NH4+ and δ15N-biomass on each d in CN5 and CN10. Pearson’s correlation test was used to examine the relationship between (DOC)/(TDN).
Results
The microbial biomass and carbon and nitrogen dynamics
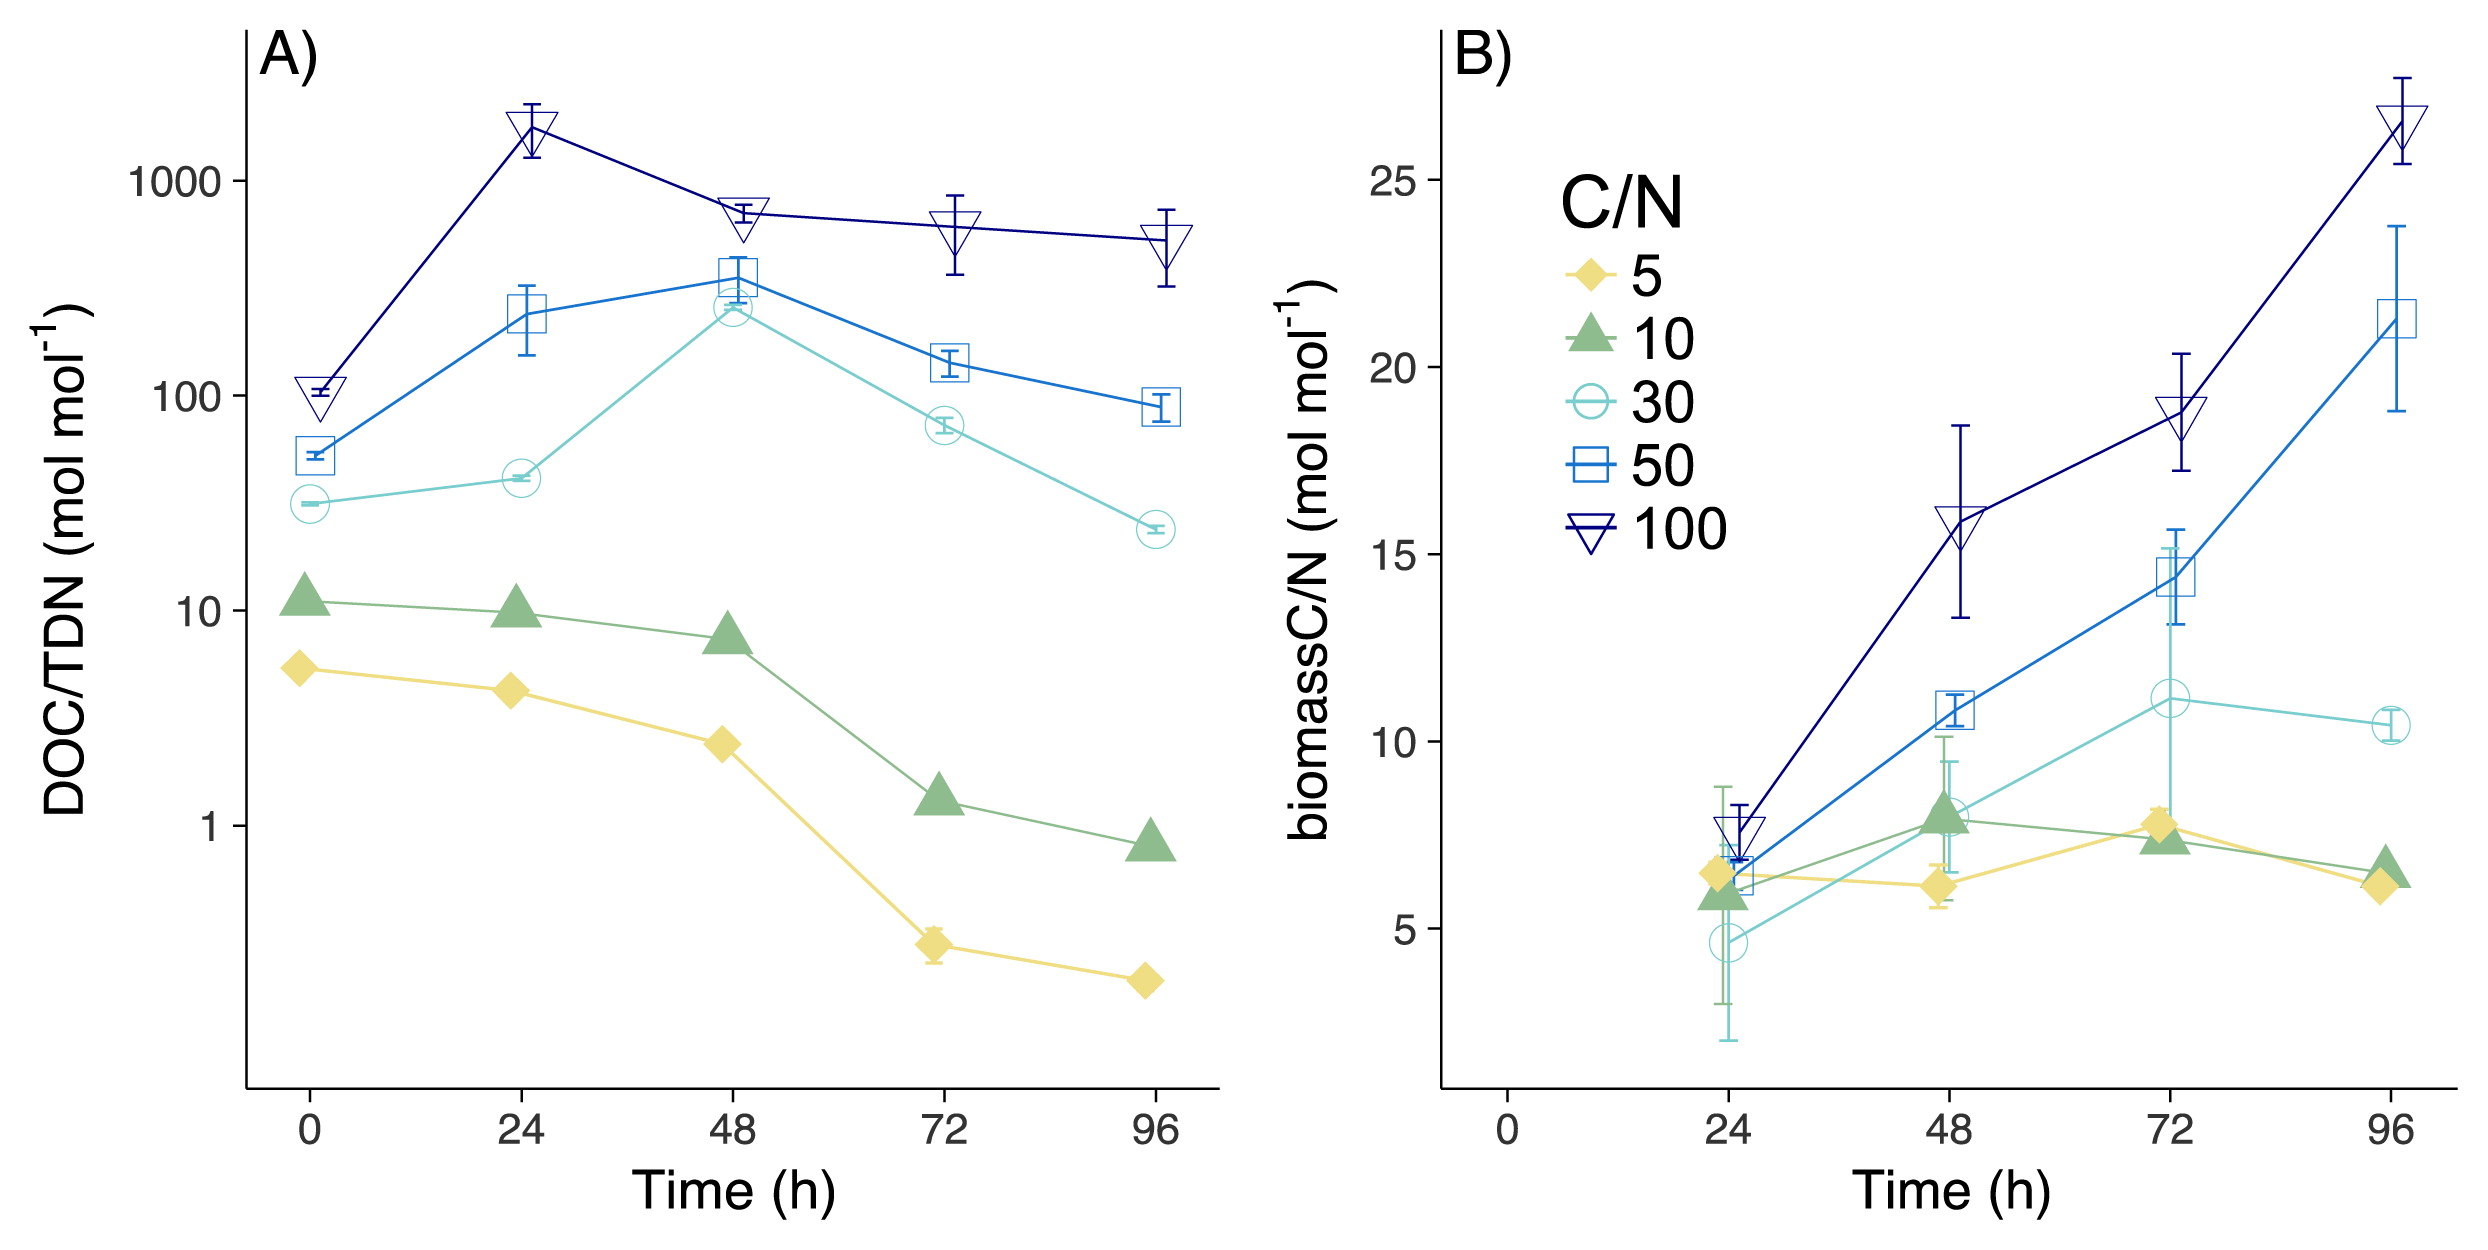
As A. oryzae grew (Fig. 1A), the majority of DOC was consumed by 96 h (97.1±0.1, 96.4±0.1, 95.1±0.3, 77.1±2.1, and 41.9±0.6% [mean±SD] in CN5, CN10, CN30, CN50, and CN100, respectively; Fig. 1B), thereby increasing biomass C over the course of the experiment (Fig. 1C; 24.9±1.0, 25.1±0.9, 29.2±1.6, 39.2±2.6, and 46.3±1.6% of consumed DOC were assimilated in CN5, CN10, CN30, CN50, and CN100, respectively). More than 90% of the DON substrate was consumed in CN30, CN50, and CN100, with DON concentrations decreasing to below the limit of detection in CN5 and CN10 at 72 and 96 h (Fig. 1D). Large amounts of DON were incorporated in biomass N by 96 h (Fig. 1E; 21.4±1.2, 41.1±3.1, 87.6±1.6, 85.0±6.2, and 87.2±5.0% for CN5, CN10, CN30, CN50, and CN100, respectively). Consumed DON was mineralized to NH4+ in CN5 and CN10 (92±2 and 57±10% of consumed DON, respectively), while less than 2% of consumed DON was mineralized to NH4+ in other treatments (Fig. 1F). Nitrate concentrations were below the limit of detection in all treatments. In CN5 and CN10, biomass C/N was significantly higher than DOC/TDN (except for 24 and 48 h in CN10; Fig. 2A and B, Table S1; P<0.001). On the other hand, DOC/TDN was significantly higher than biomass C/N in CN30, 50, and 100 (Fig. 2A and B, Table S1; P<0.01). Moreover, biomass C/N in CN50 and CN100 increased to 21.3±2.5 and 26.6±1.2, respectively, values that were significantly higher than the C/N of soil fungi (4–17) when incubated in medium C/N of 3.9 (47). Although high C/N ratios are not common, fungi may respond to a stoichiometric imbalance by increasing the storage of C in cells (e.g. in lipids [47]), thereby increasing C/N. Another possibility is that the microbial biomass incorporated the degraded necromass at low N concentrations, resulting in the high C/N observed in the total biomass.

The recovery of N was more than 70% in CN5 and CN10, but was lower (40–62%) from 24 to 72 h in CN30, CN50, and CN100 (except at 96 h; Fig. S1). This low recovery of N (less than 100%) was attributed to the underestimation of biomass N (the largest N fraction in this experiment) between 24 and 72 h. We collected the microbial biomass with large membrane filters (see the Methods section) at 96 h, but used a 5-mL pipette with an aperture that was not sufficiently large to collect the same rate of microbial biomass for 250 mL medium until 72 h. Underestimated biomass N (%) may be defined as ([expected biomass N]/[measured biomass N])×100, where (expected biomass N)=(DON consumption)–(NH4+ production). Between 24 and 72 h, underestimated biomass N was between 36 and 60%, while only 10–12% of biomass N was underestimated at 96 h in CN30, CN50, and CN100. We measured biomass N at 96 h at the end of the incubation more accurately than at other time points because we collected all of the microbial biomass left in media using large membrane filters (see the Materials and Methods section), while we collected microbial biomass with a small ratio for 5 mL medium solution using the 5-mL pipette until 72 h. Since DON was nearly consumed by 48 h in CN30 and by 24 h in CN50 and CN100 (Fig. 1D) and less than 2% of consumed DON was mineralized to NH4+, we assumed that the concentrations of biomass N at 48 and 72 h in CN30 and between 24 and 72 h in CN50 and CN100 were similar to that of biomass N at 96 h in each CN treatment. After we recalculated biomass N based on this assumption, the recovery of N in CN30, CN50, and CN100 at 24, 48, and 72 h increased to 74–92%.
Changes in δ15N
δ15N-biomass by 24 h was −0.1±0.5 and −0.2±0.2‰ in CN5 and CN10, respectively; a significant increase in δ15N-biomass between 3.1±0.3 and 2.9±0.0‰ was apparent by 96 h (Fig. 3A, Table S2, P=0.001 and P<0.001). δ15N-biomass at 96 h was significantly higher than δ15N-glycine (0.1±0.3‰) (Fig. 3A, Table S2, P<0.001 and P<0.001), and Δ15N was 3.1±0.5 and 2.7±0.2‰ in CN5 and CN10, respectively. On the other hand, in CN30 and CN100, δ15N-biomass was not significantly different between 24 h (−0.2±0.1 and −0.3±0.9‰) and 96 h (0.4±0.2 and 0.5±0.0‰) (Fig. 3A, Table S2, P=0.076 and P=0.279). In CN50, δ15N-biomass was significantly different between 24 h (−0.1±0.3‰) and 96 h (0.6±0.1‰) (Fig. 3A, Table S2, P=0.037); however, this difference (0.7±0.2‰) was markedly smaller than that observed for CN5 and CN10. In CN30, CN50, and CN100, δ15N was not significantly different between glycine and biomass N at 96 h (Fig. 3A, Table S2, P=0.358, P=0.162, P=0.227, respectively), and Δ15N (0.4±0.2, 0.7±0.1, 0.6±0.0‰, respectively) was smaller than those for CN5 and CN10.

δ15N-NH4+ was below the limit of quantification in CN30, CN50, and CN100 (Fig. 3B). In CN5 and CN10, δ15N-NH4+ was significantly lower than δ15N-biomass (Table S3); the differences between them at 48, 72, and 96 h were 3.9±0.6, 2.7±0.5, and 3.5±0.6‰ in CN5, and 21.4±1.1, 4.6±0.2, and 4.9±0.2‰ in CN10, respectively. Among δ15N-Glyused and δ15N-glycine (0.1±0.3‰), significant differences were observed at 48 and 72 h in CN5 and at 48 h in CN10 (Fig. 3C, Table S4). However, differences between δ15N-Glyused and δ15N-glycine (average of δ15N-Glyused–average of δ15N-glycine) remained small at 48, 72, and 96 h (+0.35, +1.44, and −0.30 in CN5, and −1.11, −0.65, and −0.22 in CN10, respectively).
NUE and Δ15N
Microbial NUE changed according to the nutrient imbalance (Fig. S2). NUE was examined in CN5 and CN10 only because of the low recovery of biomass N in CN30, CN50, and CN100 (Table S1). A negative linear correlation was observed between DOC/TDN and Δ15N (Fig. 4A) and NUE and Δ15N (Fig. 4B). Linear regression lines for CN5 (Δ15N=−3.0×NUE+3.0 [R2=0.89, P<0.001]) and CN10 (Δ15N=−4.2×NUE+3.8 [R2=0.86, P<0.001]; Fig. 4B) had similar slopes, but slightly different intercepts (P=0.06 for slopes and P<0.0001 for intercepts by an analysis of co-variance; Fig. 3B); however, the difference in intercepts was smaller than the error for isotope measurements (±0.6‰). The isotopic fractionation of NH3 volatilization was negligible because the pH of all media were lower than 7 through the experiment. The data obtained are shown in Table S5.
Discussion
Mechanism of 15N enrichment
We tested hypotheses that the δ15N of extracted substrates explains the patterns of microbial biomass enrichment, with implications for the pattern and regulation of surface SOM δ15N across ecosystems. We predicted that the δ15N of NH4+ may be depleted more at higher levels of N available to microbes (i.e., low C/N), with N functioning as more of an excess nutrient and, thus, being more rapidly mineralized from organic substrates. The present results confirmed these hypotheses; the mineralization (excretion of NH4+) of DON by A. oryzae in CN5 and CN10 (Fig. 1D and F) was accompanied by increases in δ15N-biomass over time (Fig. 3A), revealing that N supplies from DON exceeded N demands at low C/N levels. Moreover, A. oryzae retained DON in CN30, CN50, and CN100 without any detectable changes in δ15N-biomass, thereby demonstrating the importance of N availability in assessing the loss of low-δ15N NH4+ from microbes. According to the mass balance, any elevation in δ15N in the microbial biomass vs. substrates must be balanced by a loss of low δ15N-NH4+. δ15N-NH4+ was significantly lower than δ15N-biomass in CN5 and CN10 (Table S3), with prominent isotopic excursions that varied between 2.0 and 22.7‰ (Fig. 3B). This level of isotopic depletion is similar to observations for cows (7.3‰; 57), fish (23.3–31.8‰; 44), and plankton (3‰; 6).
Mechanistically, our results revealed that the loss of 15N-dpeleted NH4+ was the principal determinant of fungal biomass δ15N, which was very important when N was high (i.e., low C/N substrate ratios) (Fig. 1F, 3A, and B). A small isotope effect was observed during DON assimilation by A. oryzae, with only minor Δ15N values observed for C/N ratios in excess of 30 (Fig. 3A, Table S2). In contrast, Δ15N increased over time in CN5 and CN10 (Fig. 3A, Table S2), with little evidence for changes in δ15N-Glyused (Fig. 3C, Table S4). These results revealed negligible isotope fractionation during DON uptake by fungi, as reported previously for mycorrhiza (18). The negative correlation between DOC/TDN and Δ15N in CN5 and CN10 (R=−0.88, P<0.001, Fig. 4A), which is similar to the negative correlation between the soil C:N ratio and soil microbial Δ15N (16, 41), supports the hypothesis that the mineralization of low δ15N-NH4+ is the primary driver of microbial δ15N (16).
While the absorption of isotopically depleted δ15N-NH4+ by A. oryzae may decrease, δ15N-biomass may, in principle, decrease δ15N in the microbial biomass (−14.1±0.8‰ [60]); however, this was not the case in the present study. Although DON and NH4+ absorption both occur in ecosystems (53), A. oryzae did not appear to use excreted NH4+ due to C limitations at low C/N ratios; the low concentrations of NH4+ in CN30, CN50, and CN100 may have strongly limited the importance of this N source in the present study (Fig. 1F, 2A, and B).
We used glycine as the sole N source because it accounts for a large fraction of amino acids in soil (32), making it a meaningful indicator of amino acid utilization in trees and microbes (5). The glycine cleavage system, one of the main degradation pathways of glycine, has been hypothesized to favor 15N and cause the 15N enrichment of NH4+ products (20). Thus, δ15N-NH4+ may be higher than δ15N-biomass when the glycine cleavage system is rate-limiting and NH4+ is excreted from the microbial biomass. Since δ15N-NH4+ was significantly lower than δ15N-biomass in the present study (Table S3), we obtained little or no evidence for glycine cleavage.
Collins et al. (10) incubated Escherichia coli with glycine as the sole N source. The findings obtained demonstrated that δ15N-biomass was high in the early stage of the experiments (before 50 h), while δ15N-biomass and δ15N-NH4+ approached the δ15N of substrates in the later stages (after 50 h) in CN5 media. These findings are in contrast to the present results showing that δ15N-biomass increased over time (Fig. 3A), with δ15N-NH4+ being significantly lower than δ15N-biomass (Table S3) in CN5 media. These differences were attributed to the presence of NH4+ re-assimilation or differences in glycine metabolic pathways. In the study by Collins et al. (10), NH4+ re-assimilation, with large isotope fractionation (25), occurred in the later stages (the stationary phase of E. coli), such that δ15N-biomass decreased and δ15N-NH4+ approached the δ15N of substrates. On the other hand, in our experiment, NH4+ re-assimilation did not occur in the later stages when A. oryzae actively mineralized organic N. Furthermore, the glycine cleavage system may have caused the enrichment of δ15N-NH4+ and the depletion of δ15N-biomass in the study by Collins et al. (10), but not the present study.
NUE controls 15N enrichment
The present results on A. oryzae revealed a negative linear correlation between NUE and Δ15N (Fig. 4B), indicating the control of N limitations on δ15N in the microbial biomass and mineralized NH4+ under laboratory conditions. Soil microbes may widely change their NUE, while NUE by animals remains low (less than 0.5 [7, 8]), with a constant and large difference (3–4.8‰) between the δ15N of animals and substrates (6, 44, 52, 57). Therefore, the present results imply that NUE influences 15N enrichment; relatively constant 15N enrichment and NUE for animals and variable 15N enrichment and NUE for microbes.
These results imply similar control over δ15N-SOM patterns in the field; however, further research is needed to test this hypothesis under natural ecosystem settings. δ15N-SOM has been shown to markedly change with soil depth, with more substantial 15N enrichment being observed from shallow to deep soil layers (2, 24, 43, 48, 50). Since microbially-derived organic N may contribute to SOM (40, 49), the δ15N of SOM is also affected by δ15N in the microbial biomass, which is controlled by microbial NUE. Further research is warranted to understand the control of soil microbial stoichiometry on δ15N-SOM, and the present results suggest a hypothesis that has the potential to link microbial N demands to δ15N, thereby offering a non-intrusive and integrative tool through which to understand nutrient limitations in soil decomposer communities.
Acknowledgements
We thank Ryo Kobayashi, Shotoku Kotajima, Ayami Koba, Eriko Murata, Motoki Murata, Kazuaki Sumi, Shota Takino, and Bin Hiratsuka at TUAT for their fruitful discussions on our research. We also thank Yuka Kojima and Kiwamu Umezawa at Yoshida laboratory in TUAT for helping with A. oryzae treatments. This study was supported by Grants-in-Aid for Scientific Research (KAKENHI Grants 26252020, 16H02524, 17H06297, and 18H04138) from the Japan Society for the Promotion of Science.
References
- 1. Barthelemy, H., S.
Stark, M.M.
Kytöviita, and J.
Olofsson. 2017. Grazing decreases N partitioning among coexisting plant species. Funct Ecol. 31:2051-2060.
- 2. Billings, S.A., and D.D.
Richter. 2006. Changes in stable isotopic signatures of soil nitrogen and carbon during 40 years of forest development. Oecologia. 148:325-333.
- 3. Bret-harte, M.S., M.C.
Mack, G.R.
Goldsmith, D.B.
Sloan, J.
Demarco, G.R.
Shaver, P.M.
Ray, Z.
Biesinger, and F.S.
Chapin. 2008. Plant functional types do not predict biomass responses to removal and fertilization in Alaskan tussock tundra. J Ecol. 96:713-726.
- 4. Casciotti, K.L., D.M.
Sigman, M.G.
Hastings, J.K.
Böhlke, and A.
Hilkert. 2002. Measurement of the oxygen isotopic composition of nitrate in seawater and freshwater using the denitrifier method. Anal Chem. 74:4905-4912.
- 5. Chapin, III, F.S., L.
Moilanen, and K.
Kielland. 1993. Preferential use of organic nitrogen for growth by a non-mycorrhizal arctic sedge. Nature. 361:150-153.
- 6. Checkley, D.M., and C.A.
Miller. 1989. Nitrogen isotope fractionation by oceanic zooplankton. Deep-Sea Res, Part A. 36:1449-1456.
- 7. Cheng, L., A.J.
Sheahan, S.J.
Gibbs, A.G.
Rius, J.K.
Kay, S.
Meier, G.R.
Edwards, R.J.
Dewhurst, and J.R.
Roche. 2013. Technical note: Nitrogen isotopic fractionation can be used to predict nitrogen-use efficiency in dairy cows fed temperate pasture. J Anim Sci. 91:5785-5788.
- 8. Cheng, L., G.R.
Edwards, R.J.
Dewhurst, A.M.
Nicol, and D.
Pacheco. 2016. The effect of dietary water soluble carbohydrate to nitrogen ratio on nitrogen partitioning and isotopic fractionation of lactating goats offered a high-nitrogen diet. Animal. 10:779-785.
- 9. Clemmensen, K.E., A.
Bahr, O.
Ovaskainen, A.
Dahlberg, A.
Ekblad, H.
Wallander, J.
Stenlid, R.D.
Finlay, and B.D.
Lindahl. 2013. Roots and associated fungi drive long-term carbon sequestration in Boreal forest. Science. 339:1615-1618.
- 10. Collins, J.G., P.
Dijkstra, S.C.
Hart, B.A.
Hungate, N.M.
Flood, and E.
Schwartz. 2008. Nitrogen source influences natural abundance 15N of Escherichia coli. FEMS Microbiol Lett. 282:246-250.
- 11. Connin, S.L., X.
Feng, and R.A.
Virginia. 2001. Isotopic discrimination during long-term decomposition in an arid land ecosystem. Soil Biol Biochem. 33:41-51.
- 12. Coyle, J.S., P.
Dijkstra, R.R.
Doucett, E.
Schwartz, S.C.
Hart, and B.
Hungate. 2009. Relationships between C and N availability, substrate age, and natural abundance 13C and 15N signatures of soil microbial biomass in a semiarid climate. Soil Biol Biochem. 41:1605-1611.
- 13. Craine, J.M., E.N.J.
Brookshire, M.D.
Cramer, N.J.
Hasselquist, K.
Koba, E.
Marin-Spiotta, and L.
Wang. 2015. Ecological interpretations of nitrogen isotope ratios of terrestrial plants and soils. Plant Soil. 396:1-26.
- 14. Dijkstra, P., A.
Ishizu, R.
Doucett, S.C.
Hart, E.
Schwartz, O.V.
Menyailo, and B.A.
Hungate. 2006. 13C and 15N natural abundance of the soil microbial biomass. Soil Biol Biochem. 38:3257-3266.
- 15. Dijkstra, P., O.V.
Menyailo, R.R.
Doucett, S.C.
Hart, E.
Schwartz, and B.A.
Hungate. 2006. C and N availability affects the 15N natural abundance of the soil microbial biomass across a cattle manure gradient. Eur J Soil Sci. 57:468-475.
- 16. Dijkstra, P., C.M.
Laviolette, J.S.
Coyle, R.R.
Doucett, E.
Schwartz, S.C.
Hart, and B.A.
Hungate. 2008. 15N enrichment as an integrator of the effects of C and N on microbial metabolism and ecosystem function. Ecol Lett. 11:389-397.
- 17. Ekblad, A., H.
Wallander, D.L.
Godbold, et al. 2013. The production and turnover of extramatrical mycelium of ectomycorrhizal fungi in forest soils: role in carbon cycling. Plant Soil. 366:1-27.
- 18. Emmerton, K.S., T.V.
Callaghan, H.E.
Jones, J.R.
Leake, A.
Michelsen, and D.J.
Read. 2001. Assimilation and isotopic fractionation of nitrogen by mycorrhizal fungi. New Phytol. 151:503-511.
- 19. Galloway, J.N., A.R.
Townsend, J.W.
Erisman, M.
Bekunda, Z.
Cai, J.R.
Freney, L.A.
Martinelli, S.P.
Seitzinger, and M.A.
Sutton. 2008. Transformation of the nitrogen cycle: recent trends, questions, and potential solutions. Science. 320:889-892.
- 20. Gauthier, P.P.G., M.
Lamothe, A.
Mahé, G.
Molero, S.
Nogués, M.
Hodges, and G.
Tcherkez. 2013. Metabolic origin of δ15N values in nitrogenous compounds from Brassica napus L. leaves. Plant, Cell Environ. 36:128-137.
- 21. Gleixner, G.
2013. Soil organic matter dynamics: a biological perspective derived from the use of compound-specific isotopes studies. Ecol Res. 28:683-695.
- 22. Godbold, D.L., M.R.
Hoosbeek, M.
Lukac, et al. 2006. Mycorrhizal hyphal turnover as a dominant process for carbon input into soil organic matter. Plant Soil. 281:15-24.
- 23. Hart, S.C., G.E.
Nason, D.D.
Myrold, and D.A.
Perry. 1994. Dynamics of Gross Nitrogen Transformations in an Old-Growth Forest: The Carbon Connection. Ecology. 75:880-891.
- 24. Hobbie, E.A., and A.P.
Ouimette. 2009. Controls of nitrogen isotope patterns in soil profiles. Biogeochemistry. 95:355-371.
- 25. Hoch, M.P., M.L.
Fogel, and D.L.
Kirchman. 1992. Isotope fractionation associated with ammonium uptake by a marine bacterium. Limnol Oceanogr. 37:1447-1459.
- 26. Hogberg, P. 1997. 15N natural abundance in soil-plant systems. New Phytol. 137:179-203.
- 27. Holmes, R.M., J.W.
McClelland, D.M.
Sigman, B.
Fry, and B.J.
Peterson. 1998. Measuring 15N-NH4+ in marine, estuarine and fresh waters: An adaptation of the ammonia diffusion method for samples with low ammonium concentrations. Mar Chem. 60:235-243.
- 28. Houlton, B.Z., D.M.
Sigman, and L.O.
Hedin. 2006. Isotopic evidence for large gaseous nitrogen losses from tropical rainforests. Proc Natl Acad Sci USA. 103:8745-8750.
- 29. Houlton, B.Z., and E.
Bai. 2009. Imprint of denitrifying bacteria on the global terrestrial biosphere. Proc Natl Acad Sci USA. 106:21713-21716.
- 30. Houlton, B.Z., A.R.
Marklein, and E.
Bai. 2015. Representation of nitrogen in climate change forecasts. Nat Clim Change. 5:398-401.
- 31. Kallenbach, C.M., A.
Grandy, S.D.
Frey, and S.
Grandy. 2016. Direct evidence for microbial-derived soil organic matter formation and its ecophysiological controls. Nat Commun. 7:13630.
- 32. Kielland, K.
1995. Landscape patterns of free amino acids in arctic tundra soils. Biogeochemistry. 31:85-98.
- 33. Kleber, M., P.
Sollins, and R.
Sutton. 2007. A conceptual model of organo-mineral interactions in soils: self-assembly of organic molecular fragments into zonal structures on mineral surfaces. Biogeochemistry. 85:9-24.
- 34. Knapp, A.N., D.M.
Sigman, and F.
Lipschultz. 2005. N isotopic composition of dissolved organic nitrogen and nitrate at the Bermuda Atlantic Time-series Study site. Global Biogeochem Cycles. 19:GB1018.
- 35. Koba, K., N.
Tokuchi, T.
Yoshioka, E.A.
Hobbie, and G.
Iwatsubo. 1998. Natural abundance of nitrogen-15 in a forest soil. Soil Sci Soc Am J. 62:778-781.
- 36. Koba, K., K.
Isobe, Y.
Takebayashi, et al. 2010. δ15N of soil N and plants in a N-saturated, subtropical forest of southern China. Rapid Commun Mass Spectrom. 24:2499-2506.
- 37. Koba, K., Y.
Fang, J.
Mo, et al. 2012. The 15N natural abundance of the N lost from an N-saturated subtropical forest in southern China. J Geophys Res Biogeosci. 117:G02015.
- 38. Kramer, M.G., P.
Sollins, R.S.
Sletten, and P.K.
Swart. 2003. N isotope fractionation and measures of organic matter alteration during decomposition. Ecology. 84:2021-2025.
- 39. LeBauer, D.S., and K.K.
Treseder. 2008. Nitrogen limitation of net primary productivity in terrestrial ecosystems is globally distributed. Ecology. 89:371-379.
- 40. Lehmann, J., and M.
Kleber. 2015. The contentious nature of soil organic matter. Nature. 528:60-68.
- 41. Lerch, T.Z., N.
Nunan, M.-F.
Dignac, C.
Chenu, and A.
Mariotti. 2011. Variations in microbial isotopic fractionation during soil organic matter decomposition. Biogeochemistry. 106:5-21.
- 42. Macko, S.A., M.L.F.
Estep, P.E.
Hare, and T.C.
Hoering. 1987. Isotopic fractionation of nitrogen and carbon in the synthesis of amino acids by microorganisms. Chem Geol. 65:79-92.
- 43. Mariotti, A., D.
Pierre, J.C.
Vedy, S.
Bruckert, and J.
Guillemot. 1980. The abundance of natural nitrogen 15 in the organic matter of soils along an altitudinal gradient (chablais, haute savoie, France). Catena. 7:293-300.
- 44. Minagawa, M., and E.
Wada. 1984. Stepwise enrichment of “15N along food chains: Further evidence and the relation between δ15N and animal age. Geochim Cosmochim Ac. 48:1135-1140.
- 45. Mnich, M.E., and B.Z.
Houlton. 2016. Evidence for a uniformly small isotope effect of nitrogen leaching loss: results from disturbed ecosystems in seasonally dry climates. Oecologia. 181:323-333.
- 46. Mooshammer, M., W.
Wanek, I.
Hämmerle, et al. 2014. Adjustment of microbial nitrogen use efficiency to carbon: nitrogen imbalances regulates soil nitrogen cycling. Nat Commun. 5:3694.
- 47. Mooshammer, M., W.
Wanek, S.
Zechmeister-Boltenstern, and A.
Richter. 2014. Stoichiometric imbalances between terrestrial decomposer communities and their resources: Mechanisms and implications of microbial adaptations to their resources. Front Microbiol. 5:1-10.
- 48. Natelhoffer, K.J., and B.
Fry. 1988. Controls on Natural Nitrogen-15 and Carbon-13 Abundances in Forest Soil Organic Matter. Soil Sci Soc Am J. 52:1633-1640.
- 49. Paul, E.A.
2016. The nature and dynamics of soil organic matter: Plant inputs, microbial transformations, and organic matter stabilization. Soil Biol Biochem. 98:109-126.
- 50. Piccolo, M.C., C.
Neill, J.M.
Mellil, C.C.
Cerri, and P.A.
Steudler. 1996. 15N natural abundance in forest and pasture soils of the Brazilian Amazon Basin. Plant Soil. 182:249-258.
- 51. Pinder, R.W., E.A.
Davidson, C.L.
Goodale, T.L.
Greaver, J.D.
Herrick, and L.
Liu. 2012. Climate change impacts of US reactive nitrogen. Proc Natl Acad Sci USA. 109:7671-7675.
- 52. Post, D.M.
2002. Using stable isotopes to estimate trophic position: models, methos, and assumptions. Ecology. 83:703-718.
- 53. Schimel, J.P., and J.
Bennett. 2004. Nitrogen mineralization: challenges of a changing paradigm. Ecology. 85:591-602.
- 54. Sigman, D.M., K.L.
Casciotti, M.
Andreani, C.
Barford, M.
Galanter, and J.K.
Böhlke. 2001. A Bacterial Method for the Nitrogen Isotopic Analysis of Nitrate in Seawater and Freshwater. Anal Chem. 73:4145-4153.
- 55. Singh, B.K., R.D.
Bardgett, P.
Smith, and D.S.
Reay. 2010. Microorganisms and climate change: terrestrial feedbacks and mitigation options. Nat Rev Microbiol. 8:779-790.
- 56. Sollins, P., M.G.
Kramer, C.
Swanston, K.
Lajtha, T.
Filley, A.K.
Aufdenkampe, W.
Rota, and R.D.
Bowden. 2009. Sequential density fractionation across soils of contrasting mineralogy: evidence for both microbial- and mineral-controlled soil organic matter stabilization. Biogeochemistry. 96:209-231.
- 57. Steele, K.W., and R.M.
Daniel. 1978. Fractionation of nitrogen isotopes by animals: a further complication to the use of variations in the natural abundance of 15N for tracer studies. J Agric Sci. 90:7-9.
- 58. Tiemann, L.K., and S.
Billings. 2011. Indirect effects of nitrogen amendments on organic substrate quality increase enzymatic activity driving decomposition in a mesic grassland. Ecosystems. 14:234-247.
- 59. Tiessen, H., R.E.
Karamanos, J.W.B.
Stewart, and F.
Selles. 1984. Natural nitrogen-15 abundance as an indicator of soil organic matter transformations in native and cultivated soils. Soil Sci Soc Am J. 48:312-315.
- 60. Vo, J., W.
Inwood, J.M.
Hayes, and S.
Kustu. 2013. Mechanism for nitrogen isotope fractionation during ammonium assimilation by Escherichia coli K12. Proc Natl Acad Sci USA. 110:8696-8701.
- 61. Wang, H., T.W.
Boutton, W.
Xu, G.
Hu, P.
Jiang, and E.
Bai. 2015. Quality of fresh organic matter affects priming of soil organic matter and substrate utilization patterns of microbes. Sci Rep. 5:10102.
- 62. Williams, M.A., C.W.
Rice, and C.E.
Owensby. 2006. Natural 15N abundances in a tallgrass prairie ecosystem exposed to 8-y of elevated atmospheric CO2. Soil Biol Biochem. 38:409-412.
- 63. Wu, J., Q.
Zhang, F.
Yang, Y.
Lei, Q.
Zhang, and X.
Cheng. 2016. Afforestation impacts microbial biomass and its natural 13C and 15N abundance in soil aggregates in central China. Sci Total Environ. 568:52-56.
- 64. Xu, X., P.E.
Thornton, and W.M.
Post. 2013. A global analysis of soil microbial biomass carbon, nitrogen and phosphorus in terrestrial ecosystems. Glob Ecol Biogeogr. 22:737-749.
- 65. Yamaguchi, Y., Y.
Chikaraishi, Y.
Takano, N.O.
Ogawa, H.
Imachi, Y.
Yokoyama, and N.
Ohkouchi. 2017. Fractionation of nitrogen isotopes during amino acid metabolism in heterotrophic and chemolithoautotrophic microbes across Eukarya, Bacteria, and Archaea: Effects of nitrogen sources and metabolic pathways. Org Geochem. 111:101-112.

