Abstract
Methane-oxidizing bacteria (MOB) are ubiquitous and play an important role in the mitigation of global warming by reducing methane. MOB are commonly classified into Type I and Type II, belonging to Gammaproteobacteria and Alphaproteobacteria, respectively, and the diversity of MOB has been examined. However, limited information is currently available on favorable environments for the respective MOB. To investigate the environmental factors affecting the dominant type in the MOB community, we performed MOB enrichment using down-flow hanging sponge reactors under 38 different environmental conditions with a wide range of methane (0.01–80%) and ammonium concentrations (0.001–2,000 mg N L–1) and pH 4–7. Enrichment results revealed that pH was a crucial factor influencing the MOB type enriched. Type II was dominantly enriched at low pH (4–5), whereas Type I was dominant around neutral pH (6–7). However, there were some unusual cultivated biomass samples. Even though high methane oxidation activity was observed, very few or zero conventional MOB were detected using common FISH probes and primer sets for the 16S rRNA gene and pmoA gene amplification. Mycobacterium mostly dominated the microbial community in the biomass cultivated at very high NH4+ concentrations, strongly implying that it exhibits methane oxidation activity. Collectively, the present results revealed the presence of many unknown phylogenetic groups with the capacity for methane oxidation other than the reported MOB.
Methane is the second largest contributor to global warming, and its atmospheric concentration has been rapidly increasing, reaching approximately 1,850 ppb in 2017 (Nisbet et al., 2019). Although methane is biologically produced in nature, methane-oxidizing bacteria (MOB) play an important role in reducing its atmospheric concentration, which contributes to the mitigation of global warming (Conrad, 2009). MOB are commonly classified into two types, i.e., Type I and Type II, based on phylogenetic and metabolic differences (Hanson and Hanson, 1996). Type I MOB belong to Gammaproteobacteria that use the ribulose monophosphate (RuMP) pathway for carbon assimilation, while Type II MOB belong to Alphaproteobacteria that use the serine pathway. Besides Proteobacteria, recent studies reported new groups of MOB, such as Methylacidiphilum fumariolicum in the phylum Verrucomicrobia (Pol et al., 2007). Ettwig et al. (2009) found the NC10 phylum Candidatus Methylomirabilis oxygeniifera. Therefore, methane is consumed by diverse MOB. However, limited information is currently available on the specific environmental conditions required for different MOB and the extent to which they contribute to the carbon cycle.
Since pH affects microbial activity, the type of dominant MOB in an environment depends on its pH. Type II MOB are often detected in acidic environments, such as forest soils and peat (Dedysh et al., 2001; 2003). In contrast, Type I are found under neutral pH and alkaline conditions (Khmelenina et al., 2010; Gupta et al., 2012), suggesting that pH is an important factor governing the MOB community structure. However, different pH dependencies have been reported during the enrichment of the MOB community in bioreactors. Hatamoto et al. (2011) reported that Type II MOB dominated not only at pH 5.5, but also at pH 8.0.
In addition to pH, the concentration of methane may also affect the MOB community structure. If two MOB types have different affinities for methane, the dominant type will depend on the concentration of methane present. Type I MOB reportedly exhibit a preference for lower methane concentrations than Type II, which preferentially grow at higher methane concentrations (Graham et al., 1993; Amaral and Knowles, 1995). However, Matsuura et al. (2017) obtained different findings in a reactor with a range of methane concentrations, with only Type I MOB dominating at both high and low concentrations.
Field surveys of farm soils demonstrated that ammonium fertilizers reduced methane oxidation (Steudler et al., 1989; Mohanty et al., 2006; Shrestha et al., 2010). This phenomenon may be explained by MOB simultaneously oxidizing ammonium to nitrite (Hutton and Zobell, 1953; Dalton, 1977; O’Neill and Wilkinson, 1977). MOB exhibit methane monooxygenase activity, which oxidizes methane to methanol. Ammonium, which has a similar molecular structure and size to methane, binds to the active site of methane monooxygenase and is oxidized (Schimel, 2000). In other words, ammonium inhibits methane oxidation, and this competitive inhibition has been observed for different MOB species in pure culture experiments (Whittenbury et al., 1970; King and Schnell, 1994). In addition, the degree of inhibition differs between various species of MOB (Nyerges and Stein, 2009; Nyerges et al., 2010). Therefore, the concentration of ammonium in an environment may also influence the dominance of a particular MOB.
Methanotrophic community analyses of soil samples from a wide variety of environments, such as farm paddy fields and forests, have been conducted (e.g., Bourne et al., 2001; Knief et al., 2005; Lüke and Frenzel, 2011; Kravchenko and Sukhacheva, 2017). This type of survey is very useful for obtaining a more detailed understanding of the diversity of MOB in natural environments. However, the methodology employed has a significant drawback for assessing MOB-specific growth conditions because of the difficulties associated with measuring methane and ammonium concentrations in natural environments. In contrast, the use of bioreactors with a continuous flow operation is very promising for examining the relationship between habitant MOB and environments because experimental conditions may be easily controlled and properly maintained for a long time during MOB enrichment. Moreover, MOB produce intermediates (Hanson and Hanson, 1996) that affect experimental conditions; however, these may be easily discharged from continuous bioreactors.
To identify the environmental factors governing the MOB community structure, we attempted to enrich diverse MOB under different environmental conditions of pH, methane concentrations, and ammonium concentrations. As one of the features of the present study, a down-flow hanging sponge (DHS) reactor was employed because it has been successfully implemented in MOB cultivation (Hatamoto et al., 2011; Matsuura et al., 2017; Matsushita et al., 2018) and also in the enrichment of unculturable microbes (Imachi et al., 2020), and it is easy to operate.
Materials and Methods
Experimental set-up
To enrich MOB, 38 identical closed DHS reactors (each consisting of a 70-mL glass column with a height of 400 mm and diameter of 30 mm) were used. A set of eight polyurethane sponge cubes (each 1×1×1 cm3) were hung diagonally in series on a nylon string in the gas phase of each column. Activated sludge collected from an aeration tank in a municipal wastewater treatment plant was used as the microbial inoculum. Before setting up the DHS reactors, sponges were soaked in activated sludge diluted with water (approximately 100 mg MLSS L–1).
Operational conditions
All reactors were operated in a temperature-controlled dark room at 30°C for 13–89 days, depending on methane consumption (Table 1). Air containing methane as the substrate was fed into the top of each reactor at a gas retention time (GRT) of 0.3–14.5 min based on the sponge volume using a pump and emitted from the bottom of the column. A mineral solution was supplied to the reactor at a hydraulic retention time (HRT) of 0.4–87 min based on the sponge volume and discharged from the bottom. Effluents were recirculated at a ratio of 1:10 (influent : recirculation) to mitigate the longitudinal methane concentration gradient in the liquid and gas. Feeding methane concentrations were set at 0.01, 0.1, 1.0, 5.0, 10, and 80%. Influent ammonium was provided at 0.001, 0.1, 0.5, 1.0, 10, 100, 500, 1,000, and 2,000 mg NH4+ N L–1. Influent pH was set at 4, 5, 6, and 7. Oxygen was provided at 20%, except for Runs 3 and 7 (for which it was provided at 2.0%). Thirty-eight runs were conducted using different combinations of methane concentrations, ammonium concentrations, oxygen concentrations, and pH values (Table 1).
Table 1.
Operational conditions, maximum methane oxidation rates, and dominant MOB types identified by FISH
| Run No. |
pH |
CH4 (%) |
NH4+
(mg N L–1) |
O2 (%) |
Cultivation period
(day) |
CH4 oxidation rate
(g CH4 L–1 d–1) |
Dominant
MOB type |
| 1 |
7 |
10 |
10 |
20 |
23 |
7.367 |
Type I |
| 2 |
7 |
0.1 |
10 |
20 |
69 |
0.187 |
Type I |
| 3 |
7 |
10 |
10 |
2 |
35 |
3.848 |
Type I |
| 4 |
4 |
10 |
10 |
20 |
28 |
6.795 |
Type II |
| 5 |
7 |
10 |
1.0 |
20 |
13 |
9.985 |
Type I |
| 6 |
7 |
0.1 |
1.0 |
20 |
39 |
0.238 |
Type I |
| 7 |
7 |
10 |
1.0 |
2 |
13 |
6.784 |
Type I |
| 8 |
4 |
10 |
100 |
20 |
18 |
9.843 |
Type II |
| 9 |
7 |
0.01 |
1.0 |
20 |
77 |
0.004 |
ND1 |
| 10 |
7 |
0.01 |
1.0 |
20 |
77 |
0.001 |
ND1 |
| 11 |
4 |
80 |
500 |
20 |
25 |
4.228 |
Type II |
| 12 |
4 |
10 |
2000 |
20 |
98 |
4.117 |
ND1 |
| 13 |
7 |
0.01 |
0.001 |
20 |
85 |
0.004 |
ND1 |
| 14 |
7 |
0.1 |
0.001 |
20 |
83 |
0.219 |
Type I |
| 15 |
5 |
10 |
10 |
20 |
33 |
8.500 |
Type I+II |
| 16 |
6 |
10 |
10 |
20 |
17 |
8.008 |
Type I |
| 17 |
4 |
0.1 |
100 |
20 |
57 |
0.363 |
ND2 |
| 18 |
5 |
1.0 |
10 |
20 |
61 |
8.029 |
Type II |
| 19 |
5 |
5.0 |
0.5 |
20 |
29 |
5.232 |
Type II |
| 20 |
7 |
80 |
0.5 |
20 |
17 |
3.328 |
Type I |
| 21 |
4 |
0.1 |
1000 |
20 |
83 |
0.252 |
ND1 |
| 22 |
5 |
1.0 |
100 |
20 |
37 |
4.104 |
Type II |
| 23 |
6 |
1.0 |
0.1 |
20 |
37 |
2.367 |
Type I |
| 24 |
7 |
80 |
0.001 |
20 |
17 |
1.313 |
Type I |
| 25 |
5 |
10 |
1.0 |
20 |
14 |
8.307 |
Type II |
| 26 |
6 |
10 |
1.0 |
20 |
14 |
7.640 |
Type I |
| 27 |
5 |
0.1 |
1.0 |
20 |
89 |
0.683 |
ND1 |
| 28 |
6 |
0.1 |
1.0 |
20 |
89 |
0.566 |
ND1 |
| 29 |
4 |
10 |
1.0 |
20 |
22 |
6.577 |
Type II |
| 30 |
7 |
10 |
1.0 |
20 |
22 |
8.022 |
Type I |
| 31 |
4 |
0.1 |
1.0 |
20 |
73 |
0.509 |
Type II |
| 32 |
7 |
0.1 |
1.0 |
20 |
73 |
0.453 |
Type I |
| 33 |
5 |
1.0 |
1.0 |
20 |
44 |
2.626 |
ND1 |
| 34 |
4 |
0.1 |
10 |
20 |
44 |
0.210 |
Type II |
| 35 |
7 |
0.1 |
100 |
20 |
44 |
0.052 |
ND2 |
| 36 |
7 |
0.1 |
1000 |
20 |
44 |
0.019 |
ND1 |
| 37 |
7 |
10 |
100 |
20 |
19 |
5.263 |
ND1 |
| 38 |
7 |
10 |
1000 |
20 |
19 |
3.326 |
ND1 |
ND1: not determined because of weak fluorescence.
ND2: not determined because three fluorescence bands from the EUB mix, Type I, and Type II probes were simultaneously observed from the same cells.
The mineral solution comprised 5 mg L–1 CaCl2·2H2O, 33 mg L–1 MgCl2·6H2O; 16 mg L–1 KCl; 7.2 mg L–1 KNO3; 5.49 mg L–1 FeSO4·7H2O; 0.17 mg L–1 CoCl2·6H2O; 0.15 mg L–1 ZnSO4·7H2O; 0.06 mg L–1 H3BO3; 0.04 mg L–1 MnCl2·4H2O; 0.027 mg L–1 CuCl2·2H2O; 0.025mg L–1 Na2MoO4·2H2O; 0.013 mg L–1 AlCl3; 0.024 mg L–1 NiCl2 6H2O; 0.0017 mg L–1 Na2SeO4; 0.0033 mg L–1 Na2WO4·2H2O. Ammonium was added using NH4Cl. pH was adjusted using KH2PO4 (8.3–82.9 mg L–1), Na2HPO4 (197.5–19.8 mg L–1), and H2SO4.
Methane oxidation activity test
After MOB were enriched and methane oxidation rates had almost reached a steady state, methane oxidation activity tests were conducted on four biomass samples from Runs 29, 30, 31, and 32 to investigate the effects of the concentration of NH4+ and pH on MOB activity. Four samples, in which Type I or Type II MOB were predicted to be dominantly enriched, were selected as representatives of Type I and Type II MOB. Activity tests were performed using DHS reactors at methane concentrations of 10 and 0.1% directly after MOB enrichment. The concentrations of NH4+ in the test liquid were 0.1, 1.0, 10, 100, and 1,000 mg N L–1, and pH was set at 4, 5, 6, and 7. Therefore, 40 different conditions were applied for each biomass. Methane oxidation activity was evaluated from methane concentrations in the influent gas and off-gas, and GRT. The duration of tests was shortened as much as possible to prevent a microbial community change during activity testing. Five tests at the different NH4+ concentrations were conducted in 1 day. Moreover, on the next day, each DHS reactor was operated under the original enrichment condition, and the recovery of methane oxidation activity was assessed.
Analytical methods
The supply gas and off-gas were stored and collected in a gas bag (GL Science Aluminum bag), and methane concentrations were measured using a gas chromatograph equipped with a thermal conductivity detector (GC-8A; Shimadzu) for high concentration samples (Dinh et al., 2021) and a gas chromatograph equipped with a flame ionization detector (GC-2014; Shimadzu) for low concentration samples. The concentration of NH4+ was measured by Nessler’s method using a Hach spectrophotometer (DR2800; Hach) according to the manufacturer’s instructions. pH was measured using a pH meter.
Biomass sampling and microbial community analysis
Biomass sampling was conducted by squeezing the sponge carriers at the end of the operation, as previously described, to perform a microbial community analysis (Matsushita et al., 2020).
Fluorescence in situ hybridization (FISH)
During the FISH analysis, sample fixation and hybridization were conducted according to the procedure described by Awata et al. (2013). The EUB338, EUB338-II, and EUB338-III probes (Daims et al., 1999) labeled with Alexa Fluor 647 were used to evaluate all bacteria. Probes of Mγ84 and Mγ705 specific for Type I MOB and Mα450 detecting Type II MOB (Eller et al., 2001) were labeled with Cy3 or Alexa 488 depending on the combination of the probes used. Hybridized samples were observed using an epifluorescence microscope (Axio Imager M1; Carl Zeiss).
16S rRNA gene analysis
The collected biomass was washed with phosphate buffer. DNA was extracted using the FastDNA® SPIN Kit for Soil (MP Biomedicals) according to the manufacturer’s instructions.
PCR amplification of the 16S rRNA gene was conducted using the primer set containing 341' f (5′-CCTACGGGNGGCWGCAG-3′) and 805r (5′-GACTACHVGGGTATCTAATCC-3′) for the V3V4 regions, using One Shot LA PCR Mix Ver. 2.0 (Takara Bio). PCR was performed with an initial denaturation at 95°C for 5 min, followed by 30 cycles at 95°C for 30 s, at 58°C for 30 s, and at 72°C for 30 s; final extension was performed at 72°C for 5 min. PCR products were purified using Agencourt AMPure XP (Beckman Coulter) and sequenced using Roche GS Junior (454 Life Sciences) at Hokkaido System Science.
Regarding samples with insufficient PCR products, second PCR was performed with TaKaRa Ex Taq®️ Hot Start Version (Takara Bio). Reaction conditions were as follows: initial denaturation at 94°C for 2 min, followed by 30 cycles at 94°C for 30 s, at 50°C for 30 s, and at 72°C for 30 s; final extension was performed at 72°C for 5 min. PCR products were purified using the same procedure and sequenced using the Illumina MiSeq platform with MiSeq reagent kit v3 (Illumina) at Bioengineering Lab.
To specifically amplify the 16S rRNA gene of Type I MOB, the FISH probes of Mγ84f and Mγ705r specific for Type I were used as primers. Using two newly designed primer sets of Mγ84f (5′-TCGGGCGCTGACGAGTGG-3′)/341'r (5′-CTGCWGCCNCCCGTAGG-3′) and 341 ' f (5′-CCTACGGGNGGCWGCAG-3′)/Mγ705r (5′-CTGGTGTTCCTTCAGATC-3′), PCR was performed on DNA samples from Runs 1 and 5 using TaKaRa Ex Taq®️ Hot Start Version by an initial denaturation at 94°C for 2 min, followed by 30 cycles at 94°C for 30 s, at 59 or 50°C for 30 s, and at 72°C for 30 s; final extension was performed at 72°C for 5 min. PCR products were purified and sequenced using the Illumina MiSeq platform with the MiSeq reagent kit v3 at Bioengineering Lab.
Particulate methane monooxygenase gene pmoA analysis
The pmoA gene was amplified using the primer set of A189f (5′-GGNGACTGGGACTTCTGG-3′) and mb661r (5′-CCGGMGCAACGTCYTTACC-3′) (McDonald et al., 2008). PCR was performed using One Shot LA PCR Mix Ver. 2.0 by an initial denaturation at 95°C for 5 min, followed by 25–45 cycles at 95°C for 30 s, at 50°C for 30 s, and at 72°C for 1 min; final extension was performed at 72°C for 5 min. PCR products were sequenced using the Illumina MiSeq platform with MiSeq reagent kit v3 at Kanazawa University.
Phylogenetic analysis
Raw sequence data were trimmed using Cutadapt software (version 1.18) (Parada et al., 2016) to remove primers from the sequence reads, as previously described (Dinh et al., 2022). Clean reads were analyzed using QIIME 2 Core 2020.8 (Bolyen et al., 2019). Operational taxonomic units (OTUs)were grouped using the pipeline software DADA2 (Callahan et al., 2016) with the SILVA (release_132) database (Pruesse et al., 2012; Quast et al., 2013; Yilmaz et al., 2014) and pmoA gene database (Dumont et al., 2014). Sequence data were deposited in the DNA Data Bank of Japan (DDBJ) database under DDBJ/EMBL/GenBank accession number DRA012996.
Results
Time course of methane oxidation and enrichment of MOB
MOB were successfully enriched for all 38 runs operated under different conditions, as shown in Table 1. The respective methane oxidation rates based on the sponge volume (Rm) increased with time and almost reached a stationary state at the end of the cultivation period (Fig. S1). However, the time required to achieve a plateau and the maximum Rm at that time markedly differed among the 38 runs (Table 1). The biomass gradually growing on the sponges was visually observed with increasing Rm. Biomass colors varied across the runs and included orange, white, and black (Fig. 1 and S3).
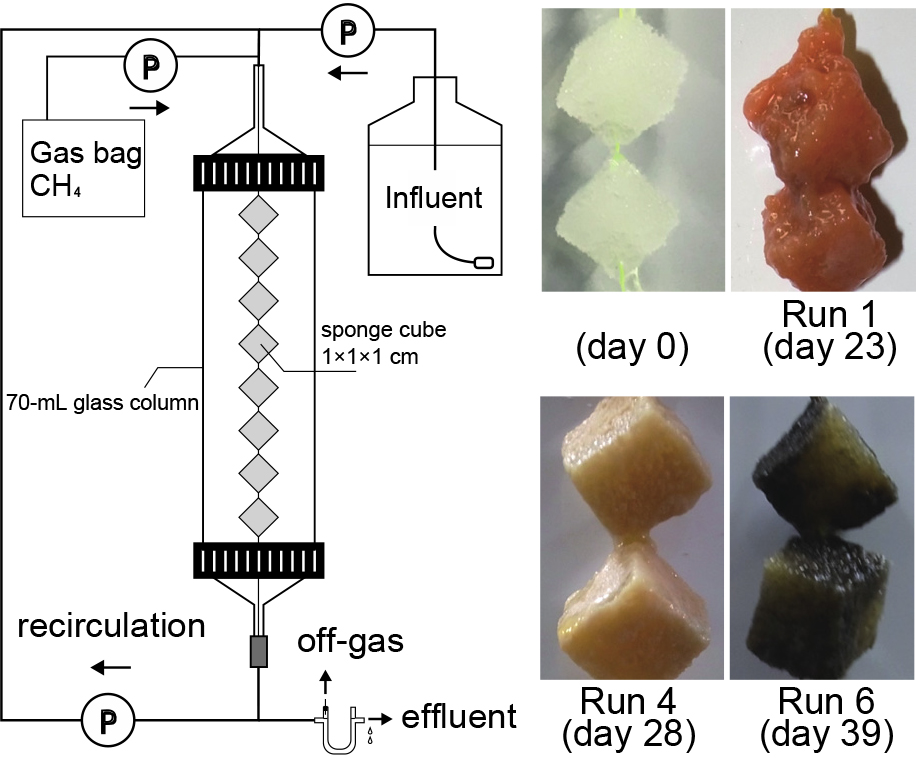
Fig. 2 shows the time course of Rm for five runs as an example. Run 1, operated at a high methane concentration of 10%, had a high Rm with a maximum of 7.37 g CH4 L–1 d–1, even for a short operation period. In contrast, Rm in Run 9 at a very low methane concentration of 0.01% exhibited a very low Rm with a maximum of 0.004 g CH4 L–1 d–1, and the operation period had to be prolonged to 77 days for the enrichment of MOB with sufficient biomass sampling. Rm in the stationary state slightly increased with higher methane concentrations up to 10% (Fig. S2). Since a higher methane concentration (80%) may slightly inhibit MOB activity, the enrichment of MOB was performed even under conditions of very low methane concentrations; however, longer operations were necessary.

As methane was consumed in the reactor, a difference was observed between the provided gas and off-gas. We carefully increased the methane loading rate during the operation of the reactor by gradually reducing GRT in a manner than depended on the amount of methane consumed in order to maintain a small difference. Therefore, the off-gas concentration for all runs was maintained within 65–95% of the provided gas concentration (Table S1). Regarding the liquid, a short HRT was also maintained to keep the pH and NH4+ concentration constant in the reactor, thereby retaining these values in the effluent. A vertical concentration gradient did not occur for the liquid or gas in the reactor because high recirculation was performed, implying that methane concentrations in the reactor were the same as those in the effluent and off-gas. Therefore, the enrichment of MOB was successfully conducted as planned under different environmental conditions.
The dominant MOB type identified by FISH
FISH was performed to investigate whether the dominant MOB enriched belonged to Type I or Type II. Two probes, Mγ84 and Mγ705, specific for Type I, and the probe Mα450 specific for Type II were used with the mixed universal eubacterial probes of EUB 338 (referred to as EUB mix) labeled with Alexa 647 (blue). A combination of Type I-targeting probes labeled with Alexa 555 (red) and a Type II-targeting probe labeled with Alexa 488 (green) was applied. In the biomass sample from Run 1, the dominant MOB were Type I because fluorescence from Type I and EUB mix was detected from the same cells, as shown in Fig. 3A. However, difficulties were associated with identifying some samples as Type I or II because the multi-pseudocolor of fluorescence was occasionally unclear. Therefore, to confirm the type, a second FISH analysis was conducted at different fluorescence combinations, where Alexa 555 and Alexa 488 were exchanged. After the second FISH, the dominant MOB from Run 1 were classified as Type I (Fig. 3B). Therefore, we confirmed that Type I MOB were enriched in Run 1 based on the results of two FISH assays. Similarly, the dominant MOB type was identified in 25 samples, as shown in Table 1 and Fig. S4. However, it was challenging to identify the dominant MOB in the remaining 13 samples for the following reasons: 1) fluorescence from MOB was weak, and 2) three fluorescence bands from EUB mix, Type I, and Type II probes were simultaneously detected from the same fields (Table 1 and Fig. S4), which are discussed in more detail below.

The enrichment of MOB was conducted under a wide range of conditions: pH 4–7; methane 0.01–80%; NH4+ 0.001–2,000 mg N L–1. These three environmental factors influence the MOB type enriched. To identify the crucial factors influencing the MOB type, we created a unique and at-a-glance figure to recognize the complex relationships among the type, pH, methane concentration, NH4+ concentration, and mole ratio of NH4+ to dissolved methane (NH4+/CH4), as shown in Fig. 4. The dominant MOB type was separated depending on pH, except for unjudged runs, suggesting that pH was the crucial factor governing the MOB type. Type II dominated at low pH (4–5), while Type I was dominant at near-neutral pH (6–7). Both types were detected in Run 15 enriched at pH 5, plotted in the vicinity of the boundary splitting the dominant types.
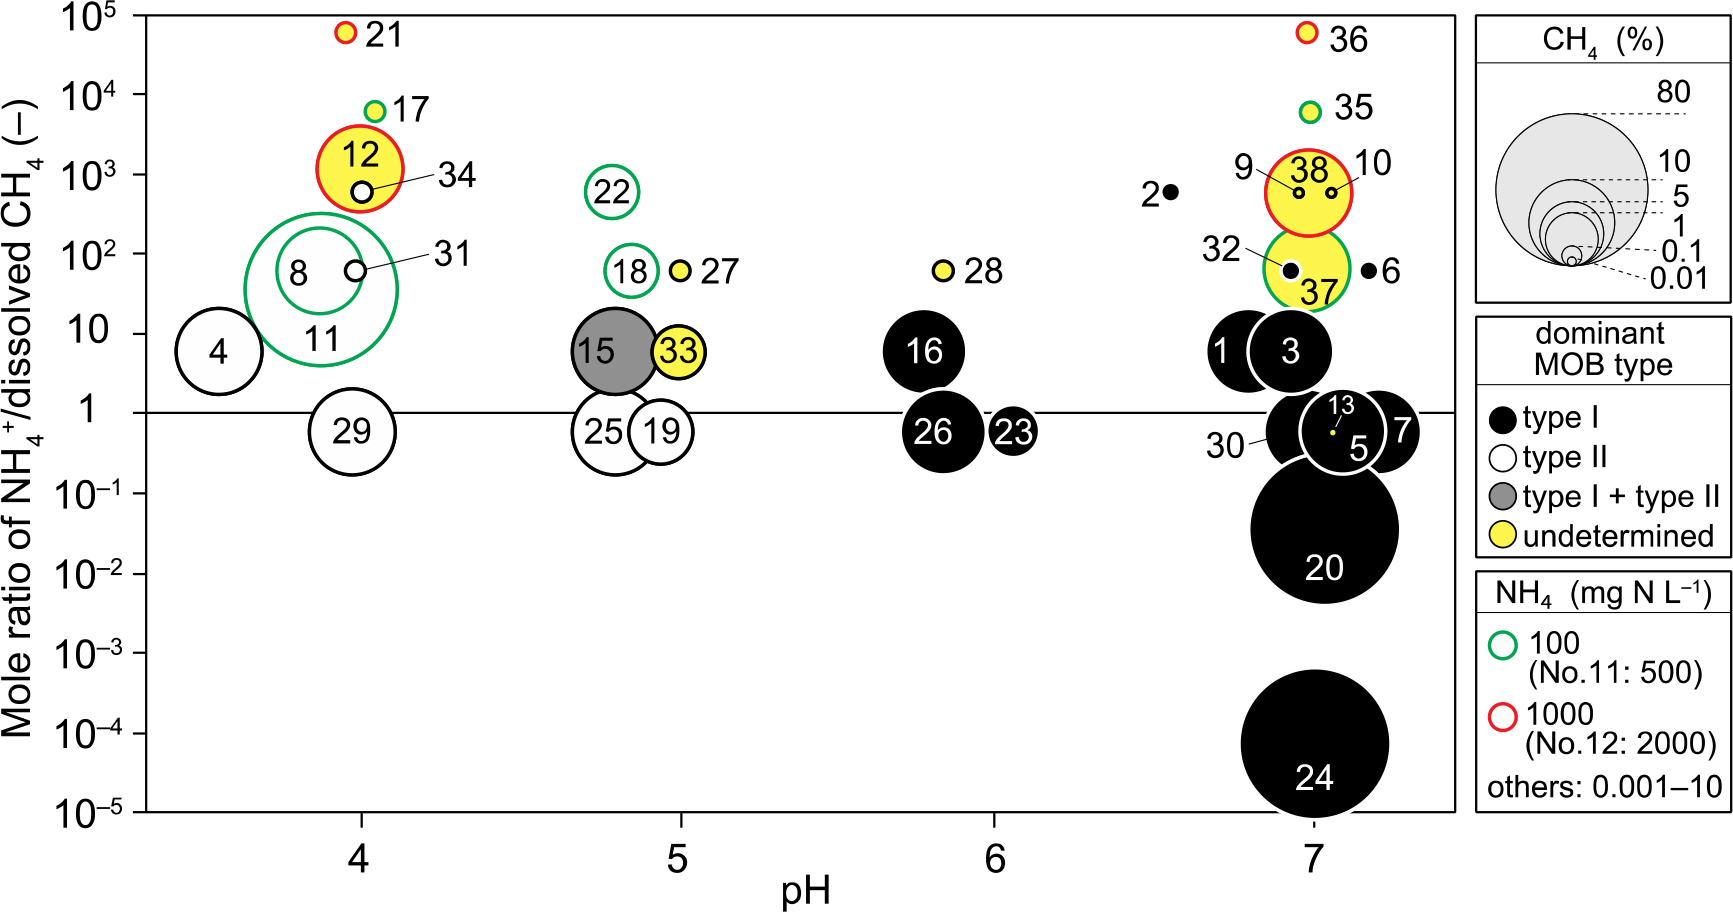
Regarding runs in which the dominant MOB type was not identified, some characteristics were found in the operational conditions. Among 13 of these samples, 12 were enriched under the conditions of a higher NH4+/CH4 ratio with very high NH4+ concentrations. The effect of the high NH4+/CH4 ratio was significant at pH 7, at which the identification of the MOB type was not performed at a ratio of 10. However, even though the NH4+/CH4 ratio was very high, identification was possible for Runs 2, 6, and 32 when NH4+ concentrations were not high. In addition, even when the CH4 concentration was very low (0.01%) in Runs 9, 10, and 13, it was impossible to identify the dominant type. These results suggest that unknown MOB, undetectable by a FISH analysis, were cultivated under the conditions of very high NH4+ concentrations and very low CH4 concentrations. Therefore, although pH was the crucial factor governing the enriched MOB type, NH4+ and CH4 concentrations were also important.
Effects of pH and NH4+ on the methane oxidation rate, Rm
As described above, the type of enriched MOB was clearly dependent on the pH condition. If the optimum pH of MOB activity differs between Types I and II, the reason the enriched type was separated at pH 5–6 may be explained. Therefore, the respective methane oxidation rates of Types I and II were investigated under widely different pH conditions. Four biomass samples from Runs 29, 30, 31, and 32 were employed for this investigation because the dominant types in these runs were clearly identified using FISH. The representatives of Type I samples were Runs 30 and 32, which were conducted at pH 7 with methane concentrations of 10 and 0.1%, respectively. In contrast, for Type II, samples from Runs 29 and 31 were used, which were enriched at pH 4 with methane concentrations of 10 and 0.1%, respectively.
Fig. 5 shows the influence of pH on the methane oxidation rate, Rm at the two different methane concentrations of 10 and 0.1% with a low NH4+ concentration of 0.1 mg N L–1, applied to prevent NH4+-mediated inhibition. No significant differences were observed between the Rm values of the Type I biomass from Run 30 and the Type II biomass from Run 29 (Fig. 5a). However, a marked difference was noted under the influence of pH. In the Type I biomass, Rm slightly declined with a decrease in pH, with the highest value being obtained at pH 7. In contrast, Rm of the Type II biomass had an optimum pH of 6 and markedly decreased at pH 7. In other words, the Rm values of Type I and Type II biomass samples crossed at pH 4–7 under a methane concentration of 10%. This influence of pH on Rm was also observed for the biomass samples from Runs 31 and 32, which were conducted using a methane concentration of 0.1% (Fig. 5b). Even at significantly different methane concentrations of 0.1 and 10%, the same phenomenon was observed for the influence of pH, suggesting that the affinities of Types I and II MOB for CH4 were similar. Consequently, Type I MOB appear to be preferentially enriched under neutral pH conditions, and Type II under acidic conditions, which strongly supports the results of the FISH analysis and may be explained by the characteristics of Type I and Type II MOB.

The inhibition of ammonium was observed in the cultivation of MOB because Rm at the stationary stage appeared to decrease with increasing concentrations of NH4+ (Fig. S2). If the intensity of the inhibition of ammonium markedly differs between Types I and II, it will influence the dominant type. Therefore, the influence of NH4+ concentrations on Rm was also investigated using four biomass samples from Runs 29, 30, 31, and 32. Rm was estimated under the conditions of pH 4–7, NH4+ concentrations of 0.1–1,000 mg N L–1, and a methane concentration of 0.1%. Since the inhibition of ammonium is competitive with methane, the mole ratio of NH4+/dissolved CH4 was applied to evaluate the effects of inhibition. Fig. 6 shows Rm versus the NH4+/CH4 ratio. Rm steadily decreased with an increase in the NH4+/CH4 ratio in all four biomass samples at any pH. Moreover, the degradation of Rm was marked at pH 7, with a decrease of approximately 30–95% from the maximum value. This negative effect of the NH4+/CH4 ratio was also detected while investigating the influence of a high methane concentration (10%) on Rm (Fig. S5). High NH4+ concentrations were found to inhibit the activities of both Type I and Type II MOB, and the intensity of inhibition was similar at any pH.

Differences in affinity for CH4 and the intensity of NH4+ inhibition were small between Type I and Type II MOB. In contrast, the optimum pH of Rm markedly differed. Therefore, the enriched MOB type may only be governed by pH conditions, even though NH4+ concentrations had a significant negative impact on MOB activity.
Microbial analysis
In addition to the FISH analysis, other microbial community analyses were performed to obtain more detailed information on the microbial population structures based on 16S rRNA and the functional pmoA gene using the primer sets 341'f/805r and A189f/mb661r, respectively. The number of reads is shown in Table S3, and the results of microbial analyses in Fig. 7, S6, S7, and S8. The dominant MOB were estimated to be Type II for the majority of samples (Fig. 7, S7, and S8), which was completely different from the results of the FISH analysis. Even though MOB in Runs 1 and 5 were classified as Type I by the FISH analysis, they were estimated to be Type II by both pmoA and 16S rRNA gene analyses. We speculated that the detection of Type I MOB may be difficult by PCR with the primer sets used for some samples.
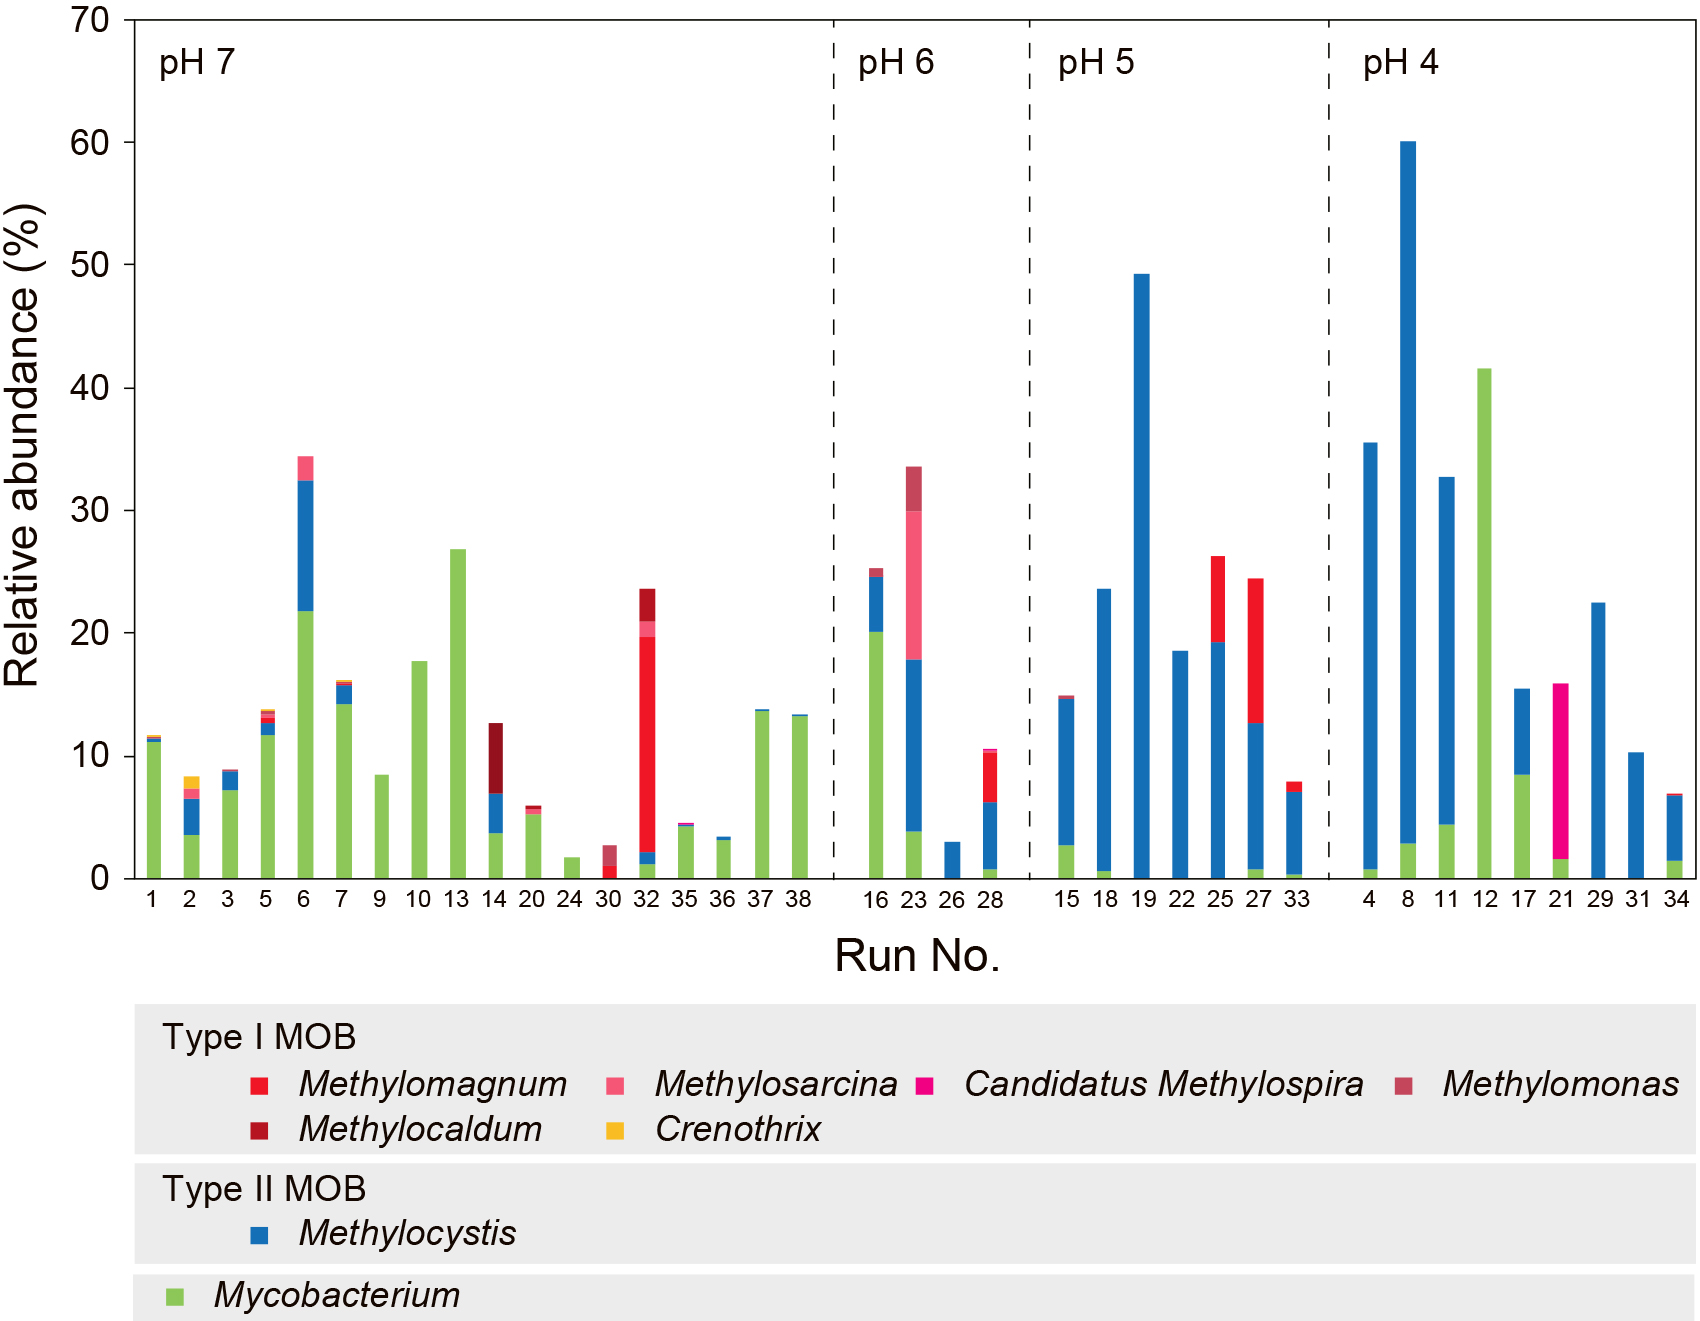
Therefore, we also conducted a 16S rRNA gene analysis using two newly designed primer sets, Mγ84f/341'r and 341'f/Mγ705r, in which the sequences of Mγ84 and Mγ705 were used as FISH probes targeting Type I, and applied to the samples of Runs 1 and 5. The results obtained showed that Methylomonas and Methylomagnum of MOB Type I were dominant, as expected (Table S2). Consequently, the results of pmoA and 16S rRNA gene analyses may have a large bias derived from PCR amplification depending on the primer sets.
Discussion
The FISH analysis conducted in the present study revealed that pH was a crucial factor governing the MOB type enriched, with Type II appearing at low pH of 4–5 and Type I being dominant at neutral pH of 6–7. The present results on the effects of pH on the MOB type are consistent with previous findings. Dedysh et al. (2001; 2003) reported that the dominant MOB under acidic pH, such as in forests and peats, were Type II, with Type I accounting for less than 1%. Type I MOB were reportedly detected at neutral pH of 6.5–7.5 (Shrestha et al., 2010; Gupta et al., 2012). Type I and Type II MOB were both shown to be enriched around the pH boundary that separates the two types of MOB. Hatamoto et al. (2011) found that the dominant MOB were Type II in a DHS reactor, cultivated at pH 5.5 under a low methane concentration. Even at a similar pH of 5.6, Noorain et al. (2019) showed that Type I MOB were dominantly cultivated in a DHS reactor at a high methane concentration. At a pH of approximately 5.5, the dominant MOB type was unclear because of the very small difference in the methane consumption rates of Type I and Type II MOB with weak pH dependency, as shown in Fig. 5.
However, the findings of other studies contradict the present results. Even at neutral pH, Type I and Type II MOB have both been detected (e.g.
Hatamoto et al., 2010; Pfluger et al., 2011; Matsuura et al., 2017), with the identification of the MOB type being based on the pmoA gene using the primer set of A189f/mb661r. Although Bourne et al. (2001) reported that the primer set of A189f/mb661r was superior to A189f/A682r and A189f/A650r for the wide detection of diverse MOB, Cai et al. (2020) indicated that Methylocystis of Type II MOB may be preferentially detected in a microbial analysis using A189f/mb661r. These findings suggest that the results of microbial analyses are strongly dependent on the selection of primer sets. In the present study, the effects of pH dependency were derived from a FISH analysis. Therefore, the discrepancy between the present results and previous findings on dominant MOB may be attributed to the different methods used for analyses.
Ammonium inhibits MOB activity (Whittenbury et al., 1970; Carlsen et al., 1991; Dunfield and Knowles, 1995) because its molecular structure is very similar to that of methane, resulting in the competitive inhibition of methane monooxygenase. The inhibition of methane oxidation due to ammonium was also observed in the present study. Therefore, we hypothesized that ammonium may affect the type of MOB enriched. Mohanty et al. (2006) reported that ammonium stimulated methane consumption by Type I MOB in rice field soils, while the enrichment of Type II MOB was inhibited. However, the present results showed that ammonium did not affect the enriched MOB type over a wide range of concentrations because the methane oxidation rates of Type I (Runs 30 and 32) and Type II (Runs 29 and 31) MOB were similarly affected by the mole ratio of NH4+/dissolved CH4 (Fig. 6 and S5).
Although methane consumption was observed even for runs even under a very low methane concentration (0.01%=100 ppm), high NH4+/CH4 ratio, and very high NH4+ concentrations of more than 2,000 mg N L–1, MOB in these biomass samples were undetectable by FISH using the probes Mγ84, Mγ705, and Mα450 (Table 1). Therefore, unknown MOB that cannot be detected using conventional probes may exist.
Regarding MOB utilizing methane even at low concentrations, Methylocystis sp. strain SC2 was shown to exhibit activity in a methane concentration range of 1.75 to 100 ppm, with two isozymes of methane monooxygenase with different methane oxidation kinetics, pmoA1, which has low affinity for methane, and pmoA2, which has high affinity (Baani and Liesack, 2008). Previous studies reported a role for the pmoA2 gene in atmospheric methane consumption in forests (Kravchenko et al., 2010) and paddy soils (Cai et al., 2016). In addition, uncultivated MOB affiliated with the USCα and USCγ groups were shown to be involved in the oxidation of atmospheric methane (Kolb, 2009). Tveit et al. (2019) successfully isolated Methylocapsa gorgona MG08 belonging to USCα, the first MOB capable of not only consuming atmospheric methane, but also growing on it. These findings and the present results suggest that the diversity of MOB is also derived from various affinities for methane.
Ammonia-oxidizing bacteria (AOB) were detected in several runs, specifically at pH 7 (Fig. S7). AOB slightly oxidize methane because ammonia monooxygenase, a key enzyme in nitrification, is phylogenetically very close to methane monooxygenase (Jones and Morita, 1983; Bédard and Knowles, 1989). We considered the possibility of methane removal by AOB in runs performed under high NH4+/CH4 conditions at least once. However, the methane oxidation activity of AOB is generally very low (Bédard and Knowles, 1989), and Rm at a high NH4/CH4 ratio was similar to that at other ratios (Table 1). Furthermore, AOB were not detected at pH 4 because their enrichment is typically impossible in a highly acidic environment.
In the runs performed at very high NH4+ concentrations corresponding to a high NH4/CH4 ratio, Mycobacterium was dominant. The abundance of Mycobacterium was 41.6% in Run 12 enriched at an NH4+ concentration of 2,000 mg N L–1 from the 16S rRNA gene analysis, while no MOB were detected, even in the FISH analysis. Reed and Dugan (1987) initially reported that Mycobacterium ID-Y oxidized methane. However, to the best of our knowledge, there is currently no evidence to support methane oxidation by Mycobacterium. Mycobacterium chubuense stain NBB4 was shown to metabolize the alkanes and alkenes of C2 to C4 using a soluble methane monooxygenase-like enzyme (Martin et al., 2014). Since this enzyme is phylogenetically close to the conventional methane monooxygenase, some species possessing specific types of the enzyme may oxidize methane; however, only Reed and Dugan (1987) reported methane oxidation by Mycobacterium.
Since methane provided in the present experiments was the sole organic carbon source, bacteria highly enriched with a dominance of more than 40% appeared to utilize methane, indicating that the enriched Mycobacterium is a methanotroph. Furthermore, the Mycobacterium detected grew even at very high NH4+ concentrations, at which common MOB are inhibited. Further studies are needed to establish whether the new MOB implied by the present results exist in the genus Mycobacterium.
Citation
Kambara, H., Shinno, T., Matsuura, N., Matsushita, S., Aoi, Y., Kindaichi, T., et al. (2022) Environmental Factors Affecting the Community of Methane-oxidizing Bacteria. Microbes Environ 37: ME21074.
https://doi.org/10.1264/jsme2.ME21074
Acknowledgements
This research was supported by the Japan Society for the Promotion of Science (JSPS) through a Grant-in-Aid for Scientific Research (grant number 17H01300).
We would like to thank Editage (www.editage.jp) for English language editing.
References
- Amaral, J.A., and Knowles, R. (1995) Growth of methanotrophs in methane and oxygen counter gradients. FEMS Microbiol Lett
126: 215–220.
- Awata, T., Oshiki, M., Kindaichi, T., Ozaki, N., Ohashi, A., and Okabe, S. (2013) Physiological characterization of an anaerobic ammonium-oxidizing bacterium belonging to the “Candidatus Scalindua” group. Appl Environ Microbiol
79: 4145–4148.
- Baani, M., and Liesack, W. (2008) Two isozymes of particulate methane monooxygenase with different methane oxidation kinetics are found in Methylocystis sp. strain SC2. Proc Natl Acad Sci U S A
105: 10203–10208.
- Bédard, C., and Knowles, R. (1989) Physiology, biochemistry, and specific inhibitors of CH4, NH4+, and CO oxidation by methanotrophs and nitrifiers. Microbiol Rev
53: 68–84.
- Bolyen, E., Rideout, J.R., Dillon, M.R., Bokulich, N.A., Abnet, C.C., Al-Ghalith, G.A., et al. (2019) Reproducible, interactive, scalable and extensible microbiome data science using QIIME 2. Nat Biotechnol
37: 852–857.
- Bourne, D.G., McDonald, I.R., and Murrell, J.C. (2001) Comparison of pmoA PCR primer sets as tools for investigating methanotrophs diversity in three Danish soils. Appl Environ Microbiol
67: 3802–3809.
- Cai, Y., Zheng, Y., Bodelier, P.L.E., Conrad, R., and Jia, Z. (2016) Conventional methanotrophs are responsible for atmospheric methane oxidation in paddy soils. Nat Commun
7: 11728.
- Cai, Y., Zhou, X., Shi, L., and Jia, Z. (2020) Atmospheric methane oxidizer are dominated by upland soil cluster alpha in 20 forest soils of China. Microb Ecol
80: 859–871.
- Callahan, B.J., McMurdie, P.J., Rosen, M.J., Han, A.W., Johnson, A.J.A., and Holmes, S.P. (2016) DADA2: High-resolution sample inference from illumine amplicon data. Nat Methods
13: 581–583.
- Carlsen, H.N., Joergensen, L., and Degn H. (1991) Inhibition by ammonia of methane utilization in Methylococcus capsulatus (Bath). Appl Microbiol Biotechnol
35: 124–127.
- Conrad, R. (2009) The global methane cycle: recent advances in understanding the microbial processes involved. Environ Microbiol Rep
1: 285–292.
- Daims, H., Brühi, A., Amann, R., Schleifer, K.H., and Wagner, M. (1999) The domain-specific probe EUB338 is insufficient for the detection of all bacteria: development and evaluation of a more comprehensive probe set. Syst Appl Microbiol
22: 434–444.
- Dalton, H. (1977) Ammonia oxidation by the methane oxidizing bacterium Methylococcus capsulatus. Arch Microbiol
114: 273–279.
- Dedysh, S.N., Derakshani, M., and Liesack, W. (2001) Detection and enumeration of methantrophs in acidic sphagnum peat by 16S rRNA fluorescence in situ hybridization, including the use of newly developed oligonucleotide probes for Methylocella palustris. Appl Environ Microbiol
67: 4850–4857.
- Dedysh, S.N., Dunfield, P.F., Derakshani, M., Stubner, S., Heyer, J., and Liesack, W. (2003) Differential detection of type II methanotrophic bacteria in acidic peatlands using newly developed 16S rRNA-targeted fluorescent oligonucleotide probes. FEMS Microbiol Ecol
43: 299–308.
- Dinh, H.T.T., Kambara, H., Harada, Y., Matsushita, S., Aoi, Y., Kindaichi, T., et al. (2021) Bioelectrical methane production with an ammonium oxidative reaction under the no organic substance condition. Microbes Environ
36: ME21007.
- Dinh, H.T.T., Kambara, H., Matsushita, S., Aoi, Y., Kindaichi, T., Ozaki, N., and Ohashi, A. (2022) Biological methane production coupled with sulfur oxidation in amicrobial electrosynthesis system without organic substrates. J Environ Sci (Beijing, China)
116: 68–78.
- Dumont, M.G., Lüke, C., Deng, Y., and Frenzel, P. (2014) Classification of pmoA amplicon pyrosequences using BLAST and the lowest common ancestor method in MEGAN. Front Microbiol
5: 34.
- Dunfield, P., and Knowles, R. (1995) Kinetics of inhibition of methane oxidation by nitrate, nitrite, and ammonium in a humisol. Appl Environ Microbiol
61: 3129–3135.
- Eller, G., Stubner, S., and Frenzel, P. (2001) Group-specific 16S rRNA targeted probes for the detection of type I and type II methanotrophs by fluorescence in situ hybridization. FEMS Microbiol Lett
198: 91–97.
- Ettwig, K.F., van Alen, T., van de Pas-Schoonen, K.T., Jetten, M.S.M., and Strous, M. (2009) Enrichment and molecular detection of denitrifying methanotrophic bacteria of the NC10 phylum. Appl Environ Microbiol
75: 3656–3662.
- Graham, D.W., Chaudhary, J.A., Hanson, R.S., and Arnold, R.G. (1993) Factors affecting competition between type I and type II methanotrophs in two-organism, continuous-flow reactors. Microb Ecol
25: 1–17.
- Gupta, V., Smemo, K.A., Yavitt, J.B., and Basiliko, N. (2012) Active methanotrophs in two contrasting north American peatland ecosystems revealed using DNA-SIP. Microb Ecol
63: 438–445.
- Hanson, R.S., and Hanson, T.E. (1996) Methanotrophic bacteria. Microbiol Rev
60: 439–471.
- Hatamoto, M., Yamamoto, H., Kindaichi, T., Ozaki, N., and Ohashi, A. (2010) Biological oxidation of dissolved methane in effluents from anaerobic reactors using a down-flow hanging sponge reactor. Water Res
44: 1409–1418.
- Hatamoto, M., Koshiyama, Y., Kindaichi, T., Ozaki, N., and Akiyoshi, O. (2011) Enrichment and identification of methane-oxidizing bacteria by using down-flow hanging sponge bioreactors under low methane concentration. Ann Microbiol
61: 683–687.
- Hutton, W.E., and Zobell, C.E. (1953) Production of nitrite from ammonia by methane oxidizing bacteria. J Bacteriol
65: 216–219.
- Imachi, H., Nobu, M.K., Nakahara, N., Morono, Y., Ogawara, M., Takaki, Y., et al. (2020) Isolation of an archaeon at the prokaryote-eukaryote interface. Nature
577: 519–525.
- Jones, R.D., and Morita, R.Y. (1983) Methane oxidation by Nitrosococcus oceanus and Nitrosomonas europaea. Appl Environ Microbiol
45: 401–410.
- Khmelenina, V.N., Shchukin, V.N., Reshethikov, A.S., Mustakhimov, I.I., Suzina, N.E., Eshinimaev, B.Ts., and Trotsenko, Y.A. (2010) Structure and functional features of methanotrophs from hypersaline and alkaline lakes. Microbiol
79: 472–482.
- King, G.M., and Schnell, S. (1994) Ammonium and nitrite inhibition of methane oxidation Methylobacter albus BG8 and Methylosinus trichosporium OB3b at low methane concentrations. Appl Environ Microbiol
60: 3508–3513.
- Knief, C., Vanitchung, S., Harvery, N.W., Conrad, R., Dunfield, P.F., and Chidthaisong, A. (2005) Diversity of methanotrophic bacteria in tropical upland soils under different land uses. Appl Environ Microbiol
71: 3826–3831.
- Kolb, S. (2009) The quest for atmospheric methane oxidizers in forest soils. Environ Microbiol Rep
1: 336–346.
- Kravchenko, I.K., Kizilova, A.K., Bykova, S.A., Menko’ko, E.V., and Gal’chenko, V.F., (2010) Molecular analysis of high-affinity methane-oxidizing enrichment cultures isolated from a forest biocenosis and agrocenoses. Microbiology
79: 106–114.
- Kravchenko, I., and Sukhacheva, M. (2017) Methane oxidation and diversity of aerobic methanotrophs in forest and agricultural soddy-podzolic soils. Appl Soil Ecol
119: 267–274.
- Lüke, A., and Frenzel, P. (2011) Potential of pmoA amplicon pyrosequencing for methanotrophs diversity studies. Appl Environ Microbiol
77: 6305–6309.
- Martin, K.E., Ozsvar, J., and Coleman, N.V. (2014) SmoXYB1C1Z of Mycobacterium sp. strain NBB4: a soluble methane monooxygenase (sMMO)-like enzyme, active on C2 to C4 alkanes and alkenes. Appl Environ Microbiol
80: 5801–5806.
- Matsushita, S., Komizo, D., Cao, L.T.T., Aoi, T., Kindaichi, T., Ozaki, N., et al. (2018) Production of biogenic manganese oxides coupled with methane oxidation in a bioreactor for removing metals from wastewater. Water Res
130: 224–233.
- Matsushita, S., Hiroe, T., Kambara, H., Shoiful, A., Aoi, Y., Kindaichi, T., et al. (2020) Anti-bacteria effects of MnO2 on the enrichment of manganese-oxidizing bacteria in downflow hanging sponge reactors. Microbes Environ
35: ME20052.
- Matsuura, N., Hatamoto, M., Yamaguchi, T., and Ohashi, A. (2017) Methanotrophic community composition based on pmoA genes in dissolved methane recovery and biological oxidation closed downflow hanging sponge reactors. Biochem Eng J
124: 138–144.
- McDonald, I.R., Bodrossy, L., Chen, Y., and Murrell, J.C. (2008) Molecular ecology techniques for the study of aerobic methanotrophs. Appl Environ Microbiol
74: 1305–1315.
- Mohanty, S.R., Bodelier, P.L.E., Floris, V., and Conrad, R. (2006) Differential effects of nitrogenous fertilizers on methane-consuming microbes in rice field and forest soils. Appl Environ Microbiol
72: 1346–1354.
- Nisbet, E.G., Manning, M.R., Dlugokencky, E.J., Fisher, R.E., Lowry, D., Michel, S.E., et al. (2019) Very strong atmospheric methane growth in the 4 years 2014–2017: implications for the Paris Agreement. Global Biogeochem Cycles
33: 318–342.
- Noorain, R., Kindaichi, T., Ozaki, N., Aoi, Y., and Ohashi, A. (2019) Integrated biological-physical process for biogas purification effluent treatment. J Environ Sci
83: 110–122.
- Nyerges, G., and Stein, Y.L. (2009) Ammonia cometabolism product inhibition vary considerably among species of methanotrophic bacteria. FEMS Microbiol Lett
297: 131–136.
- Nyerges, G., Han, S., and Stein, Y.L. (2010) Effects of ammonium and nitrite on growth and competitive fitness of cultivated methanotrophic bacteria. Appl Environ Microbiol
76: 5648–5651.
- O’Neill, J.G., and Wilkinson, J.F. (1977) Oxidation of ammonia by methane-oxidizing bacteria and the effects of ammonia on methane oxidation. J Gen Microbiol
100: 407–412.
- Parada, A.E., Needham, D.M., and Fuhrman, J.A. (2016) Every base matters: assessing small subunit rRNA primers for marine microbiomes with mock communities, time series and global field samples. Environ Microbiol
18: 1403–1414.
- Pfluger, A.R., Wu, W., Pieja, A.J., Wan, J., Rostkowski, K.H., and Criddle, C.S. (2011) Selection of Type I and Type II methanotrophic proteobacteria in a fluidized bed reactor under non-sterile conditions. Bioresour Technol
102: 9919–9926.
- Pol, A., Heijmans, K., Harhangi, H.R., Tedesco, D., Jetten, M.S.M., and Op den Camp, H.J.M. (2007) Methanotrophy below pH1 by a new verrucomicrobia species. Nature
450: 874–879.
- Pruesse, E., Peplies, J., and Glöckner, F.O. (2012) SINA: accurate high-throughput multiple sequence alignment of ribosomal RNA genes. Bioinformatics
28: 1823–1829.
- Quast, C., Pruesse, E., Yilmaz, P., Gerken, J., Schweer, T., Yarza, P., et al. (2013) The SILVA ribosomal RNA gene database project: improved data processing and web-based tools. Nucleic Acids Res
41: D590–D596.
- Reed, W.M., and Dugan, P.R. (1987) Isolation and characterization of the facultative methylotroph Mycobacterium ID-Y. J Gen Microbiol
133: 1389–1395.
- Schimel, J. (2000) Rice, microbes and methane. Nature
403: 375–377.
- Shrestha, M., Shrestha, P.M., Frenzel, P., and Conrad, R. (2010) Effect of nitrogen fertilization on methane oxidation, abundance, community structure, and gene expression of methanotrophs in the rice rhizosphere. ISME J
4: 1545–1556.
- Steudler, P.A., Bowden, R.D., Melillo, J.M., and Aber, J.D. (1989) Influence of nitrogen fertilization on methane uptake in temperate forest soils. Nature
341: 314–316.
- Tveit, A.T., Hestnes, A.G., Robinson, S.L., Schintlmeister, A., Dedysh, S.N., Jehmlich, N., et al. (2019) Widespread soil bacterium that oxidizes atmospheric methane. Proc Natl Acad Sci U S A
116: 8515–8524.
- Whittenbury, R., Phillips, K.C., and Wilkinson, J.F. (1970) Enrichment, isolation and some properties of methane-utilizing bacteria. J Gen Microbiol
61: 205–218.
- Yilmaz, P., Parfrey, L.W., Yarza, P., Gerken, J., Pruesse, E., Quast, C., et al. (2014) The SILVA and “all-species living tree project (LTP)” taxonomic frameworks. Nucleic Acids Res
42: D643–D648.