Abstract
Gut dysbiosis and changes in short-chain fatty acids (SCFAs) occur in end-stage chronic kidney disease (CKD); however, the degree of these changes in the gut microbiome and serum SCFA profiles in the early stages of CKD, particularly in CKD of unknown etiology (CKDu), is unclear. We herein investigated the gut microbiome and SCFA profiles of early-stage CKD patients (CKD stages 1–3) in a community in Khon Kaen Province, Thailand. Seventy-two parasite-free participants were distributed among a healthy control group (HC, n=18) and three patient groups (an underlying disease group [UD, n=18], early-stage CKD with underlying disease [CKD-UD, n=18], and early-stage CKD of unknown etiology, [CKDu, n=18]). Fecal DNA was individually extracted and pooled for groups of six individuals (three pools in each group) to examine the composition of the gut microbiome using next-generation sequencing. A SCFA analysis was performed on serum samples from each individual using gas chromatography-mass spectrometry. The results revealed that microbial abundance differed between the healthy group and all patient groups (UD, CKD-UD, and CKDu). [Eubacterium]_coprostanoligenes_group was more abundant in the CKDu group than in the HC and CKD-UD groups. Furthermore, serum concentrations of acetate, a major SCFA component, were significantly lower in all patient groups than in the HC group. The present results indicate that minor changes in the gut microbiome and a significant decrease in serum acetate concentrations occur in early-stage CKDu, which may be important for the development of prevention strategies for CKD patients.
The human gastrointestinal tract harbors a range of organisms that include bacteria, fungi, viruses, archaeans, and parasites (protozoa and helminths). Collectively, this assemblage is known as the gut microbiome and consists largely of bacteria (Vemuri et al., 2020). The abundance and diversity of the microbiome depends on a number of factors e.g. age, sex, host genetics, the host immune system, an individual’s diet, and the use of antibiotics (Jandhyala et al., 2015). Commensal bacteria typically dominate in the intestinal tract and, hence, have a significant impact on the health and physiology of the host, partly by excluding the establishment of pathogenic microorganisms and maintaining intestinal homeostasis and immune regulation. Furthermore, they help the host to degrade dietary fiber and complex carbohydrates into short-chain fatty acids (SCFAs) (Magliocca et al., 2022; Portincasa et al., 2022; Yao et al., 2022). Therefore, gut dysbiosis disturbs host metabolism and has been implicated in the pathogenesis of several diseases, including inflammatory bowel disease, diabetes, obesity, cardiovascular diseases, hypertension, and chronic kidney disease (CKD) (Hills et al., 2019; Wehedy et al., 2021; Huang et al., 2022).
CKD is a condition that is characterized by a gradual loss of kidney function with obvious implications for health (Neuen et al., 2017). CKD is the most common form of kidney disease, with an estimated prevalence worldwide of up to 10% (GBD 2013 Mortality and Causes of Death Collaborators). The prevalence of CKD in northeastern Thailand was previously reported to be 22.2%, which is markedly higher than that in the central and southern regions of Thailand (Ingsathit et al., 2010). Metabolic diseases, including diabetes, hypertension, and obesity, are important underlying diseases and have been identified as risk factors for the development of CKD and its progression to end-stage renal disease (ESRD) (Kazancioǧlu, 2013).
In addition to the high prevalence of CKD (Cha’on et al., 2020), this region also has a high prevalence of parasitic infections, most commonly due to Opisthorchis viverini and Strongyloides stercoralis (Boonjaraspinyo et al., 2013). Recent findings demonstrated that infections with O. viverrini in hamsters (Haonon et al., 2021) and with S. stercoralis in otherwise healthy subjects (Nguyen et al., 2022) and in CKD patients (Hai et al., 2022) induced changes in the gut microbiome. In a previous study in the same community, S. stercoralis infection was found to induce gut dysbiosis and was associated with progression of CKD (Hai et al., 2022).
The prevalence of CKD of unknown etiology (CKDu) is low in Thailand (<1%) (Aekplakorn et al., 2021), whereas that in Khon Kaen Province, northeastern Thailand, is high (approximately 28.9% of CKD patients or 7.76% of the total screened population) (Cha’on et al., 2020). Our research group is currently investigating whether this high prevalence of CKDu is a consequence of environmental pollution, as suggested by Cha’on et al. (2020). The present study provides baseline information on the microbiome of CKDu patients in northeastern Thailand as a context for future work.
Changes in the gut microbiome have been associated with the progression of CKD (Kim and Song, 2020; Wehedy et al., 2021). The 16s rRNA gene-sequencing approach revealed that the abundance of Enterococci and Enterobacteria species increased in CKD patients (Vaziri et al., 2013). Moreover, the abundance of pathogenic bacteria was significantly increased in patients with ESRD, with a corresponding decrease in that of beneficial bacteria, such as Bifidobacteria,
Prevotellaceae, and Bacteroidaceae (Sampaio-Maia et al., 2016). An imbalance between beneficial and pathogenic bacteria leads to gut dysbiosis, which contributes to an increase in toxic metabolites, such as those associated with the progression and complications of CKD (Huang et al., 2022; Shivani et al., 2022; Wang et al., 2020). In addition, a reduction in SCFA-producing bacteria has been reported in ESRD (Wang et al., 2019). SCFAs are fatty acids with fewer than six carbon atoms and are generated by the microbial fermentation of indigestible polysaccharides. SCFAs, such as acetate and butyrate, are important metabolites for maintaining intestinal homeostasis (Magliocca et al., 2022; Yao et al., 2022). These SCFAs act as a primary energy source for colonocytes and maintain the integrity of the intestinal barrier through their anti-inflammatory effects (Huang et al., 2022). SCFAs are reduced in various diseases, particularly CKD (Lu et al., 2021; Magliocca et al., 2022). Therefore, gut microbiome changes and reduced SCFAs are associated with the development and progression of CKD (Chen et al., 2019; Hobby et al., 2019; Lu et al., 2021).
Previous studies reported changes in the gut microbiome and serum concentrations of SCFAs in end-stage CKD patients (Jadoon et al., 2018; Wong et al., 2014). However, limited information is currently available on the concentrations of SCFAs and changes in the gut microbiome during the early stages of CKD (stages 1 to 3 and including CKDu) and in the presence of other underlying diseases, such as diabetes and hypertension. Therefore, the present study investigated the composition of the gut microbiome and serum concentrations of SCFAs in the early stages of CKD with a focus on CKDu in a rural community in Khon Kaen Province, Thailand. To reduce the possible confounding effect of intestinal parasites, only participants free of parasites (based on a stool examination) were included in the present study. Three groups of patients (early-stage CDK of unknown etiology [CKDu]; early-stage CKD with underlying diseases [CKD-UD]; and patients with underlying diseases, but not CKD [UD]) and one group of healthy controls (HC) were enrolled in this study. The results obtained herein will provide a more detailed understanding of the gut microbiota and SCFA concentrations in early-stage CKD, which may lead to better approaches for the diagnosis of early-stage CKD and therapeutic strategies to prevent its progression (Feng et al., 2018; Alsharairi, 2022; Caetano and Castelucci, 2022).
Materials and Methods
Participants and sample collection
The CKD screening program was conducted in a rural population between January 2017 and May 2018 in the Donchang and Kok Samran sub-districts, Khon Kaen Province, Thailand by the Chronic Kidney Disease Northeastern Thailand (CKDNET) program (Cha’on et al., 2020). Seventy-two age- and sex-matched volunteers were recruited. Detailed clinical parameters are shown in Table 1. Participants in the early stages (1–3a) of CKD had a clinically proven impaired kidney structure or renal function as detected by ultrasonography and eGFR values. CKD stage 1 was defined as eGFR ≥90 mL min–1 1.73 m–2, CKD stage 2 as eGFR of 60–89 mL min–1 1.73 m–2, and CKD stage 3a as eGFR of 45–59 mL min–1 1.73 m–2. UD, including diabetes, hypertension, and obesity, are risk factors for CKD. Following the classification from the WHO Regional Office for the Western Pacific (WPRO) (Jitnarin et al., 2011), individuals with BMI >25 kg m–2 were considered to be obese. Early-stage CKD-UD was defined as the presence of CKD stages 1–3 with a diagnosis of diabetes, hypertension, or other known causes. CKDu was used when no clear cause of the condition was identified: this is a “diagnosis of exclusion” (Cuadra et al., 2006; Floris et al., 2021).
Table 1.
Clinical parameters (mean and [SD]) and comparisons of patient groups and healthy controls.
| Biochemical tests and other factors |
HC (n=18) |
CKDu (n=18) |
CKD-UD (n=18) |
UD (n=18) |
| Sex (Male: Female) |
9:9 |
9:9 |
5:13 |
5:13 |
| Age (years) |
62.72 (11.83) |
63.22 (14.95) |
64.22 (9.78) |
63.89 (7.66) |
| Body mass index (kg m–2) |
21.86 (2.06) |
20.33 (2.21) |
28.37 (3.27)**** |
29.78 (4.06)**** |
| Serum creatinine (mg dL–1) |
0.82 (0.18) |
0.98 (0.20) |
0.97 (0.30) |
0.77 (0.13) |
| Urine creatinine (mg dL–1) |
107.90 (52.31) |
115.90 (56.60) |
116.20 (76.38) |
103.40 (50.00) |
| eGFR (mL min–1 1.73 m–2) |
95.61 (10.26) |
73.98 (19.45)** |
71.69 (20.53)*** |
83.68 (14.48) |
| Microalbumin (mg dL–1) |
1.03 (0.81) |
2.36 (4.43) |
9.11 (16.08)* |
4.438 (9.86) |
| Uric Acid (mg dL–1) |
5.17 (1.15) |
5.45 (1.70) |
5.94 (1.51) |
5.32 (1.04) |
| ALT (IU L–1) |
26.05 (15.43) |
19.74 (8.51) |
26.87 (22.84) |
34.31 (25.39) |
| Glucose (mg dL–1) |
87.72 (8.42) |
89.22 (11.73) |
167.60 (53.58)*** |
138.20 (44.98)*** |
| HbA1C |
5.52 (0.33) |
5.56 (0.35) |
8.54 (2.04)**** |
8.11 (1.43)**** |
| LDL Cholesterol (mg dL–1) |
115.90 (30.48) |
121.40 (39.19) |
122.50 (39.73) |
109.80 (27.18) |
| Systolic blood pressure (mmHg) |
117.4 (11.13) |
120.7 (12.12) |
152.4 (16.02)**** |
140.0 (14.56)**** |
| Diastolic blood pressure (mmHg) |
73.17 (9.685) |
76.06 (9.735) |
87.06 (9.428)*** |
83.28 (9.08)** |
Abbreviations: Healthy control (HC), early-stage CKD (CKD), early-stage CKD combined with underlying diseases of CKD (CKD-UD), and underlying diseases of CKD (UD). Significantly different from the healthy group using a one-way analysis of variance, * P<0.05, ** P<0.01, *** P<0.001, **** P<0.0001.
The following exclusion criteria were applied: the current use of antibiotics or probiotics, autoimmune disease, urinary tract infection, and the presence of parasites in stools (confirmed using the modified formalin ethyl-acetate concentration technique and modified agar-plate culture, as previously reported [Kaewrat et al., 2020]). Participants were divided into four groups: healthy controls (HC, n=18); those with early-stage CKD of unknown etiology (CKDu, n=18); those with early-stage CKD and underlying diseases (CKD-UD, n=18), and those free of CKD, but with underlying diseases (UD, n=18).
Feces and blood were collected individually from each participant. All fecal samples were kept at –20°C and DNA was extracted within one month. After each participant had fasted for 8 to 12 h, blood was collected into sodium fluoride tubes, kept on ice, and transferred to the Faculty of Medicine. Samples were centrifuged at 3,000×g at 4°C for 15 min. Serum specimens were transferred into a sterile tube and kept at –20°C for later analyses. The Human Ethical Review Committee of Khon Kaen University (HE602043) approved the study protocol. A signed, informed consent form was obtained from all participants in the CKD project (Cha’on et al., 2020).
DNA extraction and microbial 16S rRNA sequencing
DNA was extracted from individual fecal samples using a stool DNA kit (QIAGEN) following the manufacturer’s instructions and DNA concentrations were measured. An equal quantity of DNA from each of six individuals was pooled (i.e. producing three pooled samples for each treatment group). In each pool, the microbial 16S rRNA gene (v3–v4 regions) was amplified by PCR to detect bacterial genes. The primers used were Pro341-F: 5′-CCTACGGGNGGCWGCAG-3′ and Pro802-R; 5′-TACNVGGGTATCTAATCC-3′ (Itthitaetrakool et al., 2016). The conditions for the PCR reaction were as follows: at 94°C for 5 min, 94°C for 40 s, 52.8°C for 30 s, 72°C for 2 min, 35 cycles, followed by an incubation at 72°C for 10 min as previously described (Gohl et al., 2016). The PCR product (459 bp) from each pool was subjected to next-generation sequencing to assess the microbial composition. Sequencing libraries were generated using the TruSeq® DNA PCR-Free Sample Preparation Kit (Illumina) according to the manufacturer’s recommendations and index codes were added. Libraries were qualified using a Qubit@ 2.0 Fluorometer (Thermo Scientific) and the Agilent Bioanalyzer 2100 system. The library was sequenced on an Illumina platform using a next-generation sequencer (Illumina® NovaSeq 6000TM system). Based on their unique barcodes, 250-bp paired-end reads were assigned to samples and truncated by the removal of the barcode and primer sequences. Paired-end reads were merged using FLASH version 1.2.7, (Magoč and Salzberg, 2011). Quality filtering on the raw tags was performed under specific filtering conditions to obtain high-quality clean tags according to Qiime version 1.7.0. Tags were compared with the reference database (Gold database) using the UCHIME algorithm to detect chimeric sequences (Edgar et al., 2011), which were subsequently removed (Haas et al., 2011). The sequences passing these steps were termed effective tags.
Analysis of the microbiome
A microbiome analysis was performed with Uparse software version 7.0.1001 using all of the effective tags. Sequences with ≥97% similarity were assigned to the same operational taxonomic unit (OTU) (Edgar, 2013). A representative sequence for each OTU was screened for further annotation. In each representative sequence, Mothur software and the SSUrRNA database of SILVA (version 132_16s) were used for annotation at each taxonomic rank (Threshold: 0.8~1) (Wang et al., 2007). MUSCLE Version 3.8.31 was used to prepare multiple sequence alignments (Edgar, 2004). The abundance of each OTU was normalized using a standard corresponding to the sample with the fewest sequences before being further analyzed for alpha and beta diversities. ANOSIM and ADONIS analyses were used to test whether two or more groups of samples were significantly different. The distribution of the 35 most abundant genera in samples was displayed in a species abundance heatmap using the R-pheatmap library with Z-score values. Relative abundance data were subjected to Z-score normalization by row. The absolute value of ‘Z’ represents the distance between the raw score and the mean of the standard deviation. The ‘Z’ score is positive when the row abundance is higher than the mean and vice versa. All sequences have been deposited in Genbank (accession numbers OK161038–OK161076). Raw data are available at Mendeley data (doi: https://doi.org/10.17632/7n2cyd2krj.1).
Measurement of SCFAs using gas chromatography-mass spectrometry (GC-MS)
Serum SCFAs were detected using GC-MS as previously described with slight modifications (Fellows et al., 2018). Briefly, 100 μL of each serum sample was added to 1.5-mL microtubes, followed by 20 mg of NaCl, 10 mg of citric acid, 20 μL of 1 M HCl, and 100 μL of butanol. The tubes were vortexed for 2 min and centrifuged at 18,000×g for 15 min. The supernatant was transferred to fresh microtubes for later analyses by GC. SCFAs were analyzed using GC-MS (Agilent 7890A GC-7000 Mass Triple Quad) equipped with a capillary column (DB-WAX, 60 m×0.25 mm×0.25 μm; J&W Scientific) and a quadrupole mass detector. The injector was operated at 260°C in the split mode with a split ratio of 25:1. The volatile free fatty-acid mix standard (acetic acid, butyric acid, formic acid, heptanoic acid, hexanoic acid, isobutyric acid, isovaleric acid, 4-methylvaleric acid, propionic acid, and valeric acid) was purchased from Sigma-Aldrich (Pace et al., 2018, CRM46975). Two microliters of the sample supernatant was injected. Helium was used as the carrier gas with a constant flow rate of 1.0 mL min–1. The GC oven temperature was started at 40°C for 10 min and was increased to 160°C at 3°C min–1 and then to 240°C at 10°C min–1 (held for 10 min). The mass spectrometer was used in the electron ionization mode with the ion-source temperature set at 250°C and ionization energy set at 70 eV. The scan mode was used across a range 30 to 500 m/z. Agilent MassHunter Qualitative Analysis B.04.00 software was used for data analyses. The identification of SCFAs was performed by comparing mass spectra with NIST mass-spectral libraries (National Institute of Standards, 2011 version).
Statistical analysis
Non-parametric statistical analyses or Pearson’s chi-square test were used to investigate the significance of differences in index variables between groups. A one-way analysis of variance was performed to compare clinical parameters between groups. Welch’s t-test was used to identify species showing a significantly different relative abundance between groups at various taxonomic ranks (phylum, genus, and species). A t-test was also used to compare the average age of patients between groups. The relative abundance of the top 35 genera was compared between pairs of groups using a multiple t-test analysis. The results obtained were displayed in a volcano plot. GraphPad Prism 8 (GraphPad Software) was used for statistical analyses. A P-value or adjusted P-value <0.05 was considered to be significant. The linear discriminant analysis effect size (LEfSe) was used to identify the taxonomic units most likely to explain differences between classes by coupling standard tests for the significance of differences with additional tests encoding biological consistency and effect relevance (Segata et al., 2011).
Results
Diversity of the gut microbiome in study groups
Following filtering, an average of 71,653 high-quality sequences was obtained for each sample. The species accumulation curve showed that sufficient sequencing had been performed to identify most of the species present (Fig. 1A). We investigated species richness and evenness using a rank-abundance curve. The steep gradient for each sample indicated that some taxa were present at a high abundance (Fig. 1B). The observed numbers of OTUs in each patient group are shown in Fig. 1C. The Chao1 index reflects the total richness of microbial communities (Fig. 1D), while the Shannon index indicates the average abundance of different species in a sample (Fig. 1E). The results obtained showed that the UD group had the highest alpha diversity followed by the HC group and then the CKD-UD and CKDu groups.

Beta diversity is displayed using a heatmap based on weighted UniFrac (Fig. 2A) and unweighted UniFrac distances (Fig. 2B) to compare the dissimilarity coefficient among all pairs of samples. Non-metric multidimensional scaling (NMDS) provided the diversity patterns of microbial communities from different sample groups (Fig. 2C). The results obtained revealed that the diversity profile of the HC group was clearly distinct from those of the CKDu and UD groups, but not from that of the CKD-UD group. The ANOSIM statistic, comparing the mean of ranked dissimilarities between groups to the mean of ranked dissimilarities within groups, was applied, but did not detect any dissimilarity. ADONIS testing showed a significant difference only between the CKDu and CKD-UD groups (R2=0.26158, Pr[>F]=0.0014).
Gut dysbiosis in early stages of CKD
Sequence reads sharing >97% similarity were grouped into the same OTU. The numbers of sequences representing each OTU indicated the relative abundance of each taxon in each patient group and the HC group. Firmicutes, Bacteroidetes and Proteobacteria, in descending order, were the most abundant phyla and also within the CKDu group (Fig. 3A and B).
At the genus level, there was an increased abundance (relative to healthy controls) of Escherichia-Shigella and Lactobacillus and decreased abundance of Bacteroides, Enterobacter, Cetobacterium, and Faecalibacterium in the CKDu, UD, and CKD-UD groups. In comparisons with the CKDu group, the abundance of Escherichia-Shigella and Enterobacter was higher in the CKD-UD and UD groups, while that of Bacteroides, Ruminococcaceae_UCG-002, and [Eubacterium]_rectale_group was lower in the UD group (Fig. 3C and D).
The heatmap in Fig. 4 shows the relative abundance of the 35 most common genera. Faecalibacterium, Erysipelotrichaceae_UCG–003,
[Eubacterium]_eligens_group, Cetobacterium, Phascolarctobacterium, Enterobacter, Prevotella_2, Pluralibacter, Alloprevotella, Bacteroides, and Dorea were abundant in the HC group. [Ruminococcus]_torques_group, [Eubacterium]_hallii_group, Clostridium_sensu_stricto_1, Roseburia, Romboutsia, Ruminococcaceae_UCG–002, Blautia,
Akkermansia, [Eubacterium]_coprostanoligenes_group, and [Ruminococcus]_gnavus_group were abundant in the CKDu group. Escherichia–Shigella, Subdoligranulum, Lactobacillus,
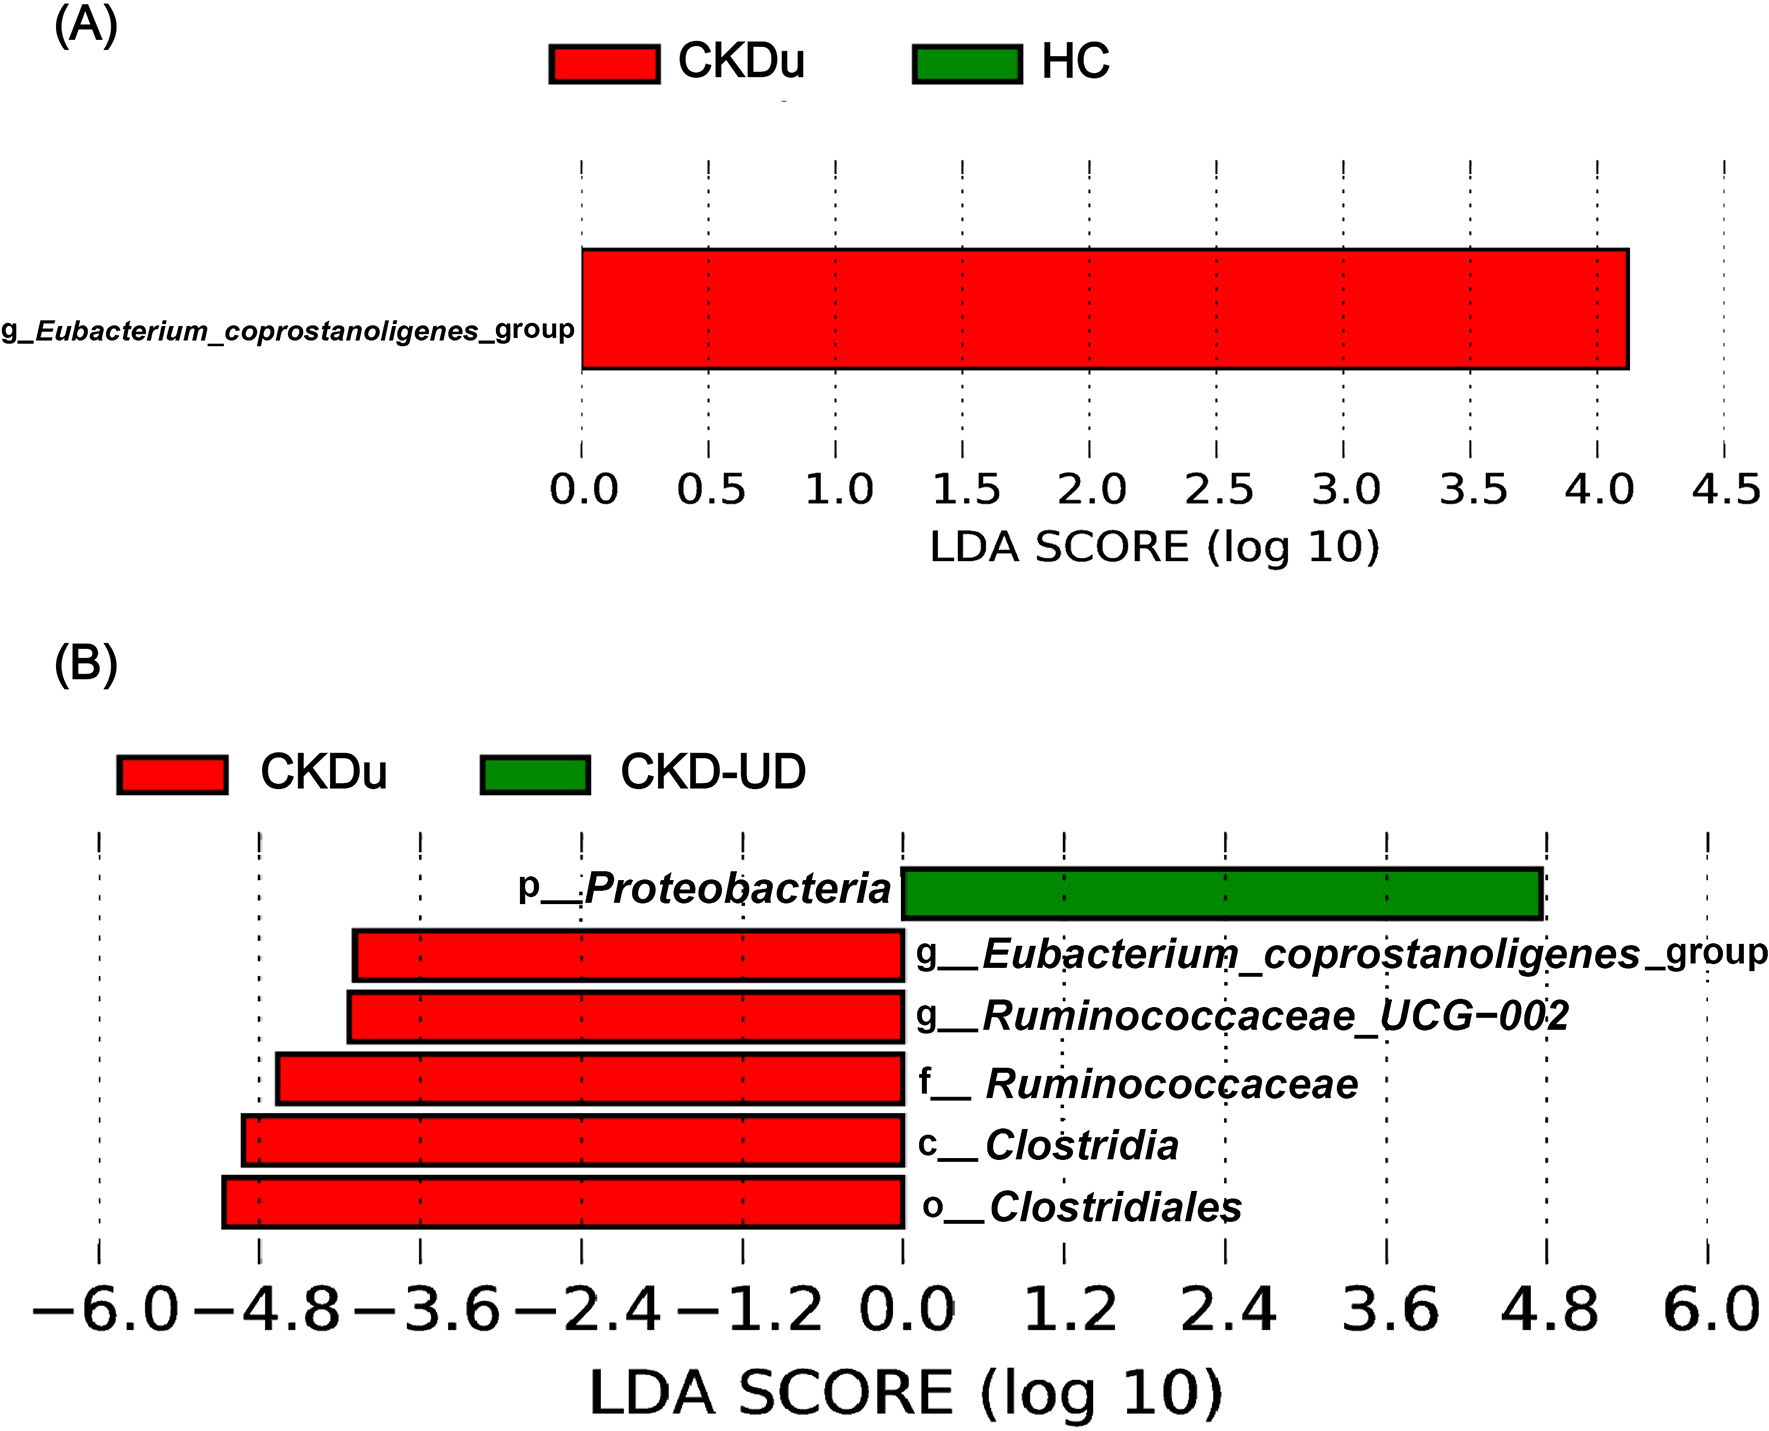
Megamonas, [Eubacterium]_rectale_group, Prevotella_9, and Raoultella were abundant in the CKD-UD group. Fusobacterium, Catenibacterium, Haemophilus, Christensenellaceae_R–7_group, Streptococcus, Dialister, Collinsella, Escherichia–Shigella, and Subdoligranulum were abundant in the UD group. The results of statistical analyses indicated that different genera were included in the top 35 in comparisons between different pairs of groups (Fig. 5). In comparisons with the HC group, the abundance of Phascolarctobacterium was significantly lower in groups with underlying diseases (UD vs HC, adjusted P-value=0.031; CKD-UD vs HC, adjusted P-value=0.08). The abundance of Bacteroides was slightly lower in the UD group than in the HC and CKD-UD groups (UD vs HC, adjusted P-value=0.105; UD vs CKD-UD, adjusted P-value=0.122). [Eubacterium]_coprostanoligenes_group was more abundant in the CKDu group than in the HC group (adjusted P-value=0.147) and CKD-UD group (adjusted P-value=0.065). In addition, LEfSe identified which taxa were most likely to explain differences between the CKDu and HC groups (Fig. 6A) and between the CKDu and CKD-UD groups (Fig. 6B). In both of these comparisons, the abundance of [Eubacterium]_coprostanoligenes_group was significantly higher in the CKDu group than in the HC and CKD-UD groups.

We compared serum concentrations of SCFAs in the healthy group (HC) and the patient (CKDu, CKD-UD, and UD) groups. The SCFAs identified in serum samples were acetate, butyrate, and isovalerate (Fig. 7). Acetate concentrations were significantly lower in the CKDu (0.1793 mM L–1), CKD-UD (0.1964 mM L–1), and UD groups (0.1085 mM L–1) than in the healthy control group (0.3907 mM L–1), (P=0.001, P=0.001, and P=0.0001, respectively, Fig. 7A). Butyrate and isovalerate concentrations were significantly lower in the UD group than in the other groups (Fig. 7B and C). However, acetate, butyrate, and isovalerate concentrations were similar between the CKDu and CKD-UD groups (Fig. 7).
Discussion
We herein investigated, for the first time, the gut microbiota profile in early-stage CKDu in the absence or presence of other metabolic diseases that have been identified as risk factors for CKD in order to elucidate the relationship between gut dysbiosis and CKD in two communities in Khon Kaen Province, Northeast Thailand. Although we did not control for differences in diet, all participants resided in the same sub-district and matched pairs of participants were used. We employed three sets of pooled samples in each group to allow for statistical analyses. We identified minor changes in the gut microbiome and significantly lower serum concentrations of acetate in the CKDu, CKD-UD, and UD groups than in the HC group, suggesting that decreased acetate concentrations are associated with a wide range of disease states, not just CKD. Among the changes observed in the gut microbiome, [Eubacterium]_coprostanoligenes_group was more abundant in the CKDu group than in the HC and CKD-UD groups. Furthermore, the lowest serum concentrations of acetate, butyrate and isovalerate were detected in the groups with underlying diseases, such as diabetes type 2 and hypertension. Awareness that SCFA concentrations are reduced in CKD and a wide range of other diseases provides support for the use of these compounds as dietary supplements to limit disease progression (Feng et al., 2018; Alsharairi, 2022; Caetano and Castelucci, 2022; Yao et al., 2022).
Gut dysbiosis was noted in the CKDu, CKD, and UD groups. Alpha diversity was slightly decreased in the CKD-UD and CKDu groups, but was the highest in the UD group. The CKDu and UD groups had gut microbiome communities that were distinct from that of the HC group: however, the ADONIS analysis showed that the microbiome community in the CKDu group significantly differed from that in the CKD-UD group. The result showing gut microbial diversity in early-stage CKDu was consistent with previous findings on late-stage CKD patients with or without hemodialysis (Li et al., 2019). The present study revealed that the most abundant bacterial phyla in each study group were Firmicutes,
Bacteroidetes, and Proteobacteria. This is in accordance with previous findings on the gut microbiomes of healthy controls and CKD patients (Lun et al., 2019). At the phylum level, Firmicutes were more abundant, while Bacteroidetes were less abundant in the CKDu group than in the HC group. The reduction observed in the abundance of Bacteroidetes was consistent with previous findings on advanced-stage CKD in China (Huang et al., 2022), but was in contrast to those on CKD in dialysis patients in Taiwan (Shivani et al., 2022). This discrepancy may be attributed to the different geographies and characteristics of subjects examined (Arumugam et al., 2011).
The early detection of CKD is challenging due to the absence of early-stage symptoms. Therefore, we attempted to identify the features of the gut microbiome that may be affected in CKD stages 1–3 and in the presence of underlying diseases, including diabetes mellitus, obesity, and hypertension, all known risk factors for the progression of CKD. In the present study, the gut microbiome of the UD group was distinct from those of the HC, CKDu, and CKD-UD groups. Bacterial taxa enriched in the UD group including the genera Fusobacterium, Escherichia-shigella, and Subdoligranulum. Previous studies demonstrated that these taxa were more abundant in kidney disease patients (Jiang et al., 2017). Moreover, several taxa of gut microbes have been linked to numerous clinical markers in kidney patients. Fusobacterium and Escherichia-Shigella positively correlate with increased renal inflammation markers, including cystatin C and serum creatinine in ESRD patients (Jiang et al., 2017). Similarly, a positive correlation has been reported between the abundance of Escherichia and Fusobacterium and serum uremic toxin trimethylamine N-oxide levels as well as indoxyl sulphate and p-cresyl sulfate levels, which have been associated with reduced kidney function (measured by eGFR) (Al-Obaide et al., 2017; Wang et al., 2020). However, the present study did not detect a correlation between gut microbial profiles and renal function markers due to the use of pooled samples; therefore, an analysis of individual samples is warranted in the future.
Intestinal tight-junction proteins are depleted during the pathogenesis of kidney diseases, leading to changes in gut permeability in association with kidney fibrosis (Sabatino et al., 2015; Chen et al., 2019). Probiotic bacteria may contribute to the preservation of intestinal barrier functions through the production of SCFAs, which are an important nutrient source for enterocytes and also moderate immune responses (Yao et al., 2022). The present results revealed that the abundance of SCFA-producing bacteria, including Bacteroides, was significantly reduced in the UD group. These results suggest that a reduction in Bacteroides associated with underlying diseases is a risk factor for the development of CKD, which was supported by findings obtained on CKD patients (Huang et al., 2022) and CKD (stages 3–5) patients receiving colonic dialysis (Li et al., 2021). In addition, the abundance of Phascolarctobacterium was significantly reduced in the UD and CKD-UD groups, which is consistent with previous findings on patients with end-stage CKD (Hu et al., 2022).
The term CKDu refers to a type of CKD that primarily affects marginalized agricultural communities in particular parts of the world where a large number of individuals develop an undiagnosed, fatal form of kidney disease (Weaver et al., 2015). CKDu has been attracting increasing attention in the scientific community because the affected populations are some of the poorest in the world and are exposed to many occupational and environmental dangers. In the present study, the abundance of [Eubacterium] coprostanoligenes_group was higher in the CKDu group than in the HC and CKD-UD groups. This bacterial taxon is a cholesterol-reducing microorganism (Freier et al., 1994). Other studies identified this genus in Alzheimer’s dementia patients (Kaiyrlykyzy et al., 2022) and demonstrated that it significantly protected against colitis and carcinogenesis in the colons of mice (Bai et al., 2021). However, we herein showed for the first time an increase in the abundance of this taxon in human CKD. Therefore, an increased abundance of this genus in individuals without an apparent underlying disease and in regions of poor water quality and chemical exposure indicates that they need to be checked for early-stage CKDu. Further studies are needed on the relationship between environmental pollutants (such as heavy metals) and the gut microbiota of CKDu patients.
We investigated serum SCFAs and identified acetate, butyrate, and isovalerate. SCFAs are produced by the bacterial fermentation of dietary fiber and resistant starch in the intestines and play many roles in human physiology, such as anti-inflammation, energy regulation, and the maintenance of intestinal barrier functions (Zeng et al., 2019; Magliocca et al., 2022; Yao et al., 2022). In the present study, acetate concentrations were significantly lower in the early-stage CKDu group than in the healthy control group. Reductions in the concentrations of SCFAs, including acetate, butyrate, and propionate, were previously demonstrated in CKD patients (Wang et al., 2019; Lu et al., 2021). The UD group exhibited the most significant reduction in SCFA-producing bacteria and, thus, acetate, butyrate, and isovalerate concentrations. The depletion of SCFAs observed in the early stages of CKDu may permit the translocation of bacterial toxins to the kidney (Lau et al., 2018). Decreases in serum concentrations of acetate, but not butyrate in CKDu may be explained by the enriched abundance of butyrate due to the presence of [Eubacterium] spp. (Mukherjee et al., 2020). Serum acetate concentrations in healthy individuals in a rural area of Khon Kaen were similar to those in Swedish subjects (Olsson et al., 2021), but were higher than those in urban Canadians (Wolever et al., 1996), suggesting that differences in diet, individual status, and measurement methods affected the findings obtained (Moffett et al., 2020).
It is postulated that CKDu is multifactorial, involving genetic predisposition, nutritional stress, and the hydration status (Vlahos et al., 2019). In our previous study on two communities, the majority of participants worked on farms growing crops, such as sugar cane, which is associated with high pesticide use (Cha’on et al., 2020). Further studies are required to obtain a more detailed understanding of these and other possible risk factors and their effects on the gut microbiome. Studies on environmental pollution (Xu et al., 2018) and chemical contaminants in water (McDonough et al., 2020) are needed to detect any relationship with the gut microbiome in CKDu. The use of pooled DNA samples is a pragmatic solution to the cost of sequencing (Ray et al., 2019), but means that information on individual variations may be obscured. This prevented us from performing a correlation analysis between the clinical parameters and SCFAs of patients.
Conclusion
The present results revealed that early-stage CKDu was associated with an increased relative abundance of bacteria and decreased concentrations of SCFAs. Most of the changes observed in the gut microbiome in CKDu were consistent with previous findings on late-stage CKD. Reductions in the serum concentrations of acetate and the increased abundance of [Eubacterium]_coprostanoligenes_group in early-stage CKDu may be useful for screening at-risk individuals. This may also facilitate measures to prevent the progression of CKD to ESRD in these individuals. The identification of environmental toxicants associated with the development of CKDu in this region of Thailand is now a priority for future work.
Citation
Banjong, D., Pongking, T., Tran, N. T.. D.., Pinlaor, S., Dangtakot, R., Intuyod, K., et al. (2023) Slight Changes in the Gut Microbiome in Early-stage Chronic Kidney Disease of Unknown Etiology. Microbes Environ 38: ME22097.
https://doi.org/10.1264/jsme2.ME22097
Acknowledgements
This study was supported by Research and Graduate Studies, Khon Kaen University (RP66-4-003), and the Chronic Kidney Disease Northeast Thailand. D.B. thanks the Mekong Health Science Research Institute, Khon Kaen University, Thailand (no.10/2561). We also acknowledge Prof. David Blair from Publication Clinic KKU, Thailand, for his comments and editing the manuscript.
References
- Aekplakorn, W., Chariyalertsak, S., Kessomboon, P., Assanangkornchai, S., Taneepanichskul, S., Neelapaichit, N., et al. (2021) Women and other risk factors for chronic kidney disease of unknown etiology in Thailand: National Health Examination V Survey. Sci Rep
11: 21366.
- Al-Obaide, M.A.I., Singh, R., Datta, P., Rewers-Felkins, K.A., Salguero, M.V., Al-Obaidi, I., et al. (2017) Gut microbiota-dependent trimethylamine-N-oxide and serum biomarkers in patients with T2DM and advanced CKD. J Clin Med
6: 86.
- Alsharairi, N.A. (2022) The therapeutic role of short-chain fatty acids mediated very low-calorie ketogenic diet-gut microbiota relationships in paediatric inflammatory bowel diseases. Nutrients
14: 4113.
- Arumugam, M., Raes, J., Pelletier, E., Le Paslier, D., Yamada, T., Mende, D.R., et al. (2011) Enterotypes of the human gut microbiome. Nature
473: 174–180.
- Bai, D., Sun, T., Zhao, J., Du, J., Bu, X., Cao, W., et al. (2021) Oroxylin A maintains the colonic mucus barrier to reduce disease susceptibility by reconstituting a dietary fiber-deprived gut microbiota. Cancer Lett
515: 73–85.
- Boonjaraspinyo, S., Boonmars, T., Kaewsamut, B., Ekobol, N., Laummaunwai, P., Aukkanimart, R., et al. (2013) A cross-sectional study on intestinal parasitic infections in rural communities, northeast Thailand. Korean J Parasitol
51: 727–734.
- Caetano, M.A.F., and Castelucci, P. (2022) Role of short chain fatty acids in gut health and possible therapeutic approaches in inflammatory bowel diseases. World J Clin Cases
10: 9985–10003.
- Cha’on, U., Wongtrangan, K., Thinkhamrop, B., Tatiyanupanwong, S., Limwattananon, C., Pongskul, C., et al. (2020) CKDNET, a quality improvement project for prevention and reduction of chronic kidney disease in the Northeast Thailand. BMC Public Health
20: 1299.
- Chen, Y.Y., Chen, D.Q., Chen, L., Liu, J.R., Vaziri, N.D., Guo, Y., and Zhao, Y.Y. (2019) Microbiome-metabolome reveals the contribution of gut-kidney axis on kidney disease. J Transl Med
17: 5.
- Cuadra, S., Jakobsson, K., Hogstedt, C., and Wesseling, C. (2006) Chronic kidney disease: Assessment of current knowledge and feasibility for regional research collaboration in Central America. Heredia, Costa Rica: Program on Work and Health in Central America (SALTRA), Central American Institute for Studies on Toxic Substances (IRET-UNA).
- Edgar, R.C. (2004) MUSCLE: multiple sequence alignment with high accuracy and high throughput. Nucleic Acids Res
32: 1792–1797.
- Edgar, R.C., Haas, B.J., Clemente, J.C., Quince, C., and Knight, R. (2011) UCHIME improves sensitivity and speed of chimera detection. Bioinformatics
27: 2194–2200.
- Edgar, R.C. (2013) UPARSE: highly accurate OTU sequences from microbial amplicon reads. Nat Methods
10: 996–998.
- Fellows, R., Denizot, J., Stellato, C., Cuomo, A., Jain, P., Stoyanova, E., et al. (2018) Microbiota derived short chain fatty acids promote histone crotonylation in the colon through histone deacetylases. Nat Commun
9: 105.
- Feng, W., Ao, H., and Peng, C. (2018) Gut microbiota, short-chain fatty acids, and herbal medicines. Front Pharmacol
9: 1354.
- Floris, M., Lepori, N., Angioi, A., Cabiddu, G., Piras, D., Loi, V., et al. (2021) Chronic kidney disease of undetermined etiology around the world. Kidney Blood Pressure Res
46: 142–151.
- Freier, T.A., Beitz, D.C., Li, L., and Hartman, P.A. (1994) Characterization of Eubacterium coprostanoligenes sp. nov., a cholesterol-reducing anaerobe. Int J Syst Bacteriol
44: 137–142.
- GBD 2013 Mortality and Causes of Death Collaborators. (2015) Global, regional, and national age-sex specific all-cause and cause-specific mortality for 240 causes of death, 1990–2013: a systematic analysis for the Global Burden of Disease Study 2013. Lancet
385: 117–171.
- Gohl, D.M., Vangay, P., Garbe, J., MacLean, A., Hauge, A., Becker, A., et al. (2016) Systematic improvement of amplicon marker gene methods for increased accuracy in microbiome studies. Nat Biotechnol
34: 942–949.
- Haas, B.J., Gevers, D., Earl, A.M., Feldgarden, M., Ward, D.V., Giannoukos, G., et al. (2011) Chimeric 16S rRNA sequence formation and detection in Sanger and 454-pyrosequenced PCR amplicons. Genome Res
21: 494–504.
- Hai, N.T., Hongsrichan, N., Intuyod, K., Pinlaor, P., Yingklang, M., Chaidee, A., et al. (2022) Strongyloides stercoralis infection induces gut dysbiosis in chronic kidney disease patients. PLoS Neglected Trop Dis
16: e0010302.
- Haonon, O., Liu, Z., Dangtakot, R., Intuyod, K., Pinlaor, P., Puapairoj, A., et al. (2021) Opisthorchis viverrini infection induces metabolic and fecal microbial disturbances in association with liver and kidney pathologies in hamsters. J Proteome Res
20: 3940–3951.
- Hills, R.D., Jr., Pontefract, B.A., Mishcon, H.R., Black, C.A., Sutton, S.C., and Theberge, C.R. (2019) Gut microbiome: Profound implications for diet and disease. Nutrients
11: 1613.
- Hobby, G.P., Karaduta, O., Dusio, G.F., Singh, M., Zybailov, B.L., and Arthur, J.M. (2019) Chronic kidney disease and the gut microbiome. Am J Physiol Renal Physiol
316: F1211–F1217.
- Hu, J., Zhong, X., Liu, Y., Yan, J., Zhou, D., Qin, D., et al. (2022) Correlation between intestinal flora disruption and protein-energy wasting in patients with end-stage renal disease. BMC Nephrol
23: 130.
- Huang, Y., Xin, W., Xiong, J., Yao, M., Zhang, B., and Zhao, J. (2022) The intestinal microbiota and metabolites in the gut-kidney-heart axis of chronic kidney disease. Front Pharmacol
13: 837500.
- Ingsathit, A., Thakkinstian, A., Chaiprasert, A., Sangthawan, P., Gojaseni, P., Kiattisunthorn, K., et al. (2010) Prevalence and risk factors of chronic kidney disease in the Thai adult population: Thai SEEK study. Nephrol Dial Transplant
25: 1567–1575.
- Itthitaetrakool, U., Pinlaor, P., Pinlaor, S., Chomvarin, C., Dangtakot, R., Chaidee, A., et al. (2016) Chronic Opisthorchis viverrini infection changes the liver microbiome and promotes Helicobacter growth. PLoS One
11: e0165798.
- Jadoon, A., Mathew, A.V., Byun, J., Gadegbeku, C.A., Gipson, D.S., Afshinnia, F., and Pennathur, S. (2018) Gut microbial product predicts cardiovascular risk in chronic kidney disease patients. Am J Nephrol
48: 269–277.
- Jandhyala, S.M., Talukdar, R., Subramanyam, C., Vuyyuru, H., Sasikala, M., and Nageshwar Reddy, D. (2015) Role of the normal gut microbiota. World J Gastroenterol
21: 8787–8803.
- Jiang, S., Xie, S., Lv, D., Wang, P., He, H., Zhang, T., et al. (2017) Alteration of the gut microbiota in Chinese population with chronic kidney disease. Sci Rep
7: 2870.
- Jitnarin, N., Kosulwat, V., Rojroongwasinkul, N., Boonpraderm, A., Haddock, C.K., and Poston, W.S. (2011) Prevalence of overweight and obesity in Thai population: results of the National Thai Food Consumption Survey. Eat Weight Disord
16: e242–249.
- Kaewrat, W., Sengthong, C., Yingklang, M., Intuyod, K., Haonon, O., Onsurathum, S., et al. (2020) Improved agar plate culture conditions for diagnosis of Strongyloides stercoralis. Acta Tropica
203: 105291.
- Kaiyrlykyzy, A., Kozhakhmetov, S., Babenko, D., Zholdasbekova, G., Alzhanova, D., Olzhayev, F., et al. (2022) Study of gut microbiota alterations in Alzheimer’s dementia patients from Kazakhstan. Sci Rep
12: 15115.
- Kazancioǧlu, R. (2013) Risk factors for chronic kidney disease: an update. Kidney Int Suppl
3: 368–371.
- Kim, S.M., and Song, I.H. (2020) The clinical impact of gut microbiota in chronic kidney disease. Korean J Intern Med
35: 1305–1316.
- Lau, W.L., Savoj, J., Nakata, M.B., and Vaziri, N.D. (2018) Altered microbiome in chronic kidney disease: systemic effects of gut-derived uremic toxins. Clin Sci (Lond)
132: 509–522.
- Li, Y., Su, X., Zhang, L., Liu, Y., Shi, M., Lv, C., et al. (2019) Dysbiosis of the gut microbiome is associated with CKD5 and correlated with clinical indices of the disease: a case-controlled study. J Transl Med
17: 228.
- Li, Y., Dai, M., Yan, J., Liu, F., Wang, X., Lin, L., et al. (2021) Colonic dialysis can influence gut flora to protect renal function in patients with pre-dialysis chronic kidney disease. Sci Rep
11: 12773.
- Lu, P.-C., Hsu, C.-N., Lin, I.-C., Lo, M.-H., Yang, M.-Y., and Tain, Y.-L. (2021) The association between changes in plasma short-chain fatty acid concentrations and hypertension in children with chronic kidney disease. Front Pediatr
8: 613641.
- Lun, H., Yang, W., Zhao, S., Jiang, M., Xu, M., Liu, F., and Wang, Y. (2019) Altered gut microbiota and microbial biomarkers associated with chronic kidney disease. MicrobiologyOpen
8: e00678.
- Magliocca, G., Mone, P., Di Iorio, B.R., Heidland, A., and Marzocco, S. (2022) Short-chain fatty acids in chronic kidney disease: focus on inflammation and oxidative stress regulation. Int J Mol Sci
23: 5354.
- Magoč, T., and Salzberg, S.L. (2011) FLASH: fast length adjustment of short reads to improve genome assemblies. Bioinformatics
27: 2957–2963.
- McDonough, L.K., Meredith, K.T., Nikagolla, C., Middleton, R.J., Tan, J.K., Ranasinghe, A.V., et al. (2020) The water chemistry and microbiome of household wells in Medawachchiya, Sri Lanka, an area with high prevalence of chronic kidney disease of unknown origin (CKDu). Sci Rep
10: 18295.
- Moffett, J.R., Puthillathu, N., Vengilote, R., Jaworski, D.M., and Namboodiri, A.M. (2020) Acetate revisited: A key biomolecule at the nexus of metabolism, epigenetics, and oncogenesis—Part 2: acetate and ACSS2 in health and disease. Front Physiol
11: 580171.
- Mukherjee, A., Lordan, C., Ross, R.P., and Cotter, P.D. (2020) Gut microbes from the phylogenetically diverse genus Eubacterium and their various contributions to gut health. Gut Microbes
12: 1802866.
- Neuen, B.L., Chadban, S.J., Demaio, A.R., Johnson, D.W., and Perkovic, V. (2017) Chronic kidney disease and the global NCDs agenda. BMJ Glob Health
2: e000380.
- Nguyen, H.T., Hongsrichan, N., Intuyod, K., Pinlaor, P., Yingklang, M., Chaidee, A., et al. (2022) Investigation of gut microbiota and short-chain fatty acids in Strongyloides stercoralis-infected patients in a rural community. Biosci Microbiota Food Health
41: 121–129.
- Olsson, A., Gustavsen, S., Nguyen, T.D., Nyman, M., Langkilde, A.R., Hansen, T.H., et al. (2021) Serum short-chain fatty acids and associations with inflammation in newly diagnosed patients with multiple sclerosis and healthy controls. Front Immunol
12: 661493.
- Pace, F., Carvalho, B.M., Zanotto, T.M., Santos, A., Guadagnini, D., Silva, K.L.C., et al. (2018) Helminth infection in mice improves insulin sensitivity via modulation of gut microbiota and fatty acid metabolism. Pharmacol Res
132: 33–46.
- Portincasa, P., Bonfrate, L., Vacca, M., De Angelis, M., Farella, I., Lanza, E., et al. (2022) Gut microbiota and short chain fatty acids: implications in glucose homeostasis. Int J Mol Sci
23: 1105.
- Ray, K.J., Cotter, S.Y., Arzika, A.M., Kim, J., Boubacar, N., Zhou, Z., et al. (2019) High-throughput sequencing of pooled samples to determine community-level microbiome diversity. Ann Epidemiol
39: 63–68.
- Sabatino, A., Regolisti, G., Brusasco, I., Cabassi, A., Morabito, S., and Fiaccadori, E. (2015) Alterations of intestinal barrier and microbiota in chronic kidney disease. Nephrol Dial Transplant
30: 924–933.
- Sampaio-Maia, B., Simões-Silva, L., Pestana, M., Araujo, R., and Soares-Silva, I.J. (2016) Chapter three—The role of the gut microbiome on chronic kidney disease. In Advances in Applied Microbiology. Sariaslani, S., and Gadd, G.M. (eds). Cambridge, MA: Academic Press, pp. 65–94.
- Segata, N., Izard, J., Waldron, L., Gevers, D., Miropolsky, L., Garrett, W.S., and Huttenhower, C. (2011) Metagenomic biomarker discovery and explanation. Genome Biol
12: R60.
- Shivani, S., Kao, C.Y., Chattopadhyay, A., Chen, J.W., Lai, L.C., Lin, W.H., et al. (2022) Uremic toxin-producing bacteroides species prevail in the gut microbiota of Taiwanese CKD patients: An analysis using the new Taiwan microbiome baseline. Front Cell Infect Microbiol
12: 726256.
- Vaziri, N.D., Wong, J., Pahl, M., Piceno, Y.M., Yuan, J., DeSantis, T.Z., et al. (2013) Chronic kidney disease alters intestinal microbial flora. Kidney Int
83: 308–315.
- Vemuri, R., Shankar, E.M., Chieppa, M., Eri, R., and Kavanagh, K. (2020) Beyond just bacteria: Functional biomes in the gut ecosystem including virome, mycobiome, archaeome and helminths. Microorganisms
8: 483.
- Vlahos, P., Schensul, S.L., Nanayakkara, N., Chandrajith, R., Haider, L., Anand, S., et al. (2019) Kidney progression project (KiPP): Protocol for a longitudinal cohort study of progression in chronic kidney disease of unknown etiology in Sri Lanka. Global Public Health
14: 214–226.
- Wang, Q., Garrity, G.M., Tiedje, J.M., and Cole, J.R. (2007) Naive Bayesian classifier for rapid assignment of rRNA sequences into the new bacterial taxonomy. Appl Environ Microbiol
73: 5261–5267.
- Wang, S., Lv, D., Jiang, S., Jiang, J., Liang, M., Hou, F., and Chen, Y. (2019) Quantitative reduction in short-chain fatty acids, especially butyrate, contributes to the progression of chronic kidney disease. Clin Sci (Lond)
133: 1857–1870.
- Wang, X., Yang, S., Li, S., Zhao, L., Hao, Y., Qin, J., et al. (2020) Aberrant gut microbiota alters host metabolome and impacts renal failure in humans and rodents. Gut
69: 2131–2142.
- Weaver, V.M., Fadrowski, J.J., and Jaar, B.G. (2015) Global dimensions of chronic kidney disease of unknown etiology (CKDu): a modern era environmental and/or occupational nephropathy?
BMC Nephrol
16: 145.
- Wehedy, E., Shatat, I.F., and Al Khodor, S. (2021) The human microbiome in chronic kidney disease: A double-edged sword. Front Med (Lausanne)
8: 790783.
- Wolever, T., Fernandes, J., and Rao, V. (1996) Serum acetate:propionate ratio is related to serum cholesterol in men but not women. J Nutr
126: 2790–2797.
- Wong, J., Piceno, Y.M., DeSantis, T.Z., Pahl, M., Andersen, G.L., and Vaziri, N.D. (2014) Expansion of urease- and uricase-containing, indole- and p-cresol-forming and contraction of short-chain fatty acid-producing intestinal microbiota in ESRD. Am J Nephrol
39: 230–237.
- Xu, X., Nie, S., Ding, H., and Hou, F.F. (2018) Environmental pollution and kidney diseases. Nat Rev Nephrol
14: 313–324.
- Yao, Y., Cai, X., Fei, W., Ye, Y., Zhao, M., and Zheng, C. (2022) The role of short-chain fatty acids in immunity, inflammation and metabolism. Crit Rev Food Sci Nutr
62: 1–12.
- Zeng, H., Umar, S., Rust, B., Lazarova, D., and Bordonaro, M. (2019) Secondary bile acids and short chain fatty acids in the colon: A focus on colonic microbiome, cell proliferation, inflammation, and cancer. Int J Mol Sci
20: 1214.