Abstract
Nitrous oxide (N2O) is a key atmospheric greenhouse gas that contributes to global warming, with anthropogenic N2O emissions from agriculture being a particular concern. Among agricultural sources, unknown soil organisms in the legume rhizosphere emit N2O from degraded root nodules. To discriminate between fungal and bacterial N2O emissions, we adopted an isotopomer analysis, which provides site preference values (the difference in 15N abundance of the central and terminal N atoms in the N2O molecule). The addition of nitrite instead of nitrate to soybean nodulated roots significantly increased SPN2O from –3.5‰ to 4.2‰ in a pot system. Moreover, a mutation of the nirK gene (encoding dissimilatory nitrite reductase) in symbiotic bradyrhizobia significantly increased SPN2O from 4.2‰ to 13.9‰ with nitrite. These results suggest that nitrite-utilizing N2O emissions via fungal denitrification occurred in the model pot system of the soybean rhizosphere. Microscopic observations showed fungal hyphae and crescent spores around N2O-emitting nodules. Therefore, we isolated single spores from soybean nodules under a microscope. A phylogenetic analysis revealed that all 12 fungal isolates were Fusarium species, which exist in soybean field soil. When these isolates were cultivated in glycerol-peptone medium supplemented with nitrate or nitrite (1 mM), 11 of the 12 isolates strongly converted nitrite to N2O; however, no N2O emissions were noted in the presence of nitrate. A 15N-nitrite tracer experiment revealed that one N2O molecule was derived exclusively from two molecules of nitrite (NO2–) in the fungal culture. These results suggest that nitrite-utilizing Fusarium fungi mediate N2O emissions in the soybean rhizosphere.
The term rhizosphere was coined in 1904 by Lorenz Hiltner, who was interested in nitrogen cycles in the rhizosphere of nodulated roots of leguminous crops (Hartmann et al., 2008). However, few studies have examined microbial nitrogen transformations in the legume rhizosphere (Kuypers et al., 2018;
Sánchez and Minamisawa, 2019). One of the products of these transformations is the gas nitrous oxide (N2O), which, in addition to increasing global warming, causes stratospheric ozone depletion (Ravishankara et al., 2009; Tian et al., 2020). Terrestrial agricultural systems are the main anthropogenic sources of N2O (Tian et al., 2020). Due to anthropogenic N2O emissions, the concentration of atmospheric N2O has increased by more than 20% from 270 ppb in 1750 to 331 ppb in 2018.
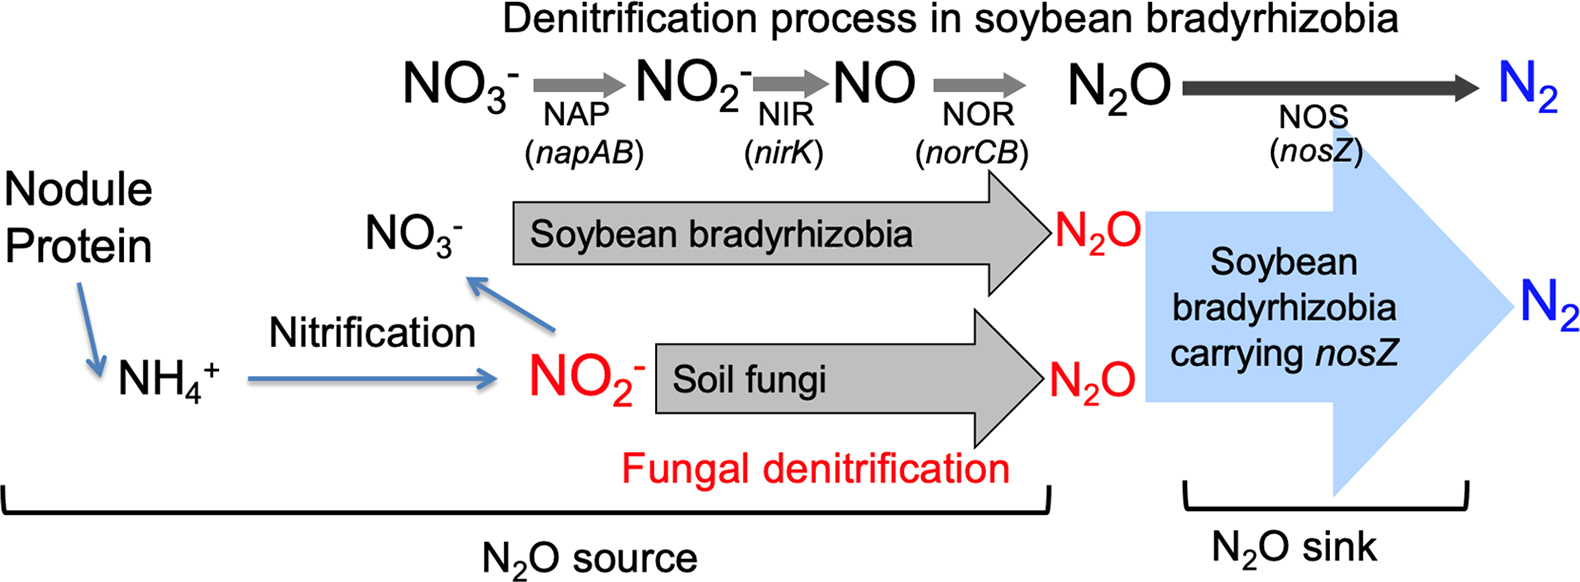
The soybean rhizosphere is a site of active N transformations, including the production and consumption of N2O (Sánchez and Minamisawa, 2019; Minamisawa, 2022). Field studies show that the emission of N2O starts during the late plant growth period (Inaba et al., 2009). A 15N tracer experiment revealed that N2O emitted from the soybean rhizosphere was almost entirely derived from N2 that had been symbiotically fixed in the nodules (Inaba et al., 2012). During nodule decomposition, organic N from nodules is mineralized into ammonium (NH3). N2O is then produced via nitrification and denitrification (Inaba et al., 2009, 2012) (Fig. 1A).

Measurements of N2O flux from decomposed nodules formed with the wild-type strain and mutants of Bradyrhizobium diazoefficiens showed that this species played a role in N2O emissions via denitrification (41% of all N2O produced) (Fig. 1A) (Inaba et al., 2012). Other denitrifying microorganisms in the soil also make important contributions, accounting for the remaining 59% of total N2O produced (Inaba et al., 2012); however, these microbes have yet to be identified (Fig. 1A). In contrast, B. diazoefficiens strains carrying the nosZ gene exclusively reduce N2O, acting as a N2O sink (Inaba et al., 2012). Net N2O flux in the soybean rhizosphere is assessed by the balance between N2O sources and sinks (Fig. 1A).
A useful tool to evaluate the contribution of each N2O production pathway in the environment is the N2O isotopomer ratio, which indicates the natural abundance of N2O isotopomers (14N15N16O and 15N14N16O) relative to that of 14N14N16O (Yoshida and Toyoda, 2000; Toyoda et al., 2017). Differences in delta values between central N (Nα) and terminal N (Nβ) nitrogen atoms, expressed as the metric site preference (SP=δ15Nα–δ15Nβ), have specific values for each production pathway. N2O produced by bacteria has a SP value near 0‰, whereas fungal denitrification results in a SP value ranging from 16 to 37‰. (Toyoda et al., 2005; Maeda et al., 2015). We herein calculated SP values to identify the microbes relevant to N2O emissions from the soybean rhizosphere in a model pot system.
The aims of the present study were to identify and confirm unknown soil organisms other than bradyrhizobial endosymbionts that were relevant to N2O emissions in the model pot system simulating the soybean rhizosphere (Fig. 2).

Inaba et al. (2012) suggested that unknown soil microbes emit large amounts of N2O in the soybean rhizosphere, similar to soybean bradyrhizobia in our model pot system (Fig. 2). To identify some of these unknown soil microbes, we adopted a strategy combining the use of denitrification mutants of B. diazoefficiens USDA110 and a N2O isotopomer analysis in the model pot system (Fig. 2). To eliminate N2O reduction, we used a nosZ minus strain (USDA110ΔnosZ) as a bradyrhizobial inoculant. To further eliminate N2O production by B. diazoefficiens USDA110, we used USDA110ΔnirKΔnosZ defective in both the nirK and nosZ genes (Fig. 2B). In addition to denitrification mutants of USDA110ΔnosZ and USDA110ΔnirKΔnosZ, we changed the inorganic nitrogen source from nitrate to nitrite in the model pot system (Fig. 1B).
Materials and Methods
Bacterial strains and media
The bacterial strains used in the present study were two denitrification mutants of B. diazoefficiens USDA110: USDA110ΔnosZ and USDA110ΔnirKΔnosZ (Inaba et al., 2012). B. diazoefficiens cells were grown at 30°C in HM salt medium (Cole and Elkan, 1973) supplemented with 0.1% arabinose and 0.025% (w/v) yeast extract (Difco).
Model pot system
We previously developed a model system that imitates the field rhizosphere of nodulated soybeans during the late growth period (Inaba et al., 2009, 2012). In the present study, we used this model system for the N2O isotopomer analysis, fungal isolation, and the community analysis (Fig. 2). Surface-sterilized soybean seeds (Glycine max cv. Enrei) were germinated in sterile vermiculite at 25°C for 2 days.
Each seedling was then transplanted into a Leonard jar pot (one plant per pot), which contained sterile vermiculite and nitrogen-free nutrient solution (Inaba et al., 2012). Seedlings were inoculated with mutants of B. diazoefficiens USDA110 at 1×10⁷ cells per seedling. Plants were grown in a phytotron (Koito Industries) under 270 μmol photons m–2 s–1 of photosynthetically active radiation (400–700 nm) with a 16-h light/8-h dark cycle at 25/20°C for 30 days. A nitrogen-free sterilized nutrient solution was periodically supplied to the pots (Inaba et al., 2012).
Thirty days after the inoculation, a soil suspension (30 mL) prepared from 10 g of fresh soil from the Kashimadai Experimental Station (Tohoku University: 38°27″37′N, 141°5″33′E) was added to the vermiculite in the pot after the aboveground plant parts were harvested as previously described (Fig. 2) (Inaba et al., 2012). The pots were incubated in the phytotron for an additional 15 days. Nitrate or nitrite (50 mL of 5 mM) was then applied to the pot before a further 3-h incubation until N2O gas sampling and fungal isolation (Fig. 2).
Analysis of N2O isotopomers
N2O isotopomer ratios were measured on an isotope ratio mass spectrometer (IRMS) (Finnigan MAT252; Thermo Fischer Scientific). Head space gas in the pot of the model system was first sampled into an evacuated 20-mL glass vial with a butyl rubber septum. After transport to the Science Tokyo Laboratory, an aliquot (0.5–10 mL) of the gas sample was diluted with ultra-pure nitrogen gas to prepare a 0.3–10 ppm N2O/N2 mixture in a 100-mL glass container equipped with a vacuum stopcock. The diluted sample was then introduced into an online system consisting of a vacuum line, concentration traps, chemical traps for removing CO2 and H2O, a gas chromatograph (HP6890; Agilent Technologies), and IRMS (Toyoda et al., 2005). Isotopomer ratios were assessed by a mass analysis of molecular (N2O+) and fragment (NO+) ions of N2O for both the sample and reference gas. The notation of isotopomer ratios is shown below and the calibration procedure has been described in detail elsewhere (Toyoda and Yoshida, 1999). The typical precision of the analysis was better than 0.1‰ for δ15Nbulk and better than 0.5‰ for δ15Nα and δ15Nβ.
δ15Ni=15Risample/15Ristd–1, where i=α, β, or bulk (1)
SP=δ15Nα–15Nβ (2)
In equation (1), 15Rα and 15Rβ represent the 15N/14N ratios at the center and terminal sites of nitrogen atoms, respectively; 15Rbulk indicates the average isotope ratios for 15N/14N (=(δ15Nα+δ15Nβ)/2). The subscripts “sample” and “std” indicate the isotope ratios for the sample and the standard (atmospheric N2), respectively. In practice, laboratory reference N2O gas, the δ15Ni of which had been calibrated against atmospheric N2 by the conversion of NH4NO3 with known δ15NNH4 and δ15NNO3 values to N2O, was measured with the sample.
Fungal isolation and cultivation
Degraded nodules from the model pot system (45 days after sowing) were crushed with a glass rod in a Petri dish and suspended in distilled water. Organisms were observed under the phase constant mode (BX51 and DP71 CCD camera, Olympus). Single spores from the macerates of root nodules were isolated on agar plates consisting of Corn Meal Agar (CMA) medium (Nissui) by a Skerman micromanipulator (Skerman, 1968). CMA medium had the following composition (in g L–1): Cornmeal extract, 2.0; agar, 15.0. Single spores were dragged on fresh agar plates (CMA) using the microhook of the Skerman micromanipulator to eliminate attaching bacterial cells on the spore under the microscope, and the agar segment containing a single spore was cut out and transferred to the center of a new CMA plate. The germination of hyphae from the isolated spore was confirmed by microscopy. After plates had been incubated at 25°C for one week, fungal isolates were obtained from mycelia around the front of the colony.
Elucidation of the internal transcribed spacer (ITS) sequence
The genomic DNA of fungal isolates was prepared with an FP DNA SPIN Kit (MP Bio). ITS regions were amplified with two primer sets: 2234C/3126T (Ranjard et al., 2001) and ITS1-F/ITS4-A (Torzilli et al., 2006). Cycling conditions were as follows: initial denaturation at 94°C for 2 min, followed by 30 cycles at 94°C for 1 min, at 60°C for 1 min, and at 72°C for 2 min, with a final extension at 72°C for 10 min. Amplification reactions were performed in a 12.5-μL volume containing 1× Taq buffer, 0.2 mM of the dNTP mixture, 1 μM of each primer, 10 ng of template DNA, and 0.25 U of Ex Taq DNA polymerase (Takara). The PCR products of amplified nuclear sequences were ligated into the pTAC-1 Vector with the DynaExpress TA PCR Cloning Kit (BioDynamics Laboratory), transformed into Escherichia coli DH5α cells with the competent high E. coli DH5 α Kit (TOYOBO) and plated according to the kit protocols. Colonies identified through blue/white screening were cultured in Luria-Bertani broth with 100 μg mL–1 ampicillin at 37°C for 1 day. Sanger sequencing analyses of the ITS region were conducted by Nihon Gene Research Laboratories. A phylogenetic analysis of fungal ITS sequences was conducted as previously described (Watanabe et al., 2011).
Nitrogen transformation by fungal isolates
Each fungal strain was precultured at 25°C on a rotary shaker (120 rpm) in a test tube containing glycerol-peptone broth medium (GP medium). GP medium had the following composition (in g L–1): Bacto peptone, 2.0 (Thermo Fischer Scientific); glycerol, 30; KH2PO4, 1.36; MgSO4·7H2O, 0.2; NaNO2, 0.069; NaNO3, 0.085; FeSO4·7H2O, 0.1; FeCl3·6H2O, 0.1; ZnCl2, 0.02; CuSO4·5H2O, 0.01; NaMoO4·2H2O, 0.005; CoCl2·6H2O, 0.002; MnCl2·4H2O, 0.0016; H3BO4, 0.001; and citric acid, 0.1. The medium was adjusted with KOH to pH 7.5. After 3 days, 1 mL of the culture was transferred to 19 mL of fresh GP medium with and without 1 mM nitrite or 1 mM nitrate in a 120-mL vial. After the inoculation, the flask was sealed and then incubated at 25°C on a rotary shaker (120 rpm).
Aliquots of the head space gas and culture were analyzed after 3, 5, and 7 days of the incubation as described below. N2O concentrations under nitrate and nitrite conditions were measured using gas chromatographs (GC14BpsE and GC2014; Shimadzu) equipped with electron capture and thermal conductivity detectors, respectively. O2 concentrations were measured using a gas chromatograph (GC2014; Shimadzu) equipped with a thermal conductivity detector. Nitrite (Keeney and Nelson, 1982) or nitrate (Cataldo et al., 1975) in the medium was measured colorimetrically (Sameshima-Saito et al., 2006), and the dry weight of cells was used as an indicator of cell growth.
15N-tracer experiment
The fungal isolates FK2 and FK7 were pre-cultured at 25°C on a rotary shaker (120 rpm) in GP medium. After 3 days, 0.12 mL of the culture was transferred to 2.18 mL of fresh medium containing 1 mM 15N-labeled nitrite (99 atom%; sodium salts; Cambridge Isotope Laboratories) in a 14-mL vial. After the inoculation, the flask was sealed and incubated at 25°C on a rotary shaker (120 rpm). The head space gas was analyzed by gas chromatography-mass spectrometry (GC-MS) (GCMS-QP2010 Plus; Shimadzu) (Isobe et al., 2011) equipped with a CP-PoraBOND Q (50 m×0.32 mm) capillary column (Agilent Technologies) 5 days after the incubation.
Microbial community analysis
Soybean plants (cv. Enrei) were harvested on September 9, 2010 (99 days after sowing) in the Kashimadai Experimental Station. After soybean roots were washed well with tap water, nodules were manually collected from the root systems. Nodules were sampled from the model pot systems (45 days after sowing) in a similar manner. The fungal isolates FK1, FK2, and FK3 were cultured with CMA medium at 25°C for 3 days.
Microbial DNA was extracted from cultured cells (FK1, FK2, and FK3) and the surface of nodules using a Fast DNA SPIN Kit for soil (Qbiogene). The nodule sample (0.5 g) was suspended in DNA extraction solution in a 2-mL screw-capped tube. After the addition of glass beads, the tube was processed in a bead beater (Mikro-dismembrator S; B. Braun Biotech International) at 2,600×g for 1 min. A ribosomal intergenic spacer analysis (RISA) was performed to evaluate microbial DNA using the fungal primer sets of 1406f/3126T as previously described (Inaba et al., 2009)
Nucleotide sequence accession numbers
Nucleotide sequences of the ITS obtained from fungal isolates in the present study have been deposited in the DDBJ/EMBL/GenBank database under accession numbers LC034156 to LC034167.
Results
Table 1 shows the SP values and concentrations of N2O under the three experimental conditions. When soybeans were inoculated with USDA110ΔnosZ and supplied with nitrate (experiment A), the resulting SP value and N2O concentration were –3.6±2.7‰ (1s, n=4) and 47±22 ppm, respectively; however, the replacement of the N source from nitrate to nitrite (experiment B) significantly increased both the SP value (4.2±0.5‰, n=3) and N2O concentration (103±11 ppm) (P<0.05, Table 1). Moreover, when the bradyrhizobial inoculant was replaced with USDA110ΔnirKΔnosZ incubated with nitrite (experiment C), the SP value further increased (to 14.4±2.8‰, n=4) (P<0.05, Table 1), whereas the N2O concentration decreased to a level similar to that in experiment A.
Table 1.
Site preference (SP) and amount of N2O evolved from the rhizosphere of soybean plants inoculated with one of two mutants of wild-type Bradyrhizobium diazoefficiens USDA110: USDA110ΔnosZ or USDA110ΔnirKΔnosZ†
| Experiment |
Experimental conditions |
SP (‰) |
N2O (ppm) |
| Inoculant |
Treatment |
| A |
USDA110ΔnosZ |
Nitrate |
–3.6±2.7a |
47±22a |
| B |
USDA110ΔnosZ |
Nitrite |
4.2±0.5b |
103±11b |
| C |
USDA110ΔnirKΔnosZ |
Nitrite |
14.4±2.8c |
47±26a |
† SP and the amount of N2O gas were assessed in three biological replicates after 30 days of plant cultivation followed by decapitation, soil addition, and 15 days of further incubation (Fig. 2). Nitrate or nitrite were added 3 h before N2O sampling (Fig. 2). Values are expressed as the mean±standard deviation. Values marked with the same letter (a–c) within a column do not significantly differ according to Tukey’s test for pairwise mean comparisons at α=0.05.
Since USDA110ΔnirKΔnosZ was unable to produce N2O from nitrite (Fig. 1B), unknown soil microbes may have largely decided the SP value of N2O in experiment C (Table 1). Fungal denitrification has been shown to emit N2O physiologically via cytochrome P450nor (Shoun et al., 2012), which differs from bacterial NO reductase encoded by the norBC genes (Kuypers et al., 2018). The N2O isotopomer analysis is a useful tool for discriminating between fungal and bacterial denitrification processes that emit N2O (Yoshida and Toyoda, 2000). The site preference values of N2O (SPN2O) of fungi (approximately 16–37‰) are generally higher than those of bacteria (approximately 0‰) (Maeda et al., 2015). Since the mutation of the nirK gene (encoding dissimilatory nitrite reductase) in symbiotic bradyrhizobia significantly increased SPN2O from 4.2‰ to 14.4‰ in the presence of nitrite (Table 1, experiments B and C, Fig. 1), these results suggest that N2O emissions via fungal denitrification occurred in the model pot system of the soybean rhizosphere (Fig. 2).
When we microscopically observed the degraded nodules emitting N2O from the model pot system (Fig. 2), we identified fungal hyphae and crescent spores as well as nematoda, protozoa, and very small bradyrhizobial cells (Fig. 3A). We then attempted to microscopically isolate single spores and cultivate them on agar plates (Fig. 3B). We ultimately obtained 12 fungal isolates (FK1 to FK12) and phylogenetically identified them as Fusarium species based on the DNA sequences of their ITS sequences (Fig. 4); most isolates were classified in the Fusarium solani complex.
When the fungal isolate FK2 was cultivated in GP medium, N2O was emitted from FK2 in medium supplemented with nitrite (Fig. 5A), but not that supplemented with nitrate (Fig. 5B) or none (no addition of nitrite or nitrate) (Fig. 5C). Over time, O2 was consumed, and fungal growth was observed in GP media irrespective of the treatments (Fig. 5D, E, and F).
Table 2 summarizes N2O emissions from the 12 isolates grown in the same sets of media and culture conditions as FK2 (Fig. 5). All isolates, except for FK1, strongly converted nitrite to N2O, whereas N2O emissions were not observed in any isolate in the presence of nitrate (Table 2).
Table 2.
N2O production in the presence of nitrite or nitrate in cultures of fungal isolates from degraded nodules in the model pot system†
| Isolates |
N2O emission (N2O-N μmol vial–1) |
| Nitrite |
Nitrate |
| FK1 |
ND |
ND |
| FK2 |
17.7±2.3 |
ND |
| FK3 |
17.2±1.0 |
ND |
| FK4 |
17.7±1.4 |
ND |
| FK5 |
16.1±2.6 |
ND |
| FK6 |
18.0±1.9 |
ND |
| FK7 |
6.4±1.3 |
ND |
| FK8 |
17.6±1.7 |
ND |
| FK9 |
18.0±1.8 |
ND |
| FK10 |
17.8±1.7 |
ND |
| FK11 |
18.2±2.6 |
ND |
| FK12 |
17.8±1.7 |
ND |
† N2O gas in vials was assessed in three biological replicates. These cultures were sampled 5 days after inoculation. Values are expressed as the mean±standard deviation. ND, not detected (<0.18 N2O-N μmol vial–1).
To investigate whether N2O was emitted by Fusarium isolates with nitrite, a tracer experiment was conducted in GP media supplemented with 15N-labeled nitrite (99 atom%) (Table 3) using the isolates FK2 and FK7 representing the Fusarium solani and oxysporum complexes (Fig. 4). The results obtained clearly show that 15N15NO (m/z=46) was the dominant chemical species of N2O molecules in the gas phases of the FK2 and FK7 cultures (Table 3), suggesting that N2O was produced by these fungi exclusively from nitrite in accordance with the following equation: 2NO2–+6H++4e–→N2O+3H2O.
Table 3.
15N-nitrite tracer analysis of cultures of fungal isolates†
| Chemical species |
m/z |
N2O accumulation (N2O-N μmol vial–1) |
| FK2 |
FK7 |
| 15N15NO |
46 |
1.62±0.17 |
1.03±0.10 |
| 15N14NO and 14N15NO |
45 |
0.02±0.00 |
0.02±0.00 |
| 14N14NO |
44 |
ND |
ND |
† The amounts of different isotopes in culture vials of the isolates FK2 and FK7 of Fusarium sp. were assessed 5 days after the inoculation in three biological replicates. Values are expressed as the mean±standard deviation. ND, not detected (<3×10⁻³ μmol vial–1).
To establish whether our Fusarium isolates existed in N2O-emitting soybean nodules in (i) the rhizosphere of field-grown soybeans and (ii) our model pot system (Fig. 2), we compared their fungal RISA profiles with those of our isolated fungi (Fig. 6). A common band was shared by nodules in the field/pot and isolated Fusarium fungi (Arrowheads in Fig. 6). These results suggest that our Fusarium isolates exist in soybean fields and may contribute to N2O emissions from the soybean rhizosphere at field and pot levels.
Discussion
Fungi have not been regarded as relevant to the microbial nitrogen-cycling network in the plant rhizosphere (Baggs, 2011; Kuypers et al., 2018), although ectomycorrhizal fungi associated with plants improve nitrogen absorption and transport via their mycelia (Meena et al., 2023). Fusarium species are cosmopolitan soil fungi belonging to Ascomycota, and often cause significant economic losses of crops as phytopathogens (Todorović et al., 2023). In a previous study, a Fusarium sp. was frequently detected in the N2O-emitting soybean rhizosphere using a community analysis (Inaba et al., 2009). F. oxysporum and F. solani have been shown to denitrify to N2O (Shoun and Tanimoto, 1991). In addition, fungi often account for a large percentage of the soil biomass and have a large N2O production potential (Maeda et al., 2015).
In the present study, the combination of the N2O isotopomer analysis and use of bradyrhizobial mutants in our model pot system suggested the presence of fungal N2O emissions in the soybean rhizosphere. Subsequent fungal isolation, nitrogen transformation assays, and the community analysis indicated that Fusarium fungi mediated N2O emission processes from nitrite in the soybean rhizosphere (Fig. 7). Although the process of nitrite supply has not yet been confirmed experimentally, it is possible that the nitrite supply is relevant to nitrification in the rhizosphere (Sánchez and Minamisawa, 2019).
Since this was the first study to adopt the N2O isotopomer analysis of plant rhizosphere systems, we would like to fully discuss the implications of the results obtained. Since the SP value obtained (–3.2‰) in experiment A (nitrate as the sole inorganic nitrogen source; Table 1) was within the range of the values reported for N2O produced by bacterial denitrification (–6 to 0‰; Toyoda et al., 2017), we considered N2O produced from nitrate to be solely attributed to bacterial denitrification, while N2O reduction by microbes introduced from the soil suspension added was negligible. N2O produced in experiment B (nitrite as the sole inorganic nitrogen source; Table 1) had higher SP values (4.2‰). Three microbial processes are known to produce N2O with higher SP values than that by bacterial denitrification: bacterial and archaeal ammonia oxidation (13–37‰, Toyoda et al., 2017) and fungal denitrification (16–37‰, Maeda et al., 2015). Since ammonia was not added as a substrate in the present study, we considered N2O production by ammonia oxidation to be unlikely; however, the possibility of ammonia forming through the degradation of organic compounds in soybean nodules cannot be excluded. Therefore, we considered N2O to be produced from nitrite by fungi as well as denitrifying bacteria. If we assume that the amount of N2O produced by bacterial denitrification was nearly the same in experiments A and B, the SP value of N2O by fungal denitrification, SPfungi, is then calculated from the mass balance as follows:
nB=nA+nfungi (3)
SPB×nB=SPA×nA+SPfungi×nfungi (4)
SPfungi=(SPB×nB–SPA×nA)/(nB–nA), (5)
where n is the amount of N2O produced and may be replaced with the N2O concentration, and nA is assumed to be equal to the amount of N2O produced by bacterial denitrification (nbacteria). The SPfungi value (10.7‰) obtained was lower than the lowest SP value reported for fungi (16‰; Maeda et al., 2015), which indicates that nbacteria in experiment B was larger than nA.
The result of experiment C may be explained by the suppression of bacterial denitrification due to the lack of nirK and a relative increase in the contribution from fungal denitrification. If we assume that SPbacteria=SPA and SPfungi is within the range of reported values, the contribution of N2O production from fungal denitrification, x, in experiments B and C is then calculated as follows:
SPi=(1–xi)×SPA+xi×SPfungi (6)
xi=(SPi–SPA)/(SPfungi–SPA), (7)
where i=B or C.
With the lowest reported value of SPfungi (16‰), xB and xC are calculated as 0.40 and 0.92, respectively, whereas with the highest value of SPfungi (37‰), they are 0.19 and 0.44, respectively. The N2O concentrations observed in experiments A–C were in accordance with the former case (nB≅nA+nC, where A and C correspond to bacterial and fungal denitrification, respectively). Taken together with SPfungi estimated by eq. (5), the SP value of N2O produced by fungi in the present study appeared to be close to the lower end of the reported range. Regardless of the SPfungi value, our results indicate that N2O is produced by fungi in soybean nodules from nitrite, but not from nitrate, and also that the nirK mutation increased the fungal contribution to N2O production.
Several strategies have recently been proposed to mitigate N2O emissions by N2O-reducing microbes in agricultural settings (Bakken and Frostegård, 2020; Minamisawa, 2022; Hiis et al., 2024). One approach is to develop inoculants for legumes that are strong N2O reducers (Itakura et al., 2013). Bradyrhizobium ottawaense exhibited stronger N2O-reducing activity than B. diazoefficiens, and had a greater potential to efficiently mitigate N2O emissions from the soybean rhizosphere in fields (Wasai-Hara et al., 2020, 2023). Another strategy is to grow N2O-reducing bacteria in digestates from biogas production and apply them to agricultural lands (Hiis et al., 2024). These promising options warrant further study and validation.
The present study revealed the potential of Fusarium to emit N2O in the soybean rhizosphere, which needs to be tested by careful experimental designs in outdoor soybean fields in the future. Laughlin and Stevens (2002) found that the addition of cycloheximide as a fungal inhibitor to grassland soil reduced N2O emissions, suggesting that fungi were responsible for the majority of N2O produced. They proposed that fungal denitrification may be of ecological significance because N2O is the dominant gaseous end product (Laughlin and Stevens, 2002). If this is the case, antifungal organisms and agents may reduce N2O emissions from the soybean rhizosphere (Shen et al., 2021). Our results on the N2O emission potential of fungi in the soybean rhizosphere suggest that specific inhibitors or biological competitors of Fusarium species will reduce N2O emissions from agricultural soils.
Citation
Moriuchi, M., Kuzunuki, K., Ikenishi, F., Sameshima, R., Nakagiri, A., Toyoda, S., et al. (2025) Fusarium Fungi Produce Nitrous Oxide (N2O) from Nitrite (NO2–) in a Model Pot System Simulating the Soybean Rhizosphere. Microbes Environ 40: ME24092.
https://doi.org/10.1264/jsme2.ME24092
Acknowledgements
This study was based on the findings of project JPNP18016 commissioned by the New Energy and Industrial Technology Development Organization (NEDO), by projects 30012B and 27004C of the NARO Bio-oriented Technology Research Advancement Institution, and by Japan Society for the Promotion of Science KAKENHI grant numbers (A) 23248052, (S) 23224013, (A) 26252065, and 26660047.
References
- Baggs, E.M. (2011) Soil microbial sources of nitrous oxide: recent advances in knowledge, emerging challenges and future direction. Curr Opin Environ Sustain
3: 321–327.
- Bakken, L.R., and Frostegård, Å. (2020) Emerging options for mitigating N2O emissions from food production by manipulating the soil microbiota. Curr Opin Environ Sustain
47: 89–94.
- Cataldo, D.A., Haroon, M., Schrader, L.E., and Youngs, V.L. (1975) Rapid colorimetric determination of nitrate in plant tissue by nitration of salicylic acid. Commun Soil Sci Plant Anal
6: 71–80.
- Cole, M.A., and Elkan, G.H. (1973) Transmissible resistance to penicillin G, neomycin, and chloramphenicol in Rhizobium japonicum. Antimicrob Agents Chemother
4: 248–253.
- Hartmann, A., Rothballer, S., and Schmid, M. (2008) Lorenz Hiltner, a pioneer in rhizosphere microbial ecology and soil bacteriology research. Plant Soil
312: 7–14.
- Hiis, E.G., Vick, S.H.W., Molstad, L., Røsdal, K., Jonassen, K.R., Winiwarter, W., et al. (2024) Unlocking bacterial potential to reduce farmland N2O emissions. Nature
630: 421–428.
- Inaba, S., Tanabe, K., Eda, S., Ikeda, S., Higashitani, A., Mitsui, H., et al. (2009) Nitrous oxide emission and microbial community in the rhizosphere of nodulated soybean during the late growth period. Microbes Environ
24: 64–67.
- Inaba, S., Ikenishi, F., Itakura, M., Kikuchi, M., Eda, S., Chiba, N., et al. (2012) N2O emission from degraded soybean nodules depends on denitrification by Bradyrhizobium japonicum and other microbes in the rhizosphere. Microbes Environ
27: 470–476.
- Isobe, K., Koba, K., Ueda, S., Senoo, K., Ueda, S., Harayama, S., et. al. (2011) A simple and rapid GC/MS method for the simultaneous determination of gaseous metabolites. J Microbiol Methods
84: 46–51.
- Itakura, M., Uchida, Y., Akiyama, H., Takada-Hoshino, Y., Shimomura, Y., Morimoto, S., et al. (2013) Mitigation of nitrous oxide emissions from soils by Bradyrhizobium japonicum inoculation. Nat Clim Change
3: 208–212.
- Keeney, D.R., and Nelson, D.W. (1982) Nitrite by colorimetric methods. In Methods of Soil Analysis, Part 2, Chemical and Microbiological Properties, Second edition, Number 9 (part2) in the Series Agronomy. Page, A.L. (ed.) Madison, WI: American Society of Agronomy, Soil Science Society of America, pp. 682–687.
- Kuypers, M.M.M., Marchant, H.K., and Kartal, B. (2018) The microbial nitrogen-cycling network. Nat Rev Microbiol
16: 263–276.
- Laughlin, R.J., and Stevens, R.J. (2002) Evidence for fungal dominance of denitrification and codenitrification in a grassland soil. Soil Sci Soc Am J
66: 1540–1548.
- Maeda, K., Spor, A., Edel-Hermann, V., Heraud, C., Breuil, M.C., Bizouard, F., et al. (2015) N2O production, a widespread trait in fungi. Sci Rep
5: 9697.
- Meena, M., Yadav, G., Sonigra, P., Nagda, A., Mehta, T., Swapnil, P., et al. (2023) Multifarious responses of forest soil microbial community toward climate change. Microb Ecol
86: 49–74.
- Minamisawa, K. (2022) Mitigation of greenhouse gas emission by nitrogen-fixing bacteria. Biosci Biotechnol Biochem
87: 7–12.
- Ranjard, L., Poly, F., Lata, J.C., Mougel, C., Thioulouse, J., and Nazaret, S. (2001) Characterization of bacterial and fungal soil communities by automated ribosomal intergenic spacer analysis fingerprints: biological and methodological variability. Appl Environ Microbiol
67: 4479–4487.
- Ravishankara, A.R., Daniel, J.S., and Portmann, R.W. (2009) Nitrous oxide (N2O): the dominant ozone-depleting substance emitted in the 21st century. Science
326: 123–125.
- Sameshima-Saito, R., Chiba, K., and Minamisawa, K. (2006) Correlation of denitrifying capability with the existence of nap, nir, nor and nos genes in diverse strains of soybean bradyrhizobia. Microbes Environ
21: 174–184.
- Sánchez, C., and Minamisawa, K. (2019) Nitrogen cycling in soybean rhizosphere: sources and sinks of nitrous oxide (N2O). Front Microbiol
10: 1943.
- Shen, H., Shiratori, Y., Ohta, S., Masuda, Y., Isobe, K., and Senoo, K. (2021) Mitigating N2O emissions from agricultural soils with fungivorous mites. ISME J
15: 2427–2439.
- Shoun, H., and Tanimoto, T. (1991) Denitrification by fungus Fusarium oxysporum and involvement of cytochrome P-450 in the respiratory nitrite reduction. J Biol Chem
266: 11078–11082.
- Shoun, H., Fushinobu, S., Jiang, L., Kim, S.W., and Wakagi, T. (2012) Fungal denitrification and nitric oxide reductase cytochrome P450nor. Philos Trans R Soc B
367: 1186–1194.
- Skerman, V.B.D. (1968) A new type of micromanipulator and microforge. J Gen Microbiol
54: 287–297.
- Tian, H., Xu, R., Canadell, J.G., Thompson, R.L., Winiwarter, W., Suntharalingam, P., et al. (2020) A comprehensive quantification of global nitrous oxide sources and sinks. Nature
586: 248–256.
- Todorović, I., Moënne-Loccoz, Y., Raičević, V., Jovičić-Petrović, J., and Muller, D. (2023) Microbial diversity in soils suppressive to Fusarium diseases. Front Plant Sci
14: 1228749.
- Torzilli, A.P., Sikaroodi, M., Chalkley, D., and Gillevet, P.M. (2006) A comparison of fungal communities from four salt marsh plants using automated ribosomal intergenic spacer analysis (ARISA). Mycologia
98: 690–698.
- Toyoda, S., and Yoshida, N. (1999) Determination of nitrogen isotopomers of nitrous oxide on a modified isotope ratio mass spectrometer. Anal Chem
71: 4711–4718.
- Toyoda, S., Mutobe, H., Yamagishi, H., Yoshida, N., and Tanji, Y. (2005) Fractionation of N2O isotopomers during production by denitrifier. Soil Biol Biochem
37: 1535–1545.
- Toyoda, S., Yoshida, N., and Koba, K. (2017) Isotopocule analysis of biologically produced nitrous oxide in various environments. Mass Spectrom Rev
36: 135–160.
- Wasai-Hara, S., Hara, S., Morikawa, T., Sugawara, M., Takami, H., Yoneda, J., et al. (2020) Diversity of Bradyrhizobium in non-leguminous sorghum plants: B. ottawaense isolates unique in genes for N2O reductase and lack of the type VI secretion system. Microbes Environ
35: ME19102.
- Wasai-Hara, S., Itakura, M., Fernandes Siqueira, A., Takemoto, D., Sugawara, M., Mitsui, H., et al. (2023) Bradyrhizobium ottawaense efficiently reduces nitrous oxide through high nosZ gene expression. Sci Rep
13: 18862.
- Watanabe, M., Yonezawa, T., Lee, K., Kumagai, S., Sugita-Konishi, Y., Goto, K., et al. (2011) Molecular phylogeny of the higher and lower taxonomy of the Fusarium genus and differences in the evolutionary histories of multiple genes. BMC Evol Biol
11: 322.
- Yoshida, N., and Toyoda, S. (2000) Constraining the atmospheric N2O budget from intramolecular site preference in N2O isotopomers. Nature
405: 330–334.


