Abstract
Aims: We aimed to determine the effects of nulliparity, maternal age, and pre-pregnancy body mass index (BMI, kg/m2) on the development of pregnancy induced hypertension (PIH) in Japanese women, including gestational hypertension (GH) and preeclampsia (PE).
Methods: Data on 138,530 women with singleton pregnancies who were registered with the Japan Society of Obstetrics and Gynecology and gave birth at ≥22 weeks of gestation during the three years from 2007 and 2009 were analyzed.
Results: PIH was diagnosed in 6,578 (4.7%) women, including 3,326 (2.4%) with GH and 3,252 (2.3%) with PE. PIH was more frequent in nulliparous than multiparous women (relative risk [95% confidence interval], 1.30 [1.24 to 1.37]) and increased linearly with advancing maternal age after 35 years and also with increasing pre-pregnancy BMI. PIH also varied greatly among 24 groups stratified according to 4 maternal age categories and 6 pre-pregnancy BMI categories, with the lowest frequency (2.7%) among lean (BMI<18.5) women 20–34 years of age and the highest frequency (21.7%) among obese (BMI≥30) women ≥40 years of age.
Conclusions: Our findings provide useful information for counseling Japanese women about the risk of PIH at the beginning of pregnancy.
Introduction
According to the “Guidelines for obstetrical practice in Japan 2011”,1) the conditions pregnant women must meet for a midwife-manage care system include a maternal age <35 years and a pre-pregnancy body mass index (BMI, body weight [kg]/body height [m2]) of 18.5 to 25.0. Both advanced maternal age (>35 years) and increased BMI are widely recognized risk factors for pregnancy induced hypertension (PIH), including preeclampsia (PE) and gestational hypertension (GH), in various ethnic groups.2,3,4,5,6,7,8,9,10,11,12,13,14,15,16,17,18,19,20) However, the magnitudes of these two factors for risk of PIH have not been extensively studied among pregnant Japanese women. Defining the exact risk may prove to be important at the beginning of pregnancy. Accordingly, we conducted a retrospective study using a relatively large number of women with singleton pregnancies who participated in a registry system established by the Japan Society of Obstetrics and Gynecology (JSOG) to predict the risk of PIH according to maternal age, pre-pregnancy BMI, and the presence or absence of previous childbirths.
Methods
This study was approved by the Ethics Committee of Hokkaido University Hospital. Approximately 120 secondary and tertiary hospitals participated in the JSOG Successive Pregnancy Birth Registry System, which collected information on successive deliveries that occurred at ≥22 weeks of gestation. Available information included maternal age, parity, gestational week at delivery, body height, pre-pregnancy body weight, body weight at delivery, delivery mode, sex of infant, birth weight, and maternal complications such as PIH, including GH and PE. Diagnoses were assumed to be based on criteria revised by the JSOG in 2005,21) in which women who exhibit a systolic blood pressure ≥140 mmHg and/or a diastolic blood pressure ≥90 mmHg for the first time at ≥20 weeks of gestation in the presence or absence of significant proteinuria (≥0.3 g/day) are diagnosed with PE or GH, respectively.
A total of 192,254 women with singleton pregnancies were registered in the system over a three-year period from 2007 to 2009, corresponding to approximately 6.0% of all singleton pregnancies that occurred in Japan during this period. Of these women, 138,530 were analyzed in this study after excluding 53,724 (27.9%) with unknown age, parity, body height, pre-pregnancy body weight, gestational week at delivery, birth weight of infant, and/or sex of infant. Among the women excluded from analysis, 5,499 (10.2%) were registered as having PIH, including 3,637 women with GH and 1,862 women with PE. We determined the prevalence of GH and PE according to maternal age and pre-pregnancy BMI. The effect of nulliparity on the prevalence of PIH was also determined. Results of analyses regarding associations between maternal age, pre-pregnancy BMI, and occurrence of hyperglycemia in pregnancy were previously reported.22)
Statistical analyses were performed using the statistical software package StatView 5.0 for Macintosh (SAS Institute Inc., Cary, NC, USA) and IBM SPSS Statics 18.0 (SPSS Inc., Chicago, IL, USA). Fisher’s exact test was used to compare frequencies. P<0.05 was considered statistically significant.
Results
Of the 138,530 women studied, 3,326 (2.4%) and 3,252 (2.3%) were registered as having GH and PE, respectively (Table 1). A significantly greater number of women with GH and PE were nulliparous and had higher BMIs pre-pregnancy and at delivery, compared to the 131,952 women who served as the control group. As expected, pregnancy outcomes, such as rates of preterm and cesarean deliveries and a low Apgar score (<8) at 5 minutes, were significantly better among the control group than among women with GH or PE.
Table 1. Demographic characteristics of three women groups
| Controla
(n=131,952) | GHb
(n=3,326) | PEc
(n=3,252) | P<0.05 |
|---|
| Nulliparous | 68,587 (52.0%) | 1,901 (57.2%) | 1,968 (60.5%) | a vs b, c; b vs c |
| Age (years) | 31.5±5.1 | 32.3±5.5 | 32.1±5.4 | a vs b, c |
| <20 years | 1,610 (1.2%) | 49 (1.5%) | 42 (1.3%) | NS |
| ≥35 years | 38,826 (29.4%) | 1,257 (37.8%) | 1,130 (34.7%) | a vs b, c; b vs c |
| BMI pre-pregnancy | 21.1±3.5 | 23.7±5.3 | 23.0±4.9 | a vs b, c |
| <18.5 | 24,313 (35.4%) | 340 (10.2%) | 402 (12.4%) | a vs b, c; b vs c |
| >25.0 | 14,387 (10.9%) | 1,015 (30.5%) | 813 (25.0%) | a vs b, c; b vs c |
| BMI at delivery | 25.0±2.6 | 27.5±5.1 | 26.9±4.8 | a vs b, c |
| Gestational week at delivery (weeks) | 38.2±3.0 | 37.4±3.0 | 36.3±3.7 | a vs b, c; b vs c |
| <37 weeks | 15,688 (11.9%) | 793 (23.8%) | 1,279 (39.3%) | a vs b, c; b vs c |
| <34 weeks | 6,250 (4.7%) | 331 (10.0%) | 628 (19.3%) | a vs b, c; b vs c |
| Birth weight (grams) | 2,886±559 | 2,687±728 | 2,404±823 | a vs b, c; b vs c |
| FGR (<−1.5SD) | 9,684 (7.4%) | 545 (16.4%) | 815 (25.1%) | a vs b, c; b vs c |
| Cesarean delivery | 37,699 (28.6%) | 1,483 (44.6%) | 1,725 (53.0%) | a vs b, c; b vs c |
| Operative delivery | 7,706 (5.8%) | 213 (6.4%) | 182 (5.6%) | NS |
| Apgar score (5’)<8 | 4,921 (3.7%) | 166 (5.0%) | 274 (8.4%) | a vs b, c; b vs c |
BMI, body mass index (kg/m2); FGR, fetal growth restriction; GH, gestational hypertension; PE, preeclampsia; NS, not significant.
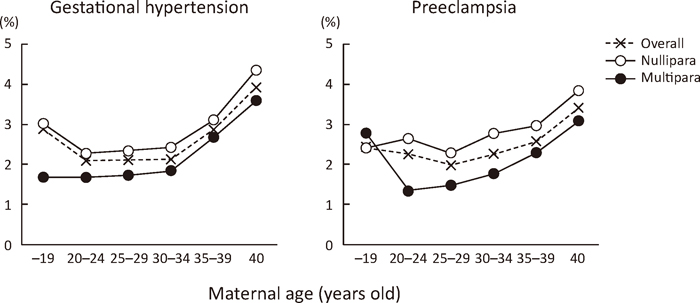
GH developed in 1,901 (2.6%) of the 72,456 nulliparous women and 1,425 (2.2%) of the 66,074 multiparous women, while PE developed in 1,968 (2.7%) of the nulliparous and 1,284 (1.9%) of the multiparous women. This yielded a relative risk (RR) (95% confidence interval [95% CI]) of 1.22 (1.14 to 1.30) for GH, 1.40 (1.30 to 1.50) for PE, and 1.30 (1.24 to 1.37) for PIH among nulliparous women. A consistently higher frequency of GH and PE associated with maternal age (Figure 1) or pre-pregnancy BMI (Figure 2) was seen in nulliparous women compared to multiparous women, except for frequency of PE among women <20 years of age (Figure 1, right).
Effect of maternal age on the development of GH and PE
For the association between frequency of GH/PE and maternal age, a U-shaped curve was seen across age categories. The lowest frequencies in women 20–24 years of age for GH and 25–29 years of age for PE (Figure 1) suggested an increased risk of PIH in both teenage s and women >35 years of age. No large differences in frequencies of GH and PE were seen among women belonging to the age categories of 20–24 years, 25–29 years, and 30–34 years (Figure 1).
Effect of pre-pregnancy BMI on the development of GH and PE
The frequency of GH/PE increased linearly with increasing pre-pregnancy BMI (Figure 2). Among women with a BMI<23.0, the frequency of GH was significantly higher for nulliparous women than for multiparous women. The frequency of PE was consistently higher for nulliparous women than for multiparous women, except those with a BMI≥30. The effect of nulliparity on risk of PIH therefore disappeared in women with a higher BMI.
Effects of maternal age and pre-pregnancy BMI on the development of PIH
The actual frequency of PIH could be useful when counseling women anxious about its development at the beginning of pregnancy. Among 24 groups stratified by four maternal age categories and six pre-pregnancy BMI categories, the frequency of PIH varied greatly. The lowest frequency, 2.7%, was observed among women 20–34 years of age with a pre-pregnancy BMI<18.5; the highest frequency, 21.7%, was observed among women ≥40 years of age with a BMI≥30 (Table 2 and Figure 3). Those 20–34 years of age with a pre-pregnancy BMI<18.5 had a RR (95% CI) of 0.87 (0.79 to 0.97), and those ≥40 years of age with a BMI≥30 had a RR of 6.96 (5.61 to 8.62), compared to the largest group of women 20–34 years of age with a BMI of 18.5–20.9 (Table 2). Risk of PIH increased gradually with advancing maternal age and increasing pre-pregnancy BMI in all groups except for women <20 years of age, where risk increased abruptly among those with a BMI≥30 (Figure 3).
Table 2. Relative risk of developing pregnancy induced hypertension according to maternal age and pre-pregnancy body mass index
| Pre-pregnancy BMI |
|---|
| –18.4 | 18.5–20.9 | 21.0–22.9 | 23.0–24.9 | 25.0–29.9 | 30.0– |
|---|
| Age (years) |
| –19 | 15/391
(3.8%)
1.23 [0.75–2.02] | 34/696
(4.9%)
1.56 [1.12–2.18] | 23/333
(6.9%)
3.16 [2.13–4.67] | 6/114
(5.3%)
1.68 [0.77–3.68] | 6/123
(4.9%)
1.56 [0.71–3.41] | 7/44
(15.9%)
5.09 [2.58–10.1] |
| 20–34 | 519/19,013
(2.7%)
0.87 [0.79–0.97] | 1,255/40,151
(3.1%)
Ref 1.0 | 797/17,795
(4.5%)
1.43 [1.31–1.56] | 491/8,481
(5.8%)
1.85 [1.67–2.05] | 599/7,106
(8.4%)
2.70 [2.46–2.96] | 439/3,070
(14.3%)
4.58 [4.13–5.07] |
| 35–39 | 166/4,772
(3.5%)
1.13 [0.95–1.31] | 500/13,535
(3.7%)
1.18 [1.07–1.31] | 339/7,202
(4.7%)
1.51 [1.34–1.69] | 243/3,607
(6.7%)
2.16 [1.89–2.46] | 337/3,285
(10.3%)
3.28 [2.93–3.68] | 255/1,371
(18.6%)
5.95 [5.26–6.73] |
| 40– | 42/879
(4.8%)
1.53 [1.13–2.06] | 127/2,704
(4.7%)
1.50 [1.26–1.80] | 108/1,647
(6.6%)
2.10 [1.73–2.54] | 85/995
(8.5%)
2.73 [2.21–3.37] | 115/894
(12.9%)
4.12 [3.44–4.92] | 70/322
(21.7%)
6.96 [5.61–8.62] |
BMI, body mass index (kg/m2). Frequency (percent) and relative risk [95% confidence interval] of pregnancy induced hypertension (reference, women 20–34 years of age and pre-pregnancy BMI of 18.5–20.9).

PE is likely to be accompanied with excessive water retention in the third trimester, resulting in edema formation. Indeed, weekly maternal weight gain was exclusively and significantly greater in women with PE than in either control women or women with GH, except for those with preterm deliveries at 22–28 weeks of gestation (Table 3).
Table 3. Weekly maternal weight gain (kg) according to gestational week at delivery in 3 hypertension groups
| Gestational weeks at delivery | 22–28 | 29–32 | 33–36 | 37– | Overall |
|---|
| Gestational hypertension | 0.22±0.20 | 0.25±0.17‡ | 0.25±0.16* | 0.27±0.15‡ | 0.27±0.15* |
| (80) | (170) | (543) | (2,533) | (3,326) |
| Preeclampsia | 0.23±0.18 | 0.28±0.18 | 0.28±0.15 | 0.29±0.15 | 0.28±0.15 |
| (158) | (350) | (771) | (1,973) | (3,252) |
| Neither | 0.19±0.16* | 0.22±0.15* | 0.24±0.13* | 0.27±0.12* | 0.26±0.12* |
| (2,275) | (2,697) | (10,716) | (116,264) | (131,952) |
Weekly maternal weight gain was calculated as follows: net weight gain (kg) during pregnancy (maternal body weight at delivery minus pre-pregnancy body weight) divided by (gestational week at delivery minus two). Number of study subjects is shown in parentheses. ‡ and *, P<0.01 and P<0.001 vs. preeclampsia, respectively.
Discussion
The present study confirmed that nulliparity, an advanced maternal age ≥35 years, and increased pre-pregnancy BMI were risk factors for PIH among pregnant Japanese women.
The frequency of GH and PE according to maternal age and pre-pregnancy BMI was consistently higher among nulliparous than multiparous women, except for the frequency of PE among women <20 years of age (Figure 1 right). This result may have occurred by chance due to the small number of study subjects at this age; the total number of multiparous teenagers was 179, accounting for only 10.5% of the 1,701 teenagers studied. PE occurred in 5 (2.8%) of those 179 teenagers. An increase by one woman affected with PE thus increased the frequency by 0.56% in this small population of study subjects. Although the unadjusted RR (95% CI) of 1.40 (1.30 to 1.50) for PE among nulliparous women in the present study was lower than the 2.91 (1.28 to 6.61) reported by a systematic literature review of controlled studies mainly performed in the western world,4) the reason for this difference is unclear.
The frequency of PIH varied according to maternal age, showing relatively low frequencies among women 20–34 years of age in the present study. Although similar reports used different age categories, they all showed effects in the same direction: maternal age ≥35 years was a risk factor for PE, yielding an odds ratio (OR) (95% CI) of 1.8 (1.4–2.4) in Taiwanese women2); PIH occurred in 2.7% of women 20–29 years of age and 19.8% of women ≥45 years of age in Israel3); and the unadjusted RR (95% CI) of PE was 1.96 (1.34 to 2.87) for multiparous women ≥40 years of age in a systematic literature review of controlled studies.4) A maternal age ≥35 years is thus an apparent risk factor for PIH. Although a young maternal age (<20 years) appeared to be a risk factor for PIH in the present study (Figures 1 and 3), it did not seem to affect risk of PE regardless of the cut-off age used in another study.4) The high frequency of PIH may have reflected the large fraction of nulliparous women, accounting for 89.5% of all 1,701 women <20 years of age.
The frequency of PIH increased linearly with increasing pre-pregnancy BMI in the present study, consistent with results from many studies focusing on the association between pre-pregnancy BMI and the development of PE or PIH.2,5,6,7,8,9,10,11,12,13,14,15,16,17,18,19) For example, the ORs (95% CI) for PIH were 0.26 (0.06 to 1.09), 1.0 (reference), and 8.13 (3.78 to 17.49) among 633 Japanese women with pre-pregnancy BMIs<18.5, 18.5–25, and >25, respectively5); the ORs (95% CI) for PE were 0.62 (0.56 to 0.70), 1.0 (reference), 1.67 (1.61 to 1.74), 2.60 (2.47 to 2.73), and 3.73 (3.52 to 3.95) among 369,347 Danish women with BMIs<18.5, 18.5–24, 25–29, 30–34, and >35, respectively,6); the ORs (95% CI) for GH and PE were 0.56 (0.43 to 0.72) and 0.53 (0.37 to 0.74), respectively, for women with a low BMI<19.8, and 2.13 (1.84 to 1.46) and 1.54 (1.26 to 1.90), respectively, for women with a high BMI>26.0 among 29,268 US women7); and PE occurred in 3.2%, 7.4%, 9.1%, 10.5%, and 13.0% of 854,085 US women with a BMI<30.0, 30.0–34.9, 35.0–39.9, 40.0–49.9, and ≥50, respectively.8) PIH or PE therefore increases with increasing pre-pregnancy BMI, irrespective of ethnicity.
A limitation of our study was that less than 5.0% of all singleton pregnancies that occurred in Japan during the study period were included. Since almost all institutions that participated in the JSOG Successive Pregnancy Birth Registry System were secondary or tertiary hospitals, the fraction of high-risk women, especially with respect to preterm delivery, may have been larger than for the general population. Preterm births at <37 weeks occurred in 17,760 (12.8%) of the 138,530 women in this study, far exceeding the actual incidence of 5.7% to 5.8% during the study period in Japan.23) Because PIH also is a common serious complication, some may think that the frequency of PIH (4.7%) in the present study may have been larger than that among the general population. However, because 5,499 (10.2%) of 53,724 women who were excluded from the present analysis had PIH, the actual prevalence among all 192,254 women was 6.3% (12,077/192,254). The frequency of PIH thus may have been lower than 6.3% among the general population.
In conclusion, we confirmed the following points based on an analysis of 138,530 Japanese women who gave birth to singleton infants over a three-year period: the risk of PIH increased by 30% among nulliparous women compared to multiparous women; the risk of PIH increased linearly with advancing maternal age ≥35 years; the risk of PIH increased linearly with increasing pre-pregnancy BMI; and the actual risk of PIH varied greatly among 24 groups stratified according to maternal age and pre-pregnancy BMI, with the lowest frequency of 2.7% observed among lean (BMI<18.5) women 20–34 years of age and the highest frequency of 21.7% observed among obese (BMI≥30) women ≥40 years of age. These figures would be useful for counseling women on the risk of developing PIH at the beginning of pregnancy.
Disclosure
None declared.
References
- 1. Minakami H, Hiramatsu Y, Koresawa M, et al. Japan Society of Obstetrics and Gynecology; Japan Association of Obstetricians and Gynecologists. Guidelines for obstetrical practice in Japan: Japan Society of Obstetrics and Gynecology (JSOG) and Japan Association of Obstetricians and Gynecologists (JAOG) 2011 edition. J Obstet Gynaecol Res. 2011; 37: 1174–1197.
- 2. Lee CJ, Hsieh TT, Chiu TH, Chen KC, Lo LM, Hung TH. Risk factors for pre-eclampsia in an Asian population. Int J Gynecol Obstet. 2000; 70: 327–333.
- 3. Yogev Y, Melamed N, Bardin R, Tenenbaum-Gavish K, Ben-Shitrit G, Ben-Haroush A. Pregnancy outcome at extremely advanced maternal age. Am J Obstet Gynecol. 2010; 203: 558.e1–7.
- 4. Duckitt K, Harrington D. Risk factors for pre-eclampsia at antenatal booking: systematic review of controlled studies. BMJ. 2005; 330: 565.
- 5. Murakami M, Ohmichi M, Takahashi T, et al. Prepregnancy body mass index as an important predictor of perinatal outcomes in Japanese. Arch Gynecol Obstet. 2005; 271: 311–315.
- 6. Ovesen P, Rasmussen S, Kesmodel U. Effect of prepregnancy maternal overweight and obesity on pregnancy outcome. Obstet Gynecol. 2011; 118: 305–312.
- 7. Athukorala C, Rumbold AR, Willson KJ, Crowther CA. The risk of adverse pregnancy outcomes in women who are overweight or obese. BMC Pregnancy and Childbirth. 2010, 10: 56.
- 8. Mbah AK, Kornosky JL, Kristensen S, et al. Super-obesity and risk for early and late pre-eclampsia. BJOG. 2010; 117: 997–1004.
- 9. Leeners B, Rath W, Kuse S, Irawan C, Imthurn B, Neumaier-Wagner P. BMI: new aspects of a classical risk factor for hypertensive disorders in pregnancy. Clin Sci (Lond). 2006; 111: 81–86.
- 10. Chen Z, Du J, Shao L, et al. Prepregnancy body mass index, gestational weight gain, and pregnancy outcomes in China. Inter J Gynaecol Obstet. 2010; 109: 41–44.
- 11. Sohlberg S, Stephansson O, Cnattingius S, Wikström AK. Maternal body mass index, height, and risks of preeclampsia. Am J Hypertens. 2012; 25: 120–125.
- 12. Fortner RT, Pekow P, Solomon CG, Markenson G, Chasan-Taber L. Prepregnancy body mass index, gestational weight gain, and risk of hypertensive pregnancy among Latina women. Am J Obstet Gynecol. 2009; 200:167.e1–7.
- 13. Driul L, Cacciaguerra G, Citossi A, Martina MD, Peressini L, Marchesoni D. Prepregnancy body mass index and adverse pregnancy outcomes. Arch Gynecol Obstet. 2008; 278: 23–26.
- 14. Hauger MS, Gibbons L, Vik T, Belizán JM. Prepregnancy weight status and the risk of adverse pregnancy outcome. Acta Obstet Gynecol Scand. 2008; 87: 953–959.
- 15. Liu X, Du J, Wang G, Chen Z, Wang W, Xi Q. Effect of pre-pregnancy body mass index on adverse pregnancy outcome in north of China. Arch Gynecol Obstet. 2011; 283: 65–70.
- 16. Cnossen JS, Leeflang MM, de Haan EE, et al. Accuracy of body mass index in predicting pre-eclampsia: bivariate meta-analysis. BJOG. 2007; 114: 1477–1485.
- 17. Leung T, Leung T, Sahota D, et al. Trends in maternal obesity and associated risks of adverse pregnancy outcomes in a population of Chinese women. BJOG. 2008; 115: 1529–1537.
- 18. Belogolovkin V, Eddleman KA, Malone FD, et al. The effect of low body mass index on the development of gestational hypertension and preeclampsia. J Maternal Fetal Neonatal Med. 2007; 20: 509–513.
- 19. Sahu MT, Agarwal A, Das V, Pandey A. Impact of maternal body mass index on obstetric outcome. J Obstet Gynaecol Res. 2007; 33, 655–659.
- 20. Park JH, Lee BE, Park HS, Ha EH, Lee SW, Kim YJ. Association between pre-pregnancy body mass index and socioeconomic status and impact on pregnancy outcomes in Korea. J Obstet Gynaecol Res. 2011; 37: 138–145.
- 21. Watanabe K, Naruse K, Tanaka K, Metoki H, Suzuki Y. Outline of definition and classification of “Pregnancy induced Hypertension (PIH).” Hypertens Res Pregnancy. 2013; 1: 3–4.
- 22. Morikawa M, Yamada T, Yamada T, Sato S, Cho K, Minakami H. Prevalence of hyperglycemia during pregnancy according to maternal age and pre-pregnancy body mass index in Japan, 2007–2009. Int J Gynecol Obstet. 2012; 118: 198–201.
- 23. Maternal and Child Health Statistics of Japan. Information annually released by the Japanese Ministry of Health, Labor and Welfare. Available from URL: http://www.e-stat.go.jp/SG1/estat/List.do?lid=000001101883. Accessed August 7, 2013.