Abstract
A total fertility rate (TFR) of 2.07 is considered necessary for demographic stability in developed countries, but Japan’s TFR (1.30) ranked 35th among 38 OECD countries in 2021. There is a great need for studies about TFR recovery. However, one inhibiting factor is how to adjust for the unstable TFR in small municipalities such as islands. Previous studies proposed methods using standard population or Bayesian correction. A second factor is the nationwide major mergers inhibiting continuous long-term observation of municipalities.
In this study, all municipalities (2000-2020) were divided into 335 secondary medical areas (SMAs). These were divided into two groups: the 26 highest-TFR SMAs showing an increasing trend, and the 12 lowest-TFR SMAs showing a decreasing trend. A total of 18-49-year-old 700 women were selected and administered an anonymous questionnaire. Binary logistic regression analysis revealed that respondents living on islands (odds ratio=26.75) and those whose final education level was high school (1.47) were more likely to belong to highest-TFR group, and that respondents who lived in cities (0.47), were never married (0.35), were married (first marriage) (0.54), and were housewives (0.53) less likely to belong to the highest-TFR group. In addition, the synergy analysis between co-occurrence network words and quantitative analysis showed that Kyushu Region and Okinawa Prefecture, where TFR values are high or rising over time, could be more accurately studied by the new method of ensuring that all the data, including that of small municipalities, is used rather than applying statistical adjustments. The results indicated that women in the highest-TFR group had high expectations for financial subsidies provided by local governments for each stage of pregnancy, childbirth, and childcare. There was no difference in the values toward children, suggesting the need to enhance financial support and maintain a detailed, multi-layered service system surrounding pregnancy, childbirth, and childcare.
Introduction
In developed countries such as the 38 OECD countries, population replacement for demographic stability requires a total fertility rate (TFR) of at least 2.07 [1]. Japan’s TFR value for 1966, a Fire Horse year (the 43rd combination of the sexagenary cycle and an extremely inauspicious year to give birth, according to superstition) [2] was 1.58, down from 2.14 in the previous year. The following year, however, the value showed a quick V-shaped recovery to 2.23[3].
Unfortunately, the birth rate gradually declined after that, and 24 years later the Japanese government issued a policy recommendation [4] in response to the so-called “1.57 Shock” in 1990 [5]. Since then, the National Institute of Population Research and other organizations have issued numerous studies and forecasts on the fertility rate. In addition, according to the statistics for 2021, Japan’s TFR stood at 1.30, ranking 35th out of 38 OECD countries [6]. The Cabinet Office’s 2014 White Paper on Society with Declining Birthrate [7] identified the following three factors as the main causes: (i) the increase in late marriages, (ii) the decline in fertility of couples, and (iii) the increase in unmarried couples. Various educational and administrative countermeasures against these negative factors have been implemented. Even so, the TFR has continued to decline and has not shown a recovery trend for half a century since 1975. This condition, in which the TFR cannot exceed 1.5 over a long period of time, means that Japan is classified as one of the lowest-low or very low fertility countries [5, 8] in the classification system used by OECD.
Unfortunately, the various measures taken by the Japanese government have not yet resulted in a TFR recovery trend. Individuals and families (married couples) make their own childbearing decisions, but at the present stage, where the so-called “1.57 Shock in 1990” [5] has continued for more than 30 years, it is necessary to reexamine whether the individual “favorable environment and health policies for childbirth and childcare” of local governments have been successful in helping individuals and families make decisions, and whether these policies and national measures have meshed well with each other. In order to determine which measures will be most effective for this purpose going forward, the first thing to focus on the treatment of statistical indicators related to TFR. It is possible that too much focus on statistically equalizing coincidental changes in demographics of small municipalities might make it difficult to detect factors with high local characteristics that might maintain or increase fertility rates. Previous studies on fertility rates and TFR have looked at the national values [8], the 47 prefectures [9], Kyushu Region and the Nansei Islands [10], specific prefectures [11], and the islands [12, 13].
Each study struggles to find an adequate method for evaluating the demographics of small municipalities such as islands and mountainous areas. There are two methods [14, 15, 16, 17] to correct for drastic changes in the TFR of a small municipality: the method of equalizing the demographics of small municipalities using the standard population of the surrounding municipalities using Bayesian statistics developed by the Ministry of Health, Labour and Welfare, and the other method of using the child-woman ratio [15, 17] of 0-4 years per 1,000 women aged 15-49 years, which is excellent method for equalizing large fluctuations in figures due to highly random changes in municipalities with small populations. However, these existing methods are not representative of the current TFR of a municipality because the TFR of islands and other areas often becomes more uneven from year to year if the raw data is used as is, and the TFR information of surrounding municipalities is used to equalize them. While this method reduces the chance errors in the self-governing statistics and makes the data more comparable among municipalities, it does not use raw data from small population areas, so there is a high risk of missing factors that increase (or decrease) the TFR unique to each municipality. The verification of factors related to TFR using SMA units with high geographical proximity and similarity of life bases was adopted as a method to utilize the raw data as it is.
Another obstacle to the 20-year time-series study using SMAs is the so-called “Heisei Great Mergers” [18], which saw the number of municipalities abolished and merged on a large scale during the 2000-2020 period, reducing the number of municipalities by almost half to 1,724. This made it difficult to track the demographic trends of many municipalities over this long period. Therefore, it was necessary to develop a long-term observation method using raw data of births in small municipalities (not equalized by surrounding data). This method was composed of two new sub-methods as sub-Method-1: abolition of municipalities due to the Heisei (1989-2019 Japan year name) Great-Mergers and recovery of comparability of municipalities before and after the merger, and sub-Method-2: living area units consisting of multiple municipalities.
In order to achieve above sub-method 1 and 2, raw TFR data for 1,750 municipalities nationwide from 2000 to 2020 were aggregated into 335 Secondary Medical Areas (SMAs), which roughly correspond to living areas, and the results were used to determine which SMAs had a strong downward trend based on the 20-year time series variation pattern. The purpose of this study was to clarify and compare the individual characteristics, residential environments, and attitudes toward childbirth and childrearing of women who reside in SMAs with a strong downward trend with those who reside in SMAs with a stable high or upward trend that has recently exceeded the national average, based on a 20-year time-series variation pattern.
Material and Methods
1. Questionnaire design
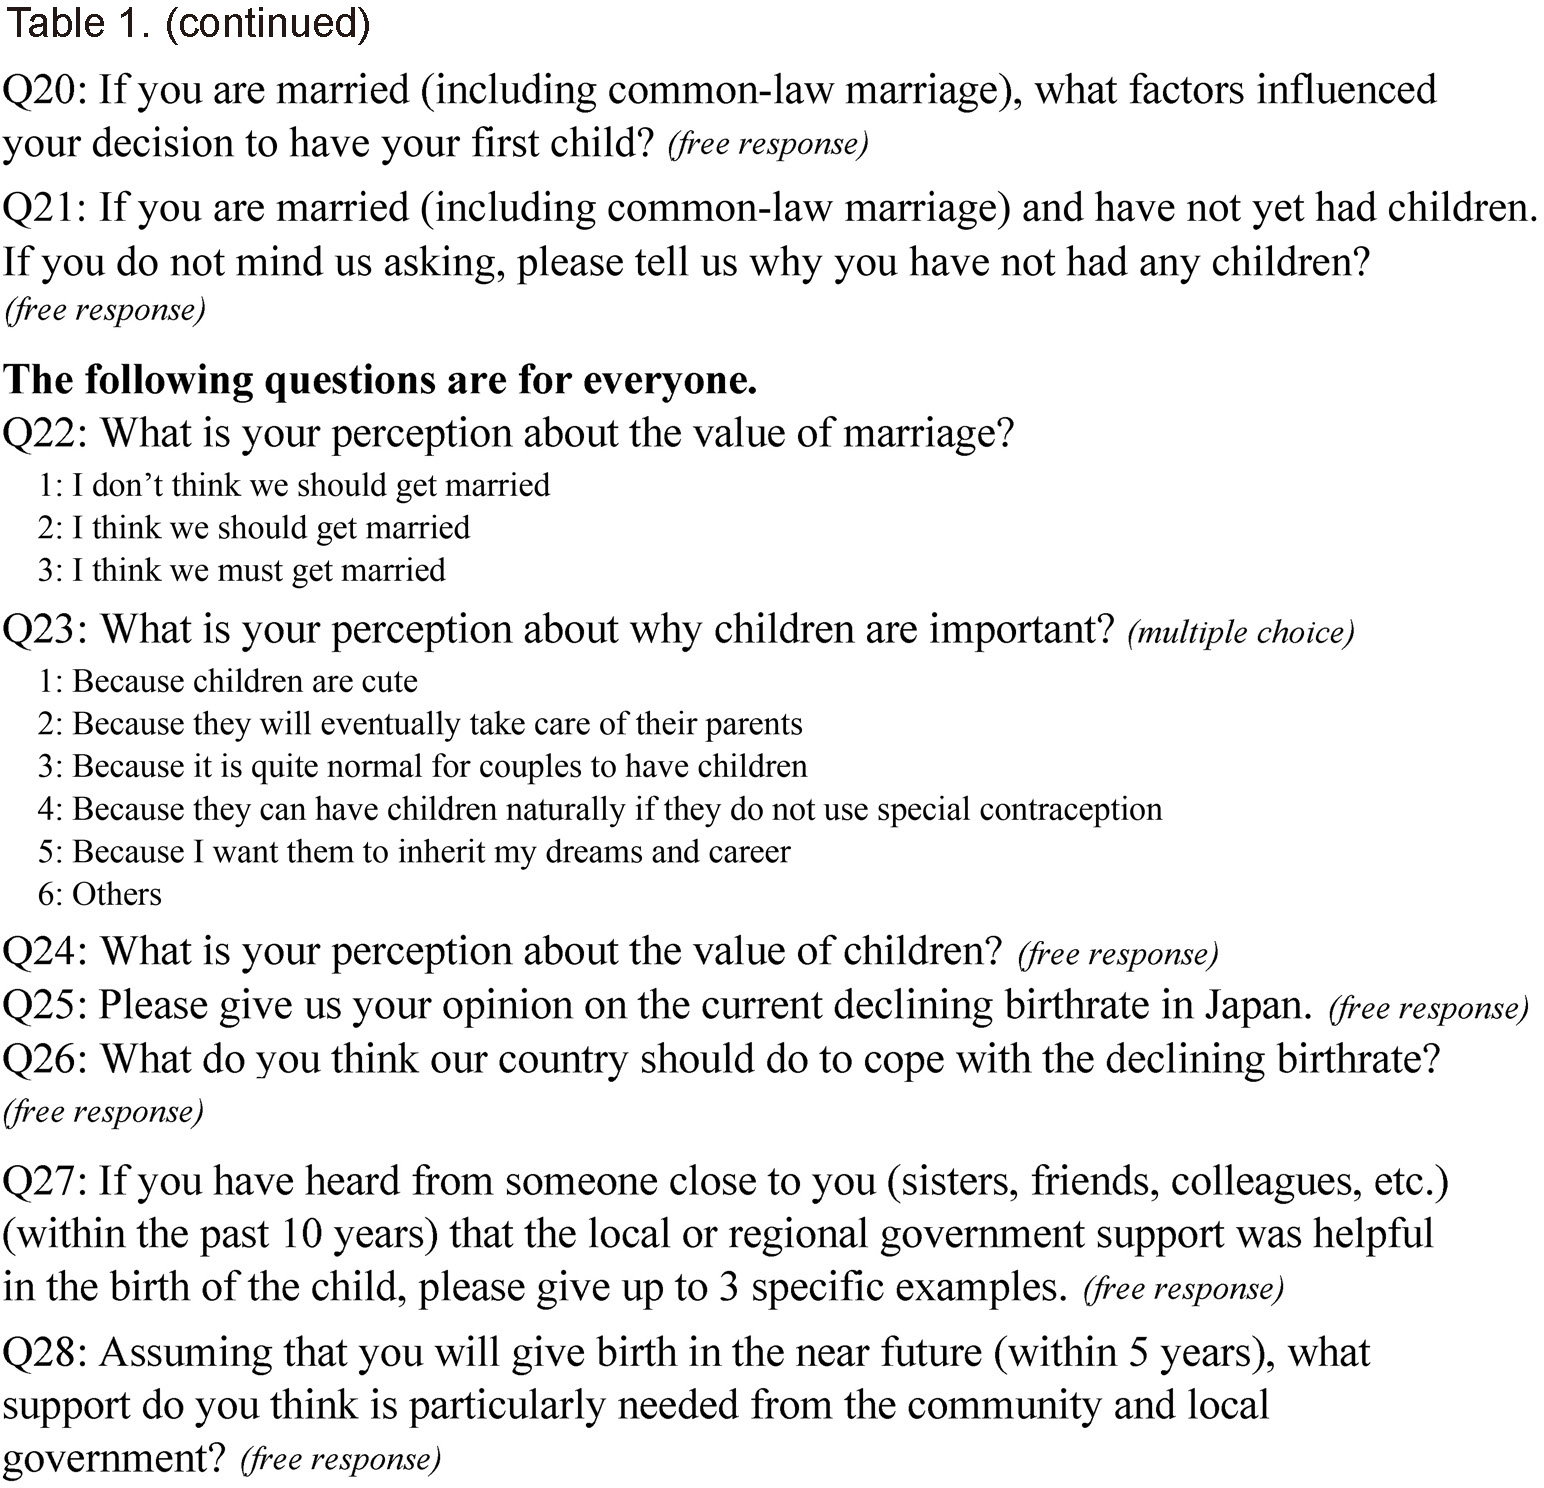
Among women aged 15-49 years who were the target of TFR calculation, geographical and living environment, personal information (age, marital status, childbearing experience, last education, occupation, income, etc.), and values toward children were collected for women aged 18-49 years in categories related to pregnancy, childbirth, and childcare. The respondents were also asked to write freely about their values toward their children, neighborhood support for childbirth and childcare, and opinions about local and national governments, focusing on the three items that were most important to them. Table 1 shows the questionnaire. The total number of questions was 28, eleven of which were free format.
2. Calculation of TFR and time-series correlation analysis and categorization of 335 SMAs in Japan for the last 20 years.
1) Organized information on municipal mergers in the last 20 years (2000-2020)
According to the government statistics (e-Stat), the number of municipalities in Japan [18] over the 20-year period 2000-2020 has changed from 3,235 to 1,724 after the so-called “Heisei Great Mergers”. The number of SMAs, which are composed of several adjacent municipalities based on geographical conditions, daily living areas, transportation conditions, etc., is 335 as of 2020.
2) Changes in Municipal TFR over the Last 20 Years (2000-2020)
Population and number of births were aggregated by assuming that all municipal mergers during this period were merged from 2000 A.D., and then further aggregated for each of the 335 SMAs.
3. Calculation of TFR for each SMAs
The TFR is calculated as the average number of children a woman gives birth to between the ages of 15 and 49. The questionnaire was administered to women aged 18-49 years in consideration of restrictions in ethical regulations.
4. Selection of Lowest-TFR and Highest-TFR SMAs
Seventeen SMAs were selected as the Lowest-TFR group, which were the bottom 5% of the mean3y. The mean3y was the average TFR for 2018, 2019, and 2020 for each of the 335 SMAs. The 12 SMAs, excluding the 5 SMAs with unstable TFR trends over 20 years, were defined as the Lowest-TFR group. On the other hand, when sorted in descending order of mean3y, the average TFR value for the whole country in 2020 was 1.33, so the 26 SMAs that showed more than this value were designated as the Highest-TFR group.
5. Analyses
1) Analysis Software
The software use for analyses were Excel 2306, STATA14.0, SPSS (28.0.0), and Statistical R.
2) Basic statistics
Basic statistics were calculated using STATA 14.0 and Statistical R according to the scale of each indicator shown in Table 1.
3) Stepwise binary logistic regression analysis
Stepwise binary logistic regression analysis (st-bLRA) using IBM SPSS (28.0.0) with the criteria of Pin<0.15 and Pout>=0.15 according to the standard [13] input-output criteria for explanatory (independent) variables. The objective (dependent) variable was dichotomous (0: Lowest-TFR, 1: Highest-TFR), and the initial explanatory variables were twelve variables (Q1, Q3, Q4, Q5, Q6, Q7, Q8, Q9, Q11, Q12, Q22, and Q23 in Table 1). Except for age (ratio scale), the indicators were nominal scale (nom) or ordinal scale (ord) indicators. They are type of municipality (nom, 4 categories), geographic environment of residence (nom, 7), years of residence (ord, 4), married/unmarried (nom, 6), final stage of education (nom, 9), Occupational classification (nom, 9), employment status (nom, 7), personal income (ord, 11), family income (ord, 11), value of marriage (nom, 3), and value of children (nom, 6). All explanatory variables except age were treated as binary dummy variables [19].
In order to maintain the precision of the st-bLRA model, multicollinearity of each variable coefficient was strictly checked based on the criteria that the standard error of each variable should be less than 2.0 based on the SPSS manual [20].
4) Synergy analyses of quantitative and qualitative data
Among the free-response questions in the questionnaire, Q27 and Q28, which were related to the attitudes of women (18-49 years old) toward childbirth and childcare, were analyzed for the two groups (the lowest- and the highest-TFR) using Co-Occurrence Network of Words (CONWs), a method of quantitative text mining analysis, by using KH Coder [21], a free software program developed by K. Higuchi at Ritsumeikan University in Japan. Synergy analyses of CONWs and quantitative analyses have been employed in several studies [22,23,24].
For Q27, the keywords related to “support from their communities and governments experienced by people close to them” were identified and their contexts were checked. The KH Coder was applied to all the responses, and synonyms (e.g., nursery, preschool) were unified, while similar words (e.g., childcare, child-rearing) were used as is. The number of respondents was the same in all seven age groups in the two groups, so the comparability [4] was high in interpreting the CONWs for the two groups.
CONWs were conducted on two of the eleven free-response questions, “women’s experiences of support for childbirth and childcare from the local community”, and their “expectations for support assuming they will give birth in the near future (within 5 years)”. Figures of CONWs were analyzed by using the KWIC (keyword in context) concordance function and other functions in KH Coder to interpret the context of clusters consisting of the keywords extracted for each participant and the lines connecting them. The frequency of keywords appearing in the CONWs diagrams were compared between the two groups using Fisher’s exact test or Cochran-Armitage trend test.
6. Ethical approval
This study was conducted in full accordance with ethical principles, including the World Medical Association Declaration of Helsinki, and it was approved by the Ethical Review Committee of Niigata University of Health and Welfare on April 14, 2023 (No. 19018-230414).
The questionnaire included a page entitled, “Ethical considerations” which described the purpose of the study, the anonymous nature of the survey, participation based on free choice, and the absence of disadvantage of non-participation. Answering the questionnaire was deemed as consent to participate.
Results
1. Selected SMAs
Fifty-four percent of the nation’s 26 highest-TFR SMAs were located in the Kyushu Region, and 24% of the Kyushu Region consisting of 58 SMAs, belonged to Highest-TFR SMAs. Also, all five SMAs (100%) of Okinawa Prefecture were selected to Highest-TFR group.
2. Subjects and relevant indices
Table 2-Tab-01 shows the data of the 700 respondents by seven age groups (18-49 years old) and by lowest-TFR and highest-TFR group. All groups in each cell of Tab-01 were equal in number, at 50 each. Thus, there was no difference in composition between the two groups (p=1.000 by 7×2 chi-square test).
Tab-02 showed how many participants lived in each of the four types of municipalities, by lowest-TFR and highest-TFR group. The Highest-TFR group showed a significantly (p<0.01) higher proportion of participants living in cities, towns, and villages and a significantly lower proportion living in wards. Tab-03 showed that the rate of highest-TFR is significantly higher (p<0.01) in both mountainous areas (including “satoyama” in Japanese) and islands (not including peninsulas) (p<0.01). On the other hand, the rate of lowest-TFR is significantly higher (p<0.01) in urban areas. Tab-04 shows that there were not any differences between the two groups in terms of length of residence.
Tab-05 showed that the rate of unmarried (single) persons was higher (p<0.05) in lowest-TFR group, whereas the rate of common-law relationships was higher (p<0.05) in highest-TFR group. Tab-06 showed that there were not any significant differences regarding the value of marriage between the two groups.
Tab-07 showed that there were not any significant differences in the final education level between the two groups. Tab-08 showed that there were not any significant differences in occupational classification between two groups.
Tab-09 showed that there were not any significant differences in employment category between the two groups. Tab-10 showed that there were not any significant differences in personal income between the two groups. However, the percentage of participants refusing to answer this question was over 25% in both groups. Tab-11 showed that there were not any significant differences in family income between two groups. However, the percentage of participants refusing to answer this question was over 38% in both groups. Tab-12 showed that there were not any significant differences in the value of children between the two groups.
3. Stepwise binary logistic regression analysis
Table 3 shows the results of the st-bLRA with the objective variable set as 0 for the lowest-TFR group and 1 for the highest-TFR group. If the odds ratio is significant and the indicator greater than 1, the proportion of the highest-TFR group is significantly higher, such as with island residence (OR=26.8, p<0.001). The next highest odds ratio was for those who had completed high school (1.48, p=0.023). On the other hand, when the odds ratio was less than 1, the lowest-TFR group was more likely to be present, such as with respondents who lived in the city (0.47, p<0.001), were single (0.35, p<0.001), were married (first marriage) (0.54, p=0.049), and were housewives (0.53, p=0.019). The factors of living in the mountains, living in the suburbs, and the feeling of thinking children are cute were found not to be significant components (p<0.15) of the optimal st-bLRA model.
4. The differences of attitudes of women toward childbirth and childcare
Figure 1 shows the CONWs of “Support from their communities and governments experienced by people close to them” of the two groups. The number of context units composed of co-occurring keywords and lines was five for the lowest-TFR group and four for the highest-TFR group. Interpreted by the KWIC concordance, the concepts indicated by the four context subgraphs of highest-TFR respondents in Figure 1 were lump-sum maternity payments, childcare-parenting benefits, free admission to daycare centers and free medical care, and child allowances. The lowest-TFR group respondents similarly mentioned the distribution of a lump-sum payment for childbirth, coupons for antenatal checkups, and free medical care, but they additionally raised the topics of childcare/child-rearing support from municipalities, childcare at company-based childcare centers, and health checkup services at home. Table 4 shows the number of affirmative and negative replies to the Q27: “Support from their communities and governments experienced by people close to them”. The 9.1% of women in the lowest-TFR group and 14.3% of women in the highest-TFR group answered “Yes”, which was a significant difference (p<0.05).


Figure 2 shows the CONWs of “Assuming that the respondent will give birth in the near future (within the next 5 years), what would the respondent particularly need in terms of support from the community and local government” for the two groups. The major difference between the two groups is that the number of context subgraphs is three in the lowest-TFR group and twice as many (six) in the highest-TFR group. In the highest-TFR group, the six context subgraphs are (i) free childcare (daycare, medical care), (ii) support (financial support, childbirth), (iii) childcare (improved childcare facilities, one-time payment), (iv) childcare support (babysitting, support for mothers themselves), (v) childcare consultation services, and (vi) child allowance. On the other hand, the lowest-TFR group tended to be less diverse with three context subgraphs, and each keyword appeared less frequently. This is supported by the fact that the highest-TFR group has more items (p<0.01) than the lowest-TFR group in the number of items expected in the Cochran-Armitage trend test shown in Table 5. The survey had the same number of respondents in all seven age groups in the two groups, so the comparability [4] was high in interpreting the CONWs for the two groups.


Discussion
1. Significance of TFR analysis using SMAs
TFR of 2.07 or over is considered necessary for demographic stability in developed countries, but Japan’s TFR ranked only 35th among the 38 OECD countries in 2021 [6]. Research conducted for the purpose of restoring TFR to 2.07 or higher is urgently needed. Especially, there are many family policies and maternity support measures that should be learned from OECD countries. Concurrently, it is important to conduct research within Japan. However, one obstacle in conducting such studies is how to evaluate and adjust the unstable TFR in small municipalities such as islands. Previous studies proposed methods using standard population or modified Bayesian correction. Another obstacle is how to conduct long-term observation of demographics that were disrupted by the nationwide major mergers from 1999 to around 2010.
In this study, as a response to the two obstacles mentioned above, a new method was introduced to organize and evaluate all municipal merger information for the period of 2000-2020 nationwide as 335 SMAs representing the status as of 2020. SMAs roughly match the living areas [25] in the 47 prefectures consisting of 1,724 (as of 2020) municipalities nationwide. Living area [26] refers to an area that is wider than a city, town, or village. It is defined as encompassing the commuting, schooling, health care, shopping, and other essential daily activities of local residents, so it includes the educational institutions (high schools), medical institutions (SMAs), and commercial facilities within that sphere.
Here, a fundamental problem arises, namely that the detection of “favorable special characteristics contributing high and stable TFR” of small municipalities are statistically degraded if a standard population method is introduced for the evaluation of small-scale TFRs or the method of changing the TFR real value by Bayesian statistics is used as an adjustment method [27] to equalize with the demographics of surrounding municipalities, etc. According to Yamauchi [5], when the population of municipalities are 50,000 or more, the error rates between the TFR using the standard population and the TFR using raw data are below 10% in approximately 90% of cases. On the other hand, when the population of municipalities are less than 5,000, the error rates of less than 10% drop to approximately 50%. However, when the population is less than 5,000, the error rate rises to 50%.
The method used in this study, which analyzes the data in units of SMAs, has the advantage of avoiding these errors by evaluating the total raw number of births. In addition, based on the results of the correlation analysis of the 2000-2020 TFR increase/decrease trends for each SMA, we selected 12 SMAs that showed a clear long-term decreasing trend in TFR values or a continued low TFR, and we compared those with 26 SMAs showing a clear trend of increasing or continuing high TFR. The personal and regional information of women aged 18-49 belonging to both groups were compared using the statistical restriction method [28].
2. Comparison of the results of this study to previous studies
1) Geographic and demographic characteristics of regions with the highest TFR
There has been much debate about to how to view fluctuations in the number of births in islands or mountainous areas with small population sizes as a factor in the increase/decrease of TFR. Ito [11] and Kikuchi [12] looked at islands in Okinawa Prefecture; Masuda [10] reported on Iwate Prefecture; Sasai [30], Masuda [10], and Muramatsu et al. [29] obtained results revealing the high TFR in Kyushu Region and southwestern islands; and Sasai [30] and Masuda [10] compared prefectures across Japan. Of note here in relation to this study is Masuda’s study [10] of the fertility rates per municipality (1990-2010) and per prefecture for Kyushu Region and the southwestern islands.
According to Masuda [10] and Muramatsu [29], Kyushu Region has (i) a high proportion of women of the appropriate age, (ii) a high rate of married young women (low unmarried rate), (iii) a high rate of married births (high number of children), (iv) a high number of illegitimate children (children born outside of marriage), (v) a high percentage of births by women in their 20s, and (vi) a very high percentage of third and subsequent children. The results of this study are consistent with those of Masuda and Muramatsu mentioned above. First, the 14 highest-TFR SMAs (24% of the total SMAs) in Kyushu Region and all 5 SMAs (100%) in Okinawa Prefecture were selected. Yumoto et al. [13] classified 288 islands into 17 types based on natural characteristics (5 types), living environment (4 types), primary industry (4 types), and attractive characteristics (4 types). It was found that natural characteristics had by far the largest impact on population growth, especially in tropical islands: about half of the tropical islands are experiencing increasing population. Secondly, the study showed that women (18-29 years old) living in the highest-TFR SMAs were 26.8 times more likely to live on an island than women of the same age group living in the lowest-TFR SMAs, even after adjusting for confounding factors using st-bLRA. Therefore, the question remains, “Why do islands increase the TFR?”. Further research is needed on the relationship between tropical islands and population growth, as shown by Yumoto et al. [13].
Table 2-Tab-03 showed that significantly higher proportions of respondents living in islands and in mountainous areas were in the highest-TFR group, but mountainous areas did not reach significance (p=0.087) by st-bLRA ( 3). Urban areas had a significantly higher percentage belonging to the lowest-TFR group in both Table 2 and st-bLRA. This phenomenon has been observed not only in Japan [31] but also in South Korea [32] and Finland [33]. On this point, therefore, the results of this study are consistent with the results of previous studies in showing that fertility rates are lower in urban areas than in rural areas. In Finland [33], the low fertility rates in the capital city and the high rates in small cities and rural areas were found to be due to housing conditions. Most rural and small-town housing is larger than urban housing. Furthermore, once a child is born, the tendency to move to a larger house increases significantly [33, 34]. In addition, a report from China [35] confirms the strong inverse correlation between housing prices and fertility rates in urban areas.
In Table 2-Tab-05, the significantly lower rate of never-married persons and the significantly higher rate of common-law marriages in the highest-TFR group likely reflect phenomena (ii) and (iii) above, which are from Masuda [10]. The single variable analysis (Table 2-Tab-05) shows that there was no significant difference in the ratio of married (first marriage) women between the lowest-TFR and highest-TFR groups. However, this ratio was significantly higher in the lowest-TFR group than the highest-TFR group. This phenomenon is due to confounding factors skewing the results, and the st-bLRA results adjusted for confounding factors are interpreted as correct.
On average, the percentage of births outside of marriage in OECD countries was 42% in 2020 [36], with 13 countries at over 50%, France at over 60%, and Chile and Costa Rica at over 70%, which are extremely high rates compared to Japan; while the unmarried birth rate in Turkey, South Korea, and Japan are the smallest, around 2 to 3%, and Japan is the lowest among OECD countries [36]. For the time being, Japan is unlikely to focus on the increase in the nonmarital birth rate as a factor for the rise in the TFR. However, in a study by Yamauchi [37], the contribution of the nonmarital birth rate was pointed out as one of the reasons why Okinawa Prefecture has the highest birth rate in Japan. Further research is needed in Okinawa Prefecture to determine how to position nonmartial birth as a factor in TFR recovery. In addition, the feasibility of public support for pregnancy, childbirth, childcare, and child rearing practices that are common to OECD countries with high TFR and high nonmartial birth (France, Iceland, Mexico, Sweden, etc.) should be examined [6, 36].
Second, there were no significant differences in final education between the two groups, as seen in Table 2-Tab-07. However, the number of respondents whose final education is high school graduation was significantly higher in the highest-TFR group by st-bLRA. This was related to (i), (ii), and (iii) in Masuda’s analysis [10], particularly in that those in high-TFR groups often marry at a relatively young age. Reports from South Korea [32], Sweden [38], and Turkey [39] also indicate that lower education is associated with higher fertility. In contrast, no significant association between low education and fertility was found in Finland [40]. In this study as well, no significant difference in final education was found between the two groups, as seen in Table 2-Tab-07. However, high school graduation became significant in st-bLRA, so it was inferred that it was correct not to adapt a simple steady downward trend to examine final education and fertility. There is a strong link between women’s entry into the workforce and women’s higher education, with the percentage of women with a four-year college degree [8] increasing each year, and the college education rates approaching 55.6% of men and 47.6% of women as of 2015, with the gap narrowing. According to Abe [8], the higher education of women not only postpones marriage and childbearing, but also increases their wage potential and changes women’s views of family, occupation, and gender, leading to a postponement of family formation. The higher education of women leads to a postponement of marriage and childbearing.
2) Influence on TFR of the childbearing and childrearing environment characterized by traditional patriarchal family roles National policy on TFR [5] is said to consist of family policy and natal policy. Atoh [5] states that family policy was consistent with the “family and gender view” before the TFR 1.57 Shock in 1990. The “family and gender view” is the perception that “women, like men, find jobs after graduation, but after marriage they leave the workforce and become housewives, concentrating on housework and child rearing”. This was supported by the employment status of their male spouses, which was characterized by lifetime employment, seniority, and seniority-based wages. However, as these employment patterns have changed and women’s participation in society has progressed, various laws and regulations have been revised over the years to provide legal protection for poor or single-mother families and to support the availability of licensed daycare centers.
On the other hand, there was no significant difference in the number of housewives between the two groups in Table 2-Tab-08. However, there were more housewives in the low-TFR group, and the difference was significant by st-bLRA. This may be due to the presence of a confounding factor [28] which distorted the results and sometimes makes no apparent difference in the background. Therefore, the st-bLRA results should be the focus of the interpretation, meaning that housewives are less likely to give birth. It is presumed that there is a clear difference in the economic situation between stay-at-home housewives and working women. It is true that the “lump-sum childbirth and child-rearing allowance” [41], as of 2023, provides JPY 500,000 (USD 3,440 as of August 2023) via medical insurance at the time of childbirth. However, the bulk of the lump-sum maternity and childcare allowance is used to cover the cost of childbirth, and no allowance is made for subsequent childcare costs. On the other hand, Japanese single-mother employees generally can take a year off from work and will receive up to two-thirds of their base salary. In addition, economic and social changes due to the 2020-2023 COVID-19 pandemic have left many people still hesitant or postponing childbirth [42]. After the COVID-19 pandemic, people’s work, household finances, and daily lives have changed [43]. These economic problems, combined with the public health crisis itself, have made the decision to have children more difficult for housewives living in not only metropolitan areas but also in small and medium-sized cities, towns, villages, or islands. Among the factors contributing to a full-time housewife’s decision to give birth, those known in advance include the lump-sum childbirth allowance, the annual income of the spouse (or family), and whether the mother lives with or near her own mother who can provide childcare support. The critical difference between the two groups is whether or not they are confident that they will receive enough support. The evidence suggests that, although stay-at-home mother is not a very common employment status in the lowest-TFR group, in the case of stay-at-home mothers living in urban areas, the surrounding environment is less likely to support a positive attitude toward childbirth and childrearing than for those in other types of employment. This interpretation is supported by the results of the two CONWs and trend tests in this study. On the other hand, for full-time housewives, the ratio difference between the two groups was not significant in Table 2-Tab-08, but it was significant for the high-TFR group after adjusting for confounding factors in the st-bLRA. Therefore, the interpretation of the st-bLRA results is that the lowest-TFR group tended to have more childbearing and the highest-TFR group tended to have fewer childbearing, suggesting that being a housewife makes it more difficult to give birth to a child. It is said that until now, Japan’s fertility reduction measures [5] have focused on family policy regarding childbirth and childcare, and not on pro-natalist policies [5]. In fact, after the 1.57 Shock of 1990, the Child Care Leave Law (changed to the Child Care and Family Care Leave Law in 1995) was enacted in 1991, the Angel Plan was enacted in 1994, the Basic Law for Gender Equal Society was enacted in 1999, the Child Allowance Law was revised in 2000, the Basic Law on Measures for Society with Declining Birthrate was enacted in 2003, the Child Welfare Law was revised in 2004, and the Law to Support the Development of the Next Generation was enacted in 2005. In 2009 the Child Care and Family Care Leave System was revised, and in 2010 the Child Allowance was launched. Each of these policies contributes to the improvement of the declining birthrate but has its limitations [44]. For example, child allowances provide family support but do not increase fertility. The government has been implementing “Operation Zero Waiting Children” to address the problem of childcare centers, which has become an issue from time to time, but this has yet to reassure the public who are thinking about having a baby [5]. However, this study reveals that the current environment is inadequate for full-time homemakers to make the decision to give birth and raise children. In particular, active childbearing promotion policies have rarely been attempted or succeeded at the national level; the TFR survey is heavily influenced by the female population and marriage rates by age group within the demographics of each municipality. Giving birth is also an extremely personal and family privacy issue. For this reason, there is no established theory as to how municipalities should structure their measures to improve pregnancy, childbirth, childcare, and child rearing, and how to reach out to women and their spouses in the target age groups. It is also difficult to determine what is working and what is not.
Fortunately, we found no differences between the two groups in their subjective attitudes toward the value of children in this study. This suggests that effective measures of TFR recovery may have a common effect in both the lowest-TFR and the highest-TFR groups, and perhaps even in the middle-TFR group, which was not included in the present study. Moving forward, it will be necessary to a) clarify the factors that maintain and increase TFR on the islands; b) clarify how to improve the full-time housewives’ environment at each stage of pregnancy, childbirth, childcare, and child rearing; and c) examine TFR policies from OECD countries, especially the social treatment of children born out of marriage and take social measures in line with such policies.
3. Important issues to be further examined
The st-bLRA (Table 3) confirmed that the raw data not adjusted by the standard population or Bayesian statistics clearly showed high TFR in the SMAs containing many islands. In addition, the high TFR factor for high school graduates and the low TFR factor for stay-at-home mothers were independent from the factor as residence on the island. In addition, as mentioned in the results section, 14 of the 26 SMAs selected as the highest TFR (54%) were located in the Kyushu Region. This result showed that TFRs were high in the Kyushu Region excluding islands belonging to Nagasaki or Kagoshima Prefecture. These results indicated the need to examine both islands-related factors and non-islands factors contributing to high TFRs in the Kyushu Region.
Conclusion
This study was probably the first to investigate births in units of SMAs in order to take advantage of raw data from all municipalities in Japan, and furthermore, to confirm the pattern of increase and decrease in TFR after adjusting for the effects of mergers that have occurred in many municipalities over a period of 20 years. The highest-TFR and lowest-TFR groups were then selected, and the environment and attitudes of target women residing in these groups regarding childbirth, childcare, etc., were surveyed by age group using synergy analyses of quantitative and qualitative data. As far as we can ascertain, it is the first study of its kind.
The results showed that there were no differences in age, occupation, income, or values regarding children in the two groups. However, respondents who lived on an island or whose highest level of education was high school graduation were more likely to be in the highest-TFR group, and those who lived in a city or were unmarried or stay-at-home mothers were more likely to be in the lowest-TFR group. In particular, full-time housewives who give birth and raise children are not provided with financial support other than a lump-sum childbirth allowance, and they may or may not have human support networks. This is considered to be a key point when considering how to stabilize and increase TFR.
The synergy analysis between the CONWs and the quantitative data showed that the highest-TFR group was highly and significantly more likely to expect support for childbirth and child rearing from the surrounding community, as well as support in the near future. In addition, the results indicate that SMAs have high expectations for financial assistance provided by local governments for pregnancy, childbirth, childcare, and each child-rearing stage, as well as for daycare center placement, childcare support, and various types of consultation services. Fortunately, there were no differences between the two groups in values toward children, suggesting the need to establish a detailed and multi-layered service system so that women and couples in the target age group can receive enough financial and human support during pregnancy, childbirth, childcare, and each stage of child rearing in the near future.
In addition, this study strongly showed that TFRs were high in the Kyushu Region excluding islands belonging to Nagasaki or Kagoshima Prefecture. These results indicate the need to examine both islands-related factors and non-islands factors contributing to high TFRs in the Kyushu Region.
Acknowledgments
We would like to thank the teachers working in the Department of Health Informatics at Niigata University of Health and Welfare for their valuable guidance.
Conflicts of interest
This research received no grant from any funding agency in the public, commercial, or not-for-profit sectors. The authors declare that they have no relevant conflicts of interest.
References
- 1. Ministry of Health, Labour and Welfare. 2015 Edition. Annual Health, Labour and Welfare Report -Consideration of a depopulating society-. Available from: https://www.mhlw.go.jp/english/wp/wp-hw9/dl/summary.pdf (accessed March 22, 2023)
- 2. Inosita S, Minami T, Sano K. A Social Psychological Study of the “Cultural Structure” of Japan: Through an Analysis of the Sharp Decline in Births in the Year of the Fire Horse (Hinoe-Uma), 1966. Keio studies on organizational behavior and human performance. 1977; 3: 41-70. (in Japanese)
- 3. Ministry of Health, Labour and Welfare. Japan National Trends (1950-2019) of TFR: Total Fertility Rate. Available from: https://view.officeapps.live.com/op/view.aspx?src=https%3A%2F%2Fwww.mhlw.go.jp%2Fwp%2Fhakusyo%2Fkousei%2F19%2Fbackdata%2Fxls%2F01-01-01-07.xls&wdOrigin=BROWSELINK (accessed April 10, 2023) (in Japanese)
- 4. Hashimoto N. Nursery-Staff Training -Course in the Age of Supported Child-Care. Journal of Yasuda Women’s University-. 2009; 37: 187-196. (in Japanese)
- 5. Atoh M. Policy responses to lowest-low fertility in Japan: a twenty-year trajectory and evaluation. Human Science Research. 2010; 23(2): 187-207. (in Japanese)
- 6. OECD Family Database. Chart SF2.1.A. Total fertility rate, 1970, 1995 and 2021. Available from: https://www.oecd.org/els/family/SF_2_1_Fertility_rates.pdf (accessed August 2, 2023)
- 7. Cabinet Office. ESRI Discussion Paper Series No.382. Analysis of Social Changes in Population and Fertility Rates. Available from: https://www8.cao.go.jp/shoushi/shoushika/whitepaper/measures/w-2004/html (accessed June 5, 2023) (in Japanese)
- 8. Atoh M. Thinking about Very Low Fertility in Japan, Based upon its Demographic Analyses. Journal of Health Care and Society. 2017; 27(1): 5-20. (in Japanese)
- 9. Yoshida H, Ishii N. Recalculation of the 2013 Total Fertility Rate by Prefecture. 2013 -Reexamination of the results of the 2013 Vital Statistics Monthly Report (Summary) - TERG Discussion Papers. 2014; 323: 1-11. (in Japanese)
- 10. Masuda J. Why is the Total Fertility Rate of Kyushu Region High? An Essay on Birth and Parenting in Kyushu Region, Japan. Bulletin of Nakamura Gakuen Developmental Support Center. 2021; 13: 18-27. (in Japanese)
- 11. Ito W. The Environment of the Bringing up Children in Tarama Village in Okinawa Prefecture - the Life and Culture in Tarama Island with the Highest Birthrate in Japan. The Jumonji Journal of Human Life Sciences. 2005; 3: 63-88. (in Japanese)
- 12. Kikuchi Y. Research on the future estimation of local population. The journal of Morioka University. 1988; 7: 109-122. (in Japanese)
- 13. Yumoto Y, Soshiroda A, Tsutsumi T. A Basic Analysis of the Types and the Factor for increasing in Population in the Remote Island. Magazine of The City Planning Institute of Japan. 2002; 37: 793-798. (in Japanese)
- 14. Ministry of Health, Labour and Welfare. Methods of Bayesian estimation in the 2010 Municipal Life Tables. Available from: https://www.mhlw.go.jp/toukei/saikin/hw/life/ckts10/dl/03.pdf (accessed March 20, 2023) (in Japanese)
- 15. Yamauchi M. The new indirect estimation method of TFR using standardized CWR. Journal of population studies. 2009; 45: 35-44. (in Japanese)
- 16. Koike S. Comparison of Actual and Bayesian Estimates of Total Fertility Rate in Vital Statistics by Municipality. FY1990 Ministry of Health, Labour and Welfare, Policy Science Research Project. Available from: https://mhlw-grants.niph.go.jp/system/files/report_pdf/202001018A-sonota1.pdf (accessed August 5, 2023) (in Japanese)
- 17. Shimada A. A Comprehensive Review of the “Heisei Great Mergers”. Local Autonomy Fukuoka. 2018; 64: 3-37. (in Japanese)
- 18. Nishihara J. Latest Conditions and Prospects of Municipal Administration and Local Cities in the Provincial Zones after the Heisei Pro-merger Action of Municipalities Conducted by the Japanese Government. Geographical Sciences. 2016; 71(3): 89-106. (in Japanese)
- 19. Takiguchi T. A review of oral epidemiological statistics - Part III: Interpretation of various goodness of fit indicators for the Multiple Regression Model and Multiple Logistic Regression Model. -When using the statistical software SPSS and STATA-. Health Science and Health Care. 2005; 5(1): 35-49. (in Japanese)
- 20. SPSS manual: SW388R7 Data Analysis & Computers II Slide 61 Multinominal Logistic Regression. Complete Problems. Multicollinearity in the multinomial logistic regression solution is detected by examining the standard errors for the coefficients. Available from: https://slideplayer.com/slide/7739003/ (accessed April 15, 2023)
- 21. Higuchi K. Quantitative Text Analysis for Social Researchers: A contribution to Content Analysis. 1st ed. Kyoto: Nakanishiya publishing; 2015. p.141-161. (in Japanese)
- 22. Koiso K, Honma M, Seki C, et al. Analyses on factors influencing changes in stress levels of evacuees from Fukushima Prefecture during the three years following the Great East Japan Earthquake. Journal of Japan Society of Disaster Nursing. 2016; 17(3): 14-29. (in Japanese)
- 23. Kobayashi F, Kinoshita N, Watarai Y et al. Current state and issues in the knowledge of the non-elderly generation regarding long-term nursing care 20 years from the enactment of long-term care insurance. Niigata Journal of Health and Welfare. 2023; 22(3): 78-90. (in Japanese)
- 24. Watarai Y, Hasebe Y, Kobayashi F, et al. Classification of Discrimination and Encouragement Among Health Professionals During the COVID-19 Pandemic. Niigata Journal of Health and Welfare. 2023; 22(3): 91-101. ( in Japanese)
- 25. Jichi Medical University. Regional Medical White Paper: Ruggedness and Challenges of Medical Care to Those Living in Different Areas of Japan. Available from: http://www.jichi.ac.jp/usr/tiik/whitepaper/images/hakusyo1.pdf (accessed April 10, 2023) (in Japanese)
- 26. Ministry of Land, Infrastructure, Transport and Tourism. Concept of Living Area 3. What is a living area? Available from: https://www.mlit.go.jp/sogoseisaku/region/21seikatuken/04/03.pdf (accessed April 12, 2023) (in Japanese)
- 27. Saeki N, Hirako T, Nakata T. Application of Bayesian Statistics to Demographic Municipal Statistics (2) Application to Total Fertility Rate. Journal of Health and Welfare Statistics. 1999; 46(11): 3-10. (in Japanese)
- 28. Takiguchi T. (Clinical) Epidemiology for EBM - Statistical Basis (2) Chapter 2: Basic Epidemiology: Finding and Preventing the Laws of Epidemic Disease. Journal of the Japanese Society for Disability and Oral Health. 2002; 23(2): 89-98. (in Japanese)
- 29. Muramatsu N, Kumano K, Nishikawa T. Construction of analysis base for total fertility rate (TFR) time course: An attempt to search association for TFR by municipality. Musashino University Academic Institutional Repositry. 2020; 5: 72-89. (in Japanese)
- 30. Sasai T. The fertility trends and their determinants of differentials for Japan’s municipalities. J. of Population Problems. 2005; 61(3): 39-49. (in Japanese)
- 31. Ohta H. Issues Surrounding Child Rearing in Urban Areas and Child Rearing Support Activities Conducted by Universities. Journal of the Kyorin Medical Society. 2014; 45(3): 101-104. (in Japanese)
- 32. Song JE, Ahn JA, Lee SK, et al. Factors related to low birth rate among married women in Korea. PLoS One. 2018; 13(3). DOI: https://doi.org/10.1371/journal.pone.0194597
- 33. Kulu H. Why Do Fertility Levels Vary between Urban and Rural Areas?. Regional Studies. 2013; 47(6): 895-912. DOI: 10.1080/00343404.2011.581276.
- 34. Kulu H, Steele F. Interrelationships Between Childbearing and Housing Transitions in the Family Life Course. Demography. 2013; 50(5) :1687-1714. DOI: https://doi.org/10.1007/s13524-013-0216-2.
- 35. Pan L, Xu J. Housing price and fertility rate. China Economic J. 2012; 5(2-3): 97-111.
- 36. OECD Family Database. Share of births outside of marriage. Available from: https://www.oecd.org/els/family/SF_2_4_Share_births_outside_marriage.pd31. (accessed May 25, 2023)
- 37. Yamauchi M, Nishioka H, Esaki Y, et al. Contextual Effects and Fertility Differences between Okinawa Prefecture and Mainland Japan. Geographical Review of Japan Series A. 2020; 93(2): 85-106. (in Japanese)
- 38. Eggert J, Sundquist K. Socioeconomic factors, country of birth, and years in Sweden are associated with first birth fertility trends during the 1990s: A national cohort study. Scandinavian Journal of Public Health. 2006; 34(5): 504-514. DOI:10.1080/14034940600585804.
- 39. Eroğlu K, Koruk F, Koruk I, et al.Women’s reproductive behaviour and perspectives on fertility, and their modifying factors, in a Turkish province with a high fertility rate. Eur J Contracept Reprod Health Care. 2021; 26(2): 139-147.
- 40. Oura P. Sociodemographic Indicators of Birth Rate in a Low Fertility Country-A Nationwide Study of 310 Finnish Municipalities Covering > 5,000,000 Inhabitants. Frontiers in Public Health. 2021; 9: 1-7. Doi:10.3389/fpubh.2021.643561
- 41. IBM Japan Health Insurance Association. Available from: https://www.ibmjapankenpo.jp/eng/member/benefit/baby_a.html (accessed July 25, 2023)
- 42. Luppi F, Arpino B Rosina A. The impact of COVID-19 on fertility plans in Italy, Germany, France, Spain, and the United Kingdom. Demographic Research. 2020; 43(47): 1399-1412. DOI:10.4054/DemRes.2020.43.47.
- 43. Aassve A, Cavalli N, Mencarini L, et al. The COVID-19 pandemic and human fertility. Science. 2020; 369(6502): 370-371. DOI:10.1126/science.abc9520.
- 44. Kaji D. Importance of Women’s Social Advancement in a Society with Declining Birthrate - Improvement of Society with Declining Birthrate - Toward a Work-Life Balanced Society, Expectations for Corporate Welfare and Childcare Services. The Journal of Economic Policy Studies, Kagawa University. 2009; 5: 147-169. (in Japanese)