Abstract
Signalling equipment is installed in positions where it is exposed to vibrations from passing trains transmitted via rails, sleepers, and roadbeds. The design of signalling equipment must therefore take this into account to prevent vibration-related damage. In recent years, the installation environment of signalling equipment has evolved due to faster train running speeds and changes in tracks and structures. However, the details of vibration propagation to signalling equipment have not been investigated so far. In addition to current issues, this paper reports on guidelines for vibration acceleration amplitude in vibration endurance testing.
1. Introduction
Signalling equipment on railways is installed in positions where it is exposed to vibrations from passing trains transmitted via rails, sleepers, and roadbeds. It is therefore necessary to design signalling equipment taking this into account to avoid damage due to vibration. The Japanese Industrial Standard JIS E 3014 (hereinafter referred to as JIS E 3014) for vibration testing of signalling equipment specifies a number of tests to be performed for each installation location of the equipment, as well as the test conditions such as vibration direction, test time, vibration frequency and amplitude. However, since its establishment in 1976, there have been no major revisions to these tests and test conditions of this standard [1, 2, 3].
On the other hand, the installation environment of signalling equipment has changed in recent years due to faster train running speeds and changes in tracks and structures. However, the details of vibration propagation to signalling equipment have not been investigated so far.
In order to indicate vibration endurance test conditions based on the current usage environment of signalling equipment, we investigated the vibration acceleration to which signalling equipment is exposed to better understand the actual situation. This report clarifies the vibration acceleration exerted on signalling equipment in current general usage environment, presents the data required for considering the future revision of JIS E 3014, and shows the vibration acceleration amplitude for a sinusoidal vibration test in a vibration endurance test. To compare the domestic and overseas usage environments, we also compared the frequency characteristics of the domestic signalling equipment usage environment obtained this time with the international standard International Electrotechnical Commission IEC 62498-3 (hereinafter referred to as IEC), which specifies the frequency characteristics of vibration acceleration along European railway lines.
2. Vibration endurance test standards for signalling equipment and present issues
2.1 History of establishment and revision of vibration endurance test standards for signalling equipment
JIS E 3014 was established in December 1976 after deliberation by a drafting committee established in 1972 by the Signal Association of Japan [1]. Subsequently, in 1992, the system was changed to the SI unit system and the format of the standard sheet was revised [2]. In 1999, in response to an issue where signalling equipment made of resin such as ATP Balise would heat up due to friction during vibration endurance tests, the standard was revised to allow for measures such as interrupting the test if a rise in temperature occurred during the test [3]. The standard has been revised twice since its establishment, but the test methods and test conditions remain the same as when it was first established.
2.2 Previous vibration environment surveys and their issues
Table 1 shows the conditions under which vibration acceleration measurements were carried out when JIS E 3014 was established. These measurements were mainly carried out on the earth structure sections of the Shinkansen and Meter-gauged railway lines, and measurements on the viaduct sections were carried out at one location each on the Shinkansen and Meter-gauged railway lines. The measured maximum speed of the Shinkansen was 188 km/h on the earth structure section and 205 km/h on the viaduct section, the maximum speed of the Meter-gauged railway line was 112 km/h on the earth structure section and 47.5 km/h on the viaduct section. Since the standard was established, the environment in which signalling equipment is used is expected to have changed due to factors such as increased train speeds and the introduction of new track and structure construction methods. However, there is an issue in that the current JIS E 3014 test conditions do not reflect changes in the vibrations transmitted to the equipment and their effects. To address this issue, we considered it was necessary to conduct a survey to understand the actual conditions of the current operating environments of signalling equipment, and therefore carried out measurements of vibration acceleration in various operating environments.
Table 1 Measurement conditions in past vibration environment surveys
| Rail | Structure type | Maximum speed (km/h) |
| Earth structure | Viaduct |
| Shinkansen | 50T | ○ | ― | 188 |
| 50T | ― | ○ | 205 |
| Meter-gauged railway line | 50N | ○ | ― | 112 |
| 50N | ○ | ― | 75 |
| 50N | ○ | ― | 70 |
| 50N | ○ | ― | 65 |
| 40N | ○ | ― | 66 |
| 40N | ○ | ― | 43 |
| 40N | ○ | ― | 20 |
| 37 | ○ | ― | 65 |
| 37 | ○ | ― | 54 |
| 37 | ○ | ― | 47 |
| 37 | ○ | ― | 20 |
| 50N | ― | ○ | 47.5 |
3. On-site vibration survey of signalling equipment
3.1 Selection of locations for vibration acceleration survey
On current Shinkansen and Meter-gauged railway lines, in addition to sections of ballasted track laid on earth structures and viaducts where vibration environment surveys have been conducted in the past, there are also sections that use track structures such as slab track and ballastless track. In addition, the maximum operating speed has increased to 320 km/h on the Shinkansen and to 130 to 160 km/h on some Meter-gauged railway lines. The purpose of the survey was to grasp the current state of the vibration environment, and vibration acceleration was measured at locations where signal equipment was installed [4, 5]. The survey locations were selected as areas with severe operating conditions, such as sections of the Shinkansen where trains run at high-speed and sections of Meter-gauged railway lines where freight trains and limited express trains run, and surveys were conducted at locations with different types of structures in these sections.
3.2 Measurement items and methods for on-site vibration survey
At each survey location, measurements were required at the bottom of the rail and on the sleepers, and if an instrument box was installed in the vicinity, measurements were taken at three points, including the instrument box. For the measurements, a piezoelectric acceleration sensor (RION Co., Ltd. PV-93) and a charge amplifier (RION Co., Ltd. UV-15, UV-16) were used, and an axle detector (proximity sensor: Copto Co., Ltd. R004-MKⅡ) was installed as a trigger to start the measurements. The acceleration sensors were attached to the bottom of the rail using a mounting jig that matched the taper of the bottom of the rail and fixed with adhesive, while for the sleepers and instrument boxes, a rectangular mounting jig was used and the sensors were fixed to the target objects with adhesive and an insulating acrylic plate between them. Hereinafter, the measurement directions of the three-axis acceleration are defined as the longitudinal direction of the rail as front-to-back, the vertical direction as up-down, and the sleeper direction as left-to-right. The sampling frequency in this measurement was 10 kHz.
3.3 Measurement data processing
The measured vibration acceleration results are recorded as a waveform of the vibration acceleration over time. This waveform was processed as follows.
① Removal of high frequency components using a low-pass filter
② Calculation of peak-to-peak value
Mechanical damage to signalling equipment caused by vibrations due to running trains is thought to be caused by fatigue failure due to resonance of component parts. It is known that the resonant frequency is 1 kHz or less due to the weight and elastic properties of the components. Therefore, the upper limit of resonant frequency exploration in JIS E 3014 is 1 kHz. In addition, in the data processing that has been carried out after vibration acceleration measurement, the signals above 1 kHz are processed to be attenuated. Similarly, in this survey, high-frequency components were removed from the vibration acceleration obtained in each measurement using a low-pass filter (Chebyshev type II, 10th order, stopband attenuation 80 dB) with a cutoff frequency of 1 kHz constructed on a numerical calculation software. Furthermore, the index used to indicate the magnitude of vibration acceleration is not the maximum or minimum values, but rather the difference between the peaks and valleys of a local wave in the acceleration waveform that changes over time (peak-to-peak value, hereafter referred to as the p-p value, Fig. 1). In these measurements, the maximum p-p value for each train (hereafter referred to as the maximum p-p value) was calculated for the waveforms after low-pass filtering, and the data was then organized.

Fig. 1 Peak-to-peak value (p-p value)
4. Overall trends of on-site measurement results
4.1 Measurement location
Vibration acceleration was measured when trains passed at a total of 44 locations on both Shinkansen and Meter-gauged railway lines. The breakdown by structure type, track type, etc. is shown in Table 2.
Table 2 Number of vibration acceleration measurement points
| Structure type | Track type | Track geometry | Measurement points |
| Shinkansen | Earth structure | Ballasted | Turnout | 1 |
| Viaduct | Ballasted | Turnout | 1 |
| Ballastless | Turnout | 1 |
| Meter-gauged railway line | Earth structure | Ballasted | Straight | 8 |
| Curve | 6 |
| Turnout | 6 |
| Viaduct | Ballasted | Straight | 3 |
| Curve | 1 |
| Turnout | 4 |
| Ballastless | Straight | 2 |
| Turnout | 4 |
| Slab | Straight | 1 |
| Turnout | 4 |
| Bridge | Ballastless | Straight | 2 |
As an example of the results of measuring the acceleration of the rail, sleepers, and instrument boxes when a train passes, Fig. 2 shows the waveform of acceleration in the up-down direction of the rail when a train passes. The acceleration fluctuated greatly when a train passed, and the p-p value generally showed a large value at the moment the wheelsets passed. Following the approach used when formulating the test conditions for the excitation acceleration amplitude for vibration endurance tests in JIS E 3014, it was decided to determine the test conditions for the excitation acceleration amplitude suitable for the current usage environment, based on the p-p values when trains pass at each measurement location.

Fig. 2 Vibration acceleration when a train passes (Up-down direction of rail)
When some of the wheelsets passed over the installations, significant vibration acceleration was observed in the rails, exceeding the JIS E 3014 test conditions (Type 4C) of 981 m/s2. Such significant acceleration fluctuations observed on specific wheelsets are believed to be the result of wheel shape irregularities such as wheel flats. In this case, when other wheelsets pass by, the same level of vibration acceleration is measured for each wheelset, but when the rail is hit by the wheel flat, the maximum p-p value becomes significantly higher. In this evaluation, which targets vibration endurance testing, it is necessary to use the vibration acceleration value of the steady vibration when a train passes. If the maximum p-p value is used, it would mean that when a train passes, the rail is considered to be constantly subjected to a vibration acceleration equivalent to the impact caused by a wheel flat. This means that an excessive vibration acceleration is adopted compared to the actual usage of the signal equipment. Therefore, it is desirable to exclude this sporadic impact component from the evaluation.
4.2.2 Maximum p-p value and wheelset-number average p-p value
To reduce the impact components described above during evaluation, the p-p values were averaged based on the number of wheelsets passing when one trainset passed. The vibration acceleration when a wheelset passes over the installations is measured on the whole as a large p-p value for each passing wheelset. The magnitude of this p-p value varies for each wheelset of a train, as shown in Fig. 3 (a). This is thought to be due to differences in axle loads depending on the vehicle type and number of passengers, the loading conditions of containers and cargo, balance of axle loads, and irregularities in the shape of wheels such as wheel flats. Assuming that there are no large fluctuations such as impacts caused by wheel flats and that one peak is obtained when one wheelset passes, for a train with N axles, the p-p value for each wheelset can be obtained by extracting the top N p-p values from the measurement data for that single train component. Therefore, the average value obtained by dividing the sum of the top N p-p values by N (hereinafter referred to as the wheelset-number average p-p value) was calculated as an index equivalent to the average p-p value for each wheelset [6].

Fig. 3 Example of the p-p value extracted when calculating the wheelset-number average p-p value ○ : The p-p value used in the calculation
The maximum p-p value is affected by wheel flats and other factors, and has a large variance. On the other hand, the wheelset-number average p-p value is thought to be able to eliminate to some extent the variation associated with the condition of individual wheelsets (red dot-dash line shown in Fig. 3 (a)). However, Although the variance can be reduced, if there is a large discrepancy between the two values, the wheelset-number averaged p-p value cannot be used to evaluate vibration durability. If there is a large discrepancy between the two values, the wheelset-number average p-p value cannot be used as an evaluation index for vibration durability and the evaluation must be made using the maximum p-p value.
Therefore, the maximum p-p value and the wheelset-number average p-p value were calculated, and the two results were compared. When calculating the wheelset-number average p-p value, the number of data points for the number of wheelsets is extracted from all the p-p values when a train set passes, starting with the largest. Therefore, if several high p-p values are observed on the same wheelset due to a wheel flat or other problem, the extracted p-p value may not necessarily match the p-p value when the wheelset passed (Fig. 3 (b)). However, the calculated wheelset-number average p-p value is greater than the average of the maximum p-p values for all wheelsets (in one train set) when only the sections through which each wheelset has passed are extracted, and therefore is an assessment on the safety side. Moreover, because data processing can be easily automated, in this comparison the wheelset-number average p-p value was calculated using the method described above.
The average value μ and standard deviation σ of the maximum p-p value and the wheelset-number average p-p value of the measurement results were calculated for each speed stage. The calculations showed that the up-down vibration acceleration was the greatest of the three axis directions at each measurement point, so as an example, Fig. 4 shows the maximum p-p value in the up-down direction of the rail and the wheelset-number average p-p value. Each point in the figure is the average value μ for each speed stage, and the tip of the error bar is the value of μ + σ. The difference between the average of the wheelset-number average p-p value and the average of the maximum p-p value for each speed stage is generally less than 200 m/s2 in the up-down direction of the rail. In addition, the standard deviation σ of the wheelset-number average p-p value is smaller than that of the maximum p-p value.

Fig. 4 Average and standard deviation of maximum p-p value and wheelset-number average p-p value by speed stage
From these results, it was decided that the wheelset-number average p-p value could reduce variance without deviating significantly from the maximum p-p value, and therefore the wheelset-number average p-p value was used in this analysis, which determines the vibration endurance test conditions for steady-state vibration caused by passing trains.
4.3 Vibration acceleration distribution for each speed stage of passing trains
This paper describes the distribution of the wheelset-number average p-p values when train speeds are divided into speed steps of 10 km/h, with 5 km/h as the base speed. As an example, Fig. 5 shows the cumulative frequency distribution of wheelset-number average p-p values in the up-down direction of the rail at train speeds of 105 to 115 km/h. Although the distribution of the wheelset-number average p-p value for each speed step differs from a normal distribution, when the mean value μ and standard deviation σ were calculated, the cumulative relative frequency, which indicates the proportion of data falling within the range of μ + σ (wheelset-number average p-p value 0 m/s2 to 800 m/s2 in the example in Fig. 5) to the total measurement data, was 0.9. For this reason, we decided to use μ + σ as the value that contains 90% of the measurement data for each speed stage.

Fig. 5 Frequency of occurrence of up-down vibration acceleration of rail (Speed stage:105~115 km/h)
5. Analysis of measurement results
The average value μ and standard deviation σ were calculated for each speed stage for the wheelset-number average p-p value of acceleration in each direction at each measurement point obtained from the measurement results. As an example, the results of the rail vibration acceleration are shown in Fig. 6. Each point in the figure indicates the average value μ for each speed stage, and the tip of the error bar indicates the value of μ + σ. In addition, since the vibration acceleration in the up-down direction was the largest among the three axial directions at each measurement point, in the following, when only one axial direction is shown as an example, the up-down direction will be described.

Fig. 6 Vibration acceleration measurement results
The magnitude of μ+σ of the wheelset-number average p-p value of the rail was below the current JIS standard of 981 m/s2 (Type 4 C) in all directions, up-down, left-to-right, and front-to-back, except for some Meter-gauged railway lines (up-down direction at speed stages around 130 km/h). The up-down acceleration of the rail at speeds of around 130 km/h on Meter-gauged railway lines, which exceeded 981 m/s2, was also significantly increased due to the maintenance conditions at certain measurement points. In the left-to-right and front-to-back directions of the rail, the value of μ + σ is about 500 m/s2, even at the speed stage of the Shinkansen (around 300 km/h). In addition, the results showed that the wheelset-number average p-p value generally increased as the train speed increased.
6. Ideal vibration endurance test conditions for signalling equipment
6.1 Ideal vibration acceleration amplitude based on on-site measurement results
In this section, we compare the measurement results with the vibration endurance test conditions of JIS E 3014 and discuss the ideal vibration acceleration amplitude when taking into account the current usage environment. JIS E 3014 specifies that the amplitude of sinusoidal vibration should be the same in all three axial directions for the test specimen, with the vibration being 981 m/s2 for equipment installed on rails (Type 4C), 147 m/s2 for equipment installed on sleepers (Type 3C), and 9.81 m/s2 for equipment installed on instrument boxes (Type 2C). In addition, the excitation frequency must be the resonant frequency of the specimen (100 Hz if there is no resonant point within 1 kHz).
As a guideline for the vibration acceleration to which rails, sleepers, and instrument boxes are exposed under current general operating conditions, the maximum values of μ + σ were compared with the excitation acceleration amplitude specified in JIS E 3014. As a result, as shown in Fig. 6, in the case of rails, the maximum value of μ + σ for the JIS-specified vibration amplitude of 981 m/s2 was approximately 550 m/s2 in the front-to-back direction and 450 m/s2 in the left-to-right direction. Furthermore, considering that the vibration acceleration experienced in an actual installed state contains a variety of frequency components and is not excited only at the resonant frequency, in the case of sinusoidal vibration tests simulating the actual usage environment, results were obtained that support the possibility of mitigating the excitation acceleration amplitude during vibration endurance tests in the front-to-back and left-to-right directions of the rail. Similar studies were also carried out in the up-down direction of rails and in the three axial directions of sleepers and instrument boxes. As a result, it was found that the maximum value of μ + σ obtained from the measurement data was roughly the same as the excitation acceleration amplitude specified by JIS. In addition, it was confirmed that the acceleration was higher at some measurement locations due to the maintenance state of the equipment. Therefore, it is considered that the current excitation amplitude is appropriate for these items [5].
6.2 Comparison of frequency characteristics with international standards
In recent years, in fields such as railway vehicles, random wave excitation has been added as a new test condition in addition to the conventional sine wave excitation vibration durability tests in order to reproduce excitation conditions that are closer to the actual usage environment, making it possible to select the excitation method [7]. In addition, the IEC describes the characteristics of the usage environment along railway lines using power spectral density (PSD), which assumes random waves. Therefore, in order to compare with the international standard, we performed FFT (Fast Fourier Transformation) on the acquired data on time changes in vibration acceleration and calculated the PSD versus frequency.
Among the measurement items, the PSD related to the vibration acceleration of rails and sleepers is specified by the IEC as the frequency characteristics of vibration along railway lines in Europe. The measurement results were compiled using the 1/3 octave band in the same way as the IEC.
Figure 7 shows the result of superimposing the calculated PSD (hereafter referred to as on-site measured PSD). The purple line in the figure is the envelope of the maximum value of the PSD measured at each frequency, and shows the maximum value of the PSD at each frequency in all measurement results (maximum value at the site). This PSD is the PSD that encompasses all measurement results. Also, the green line is the PSD specified by the IEC. Comparing the results of these measurements with the IEC standards, which were established based on the vibration environment along European railways, no prominent PSD peaks were observed in any particular frequency range for rails and sleepers, and up to 1 kHz, the PSD increases as the frequency increases, showing that the distribution between Japan and Europe is similar. In addition, in the range above 1 kHz, the PSD in domestic on-site environments showed high results, but the reason for this is currently unknown.
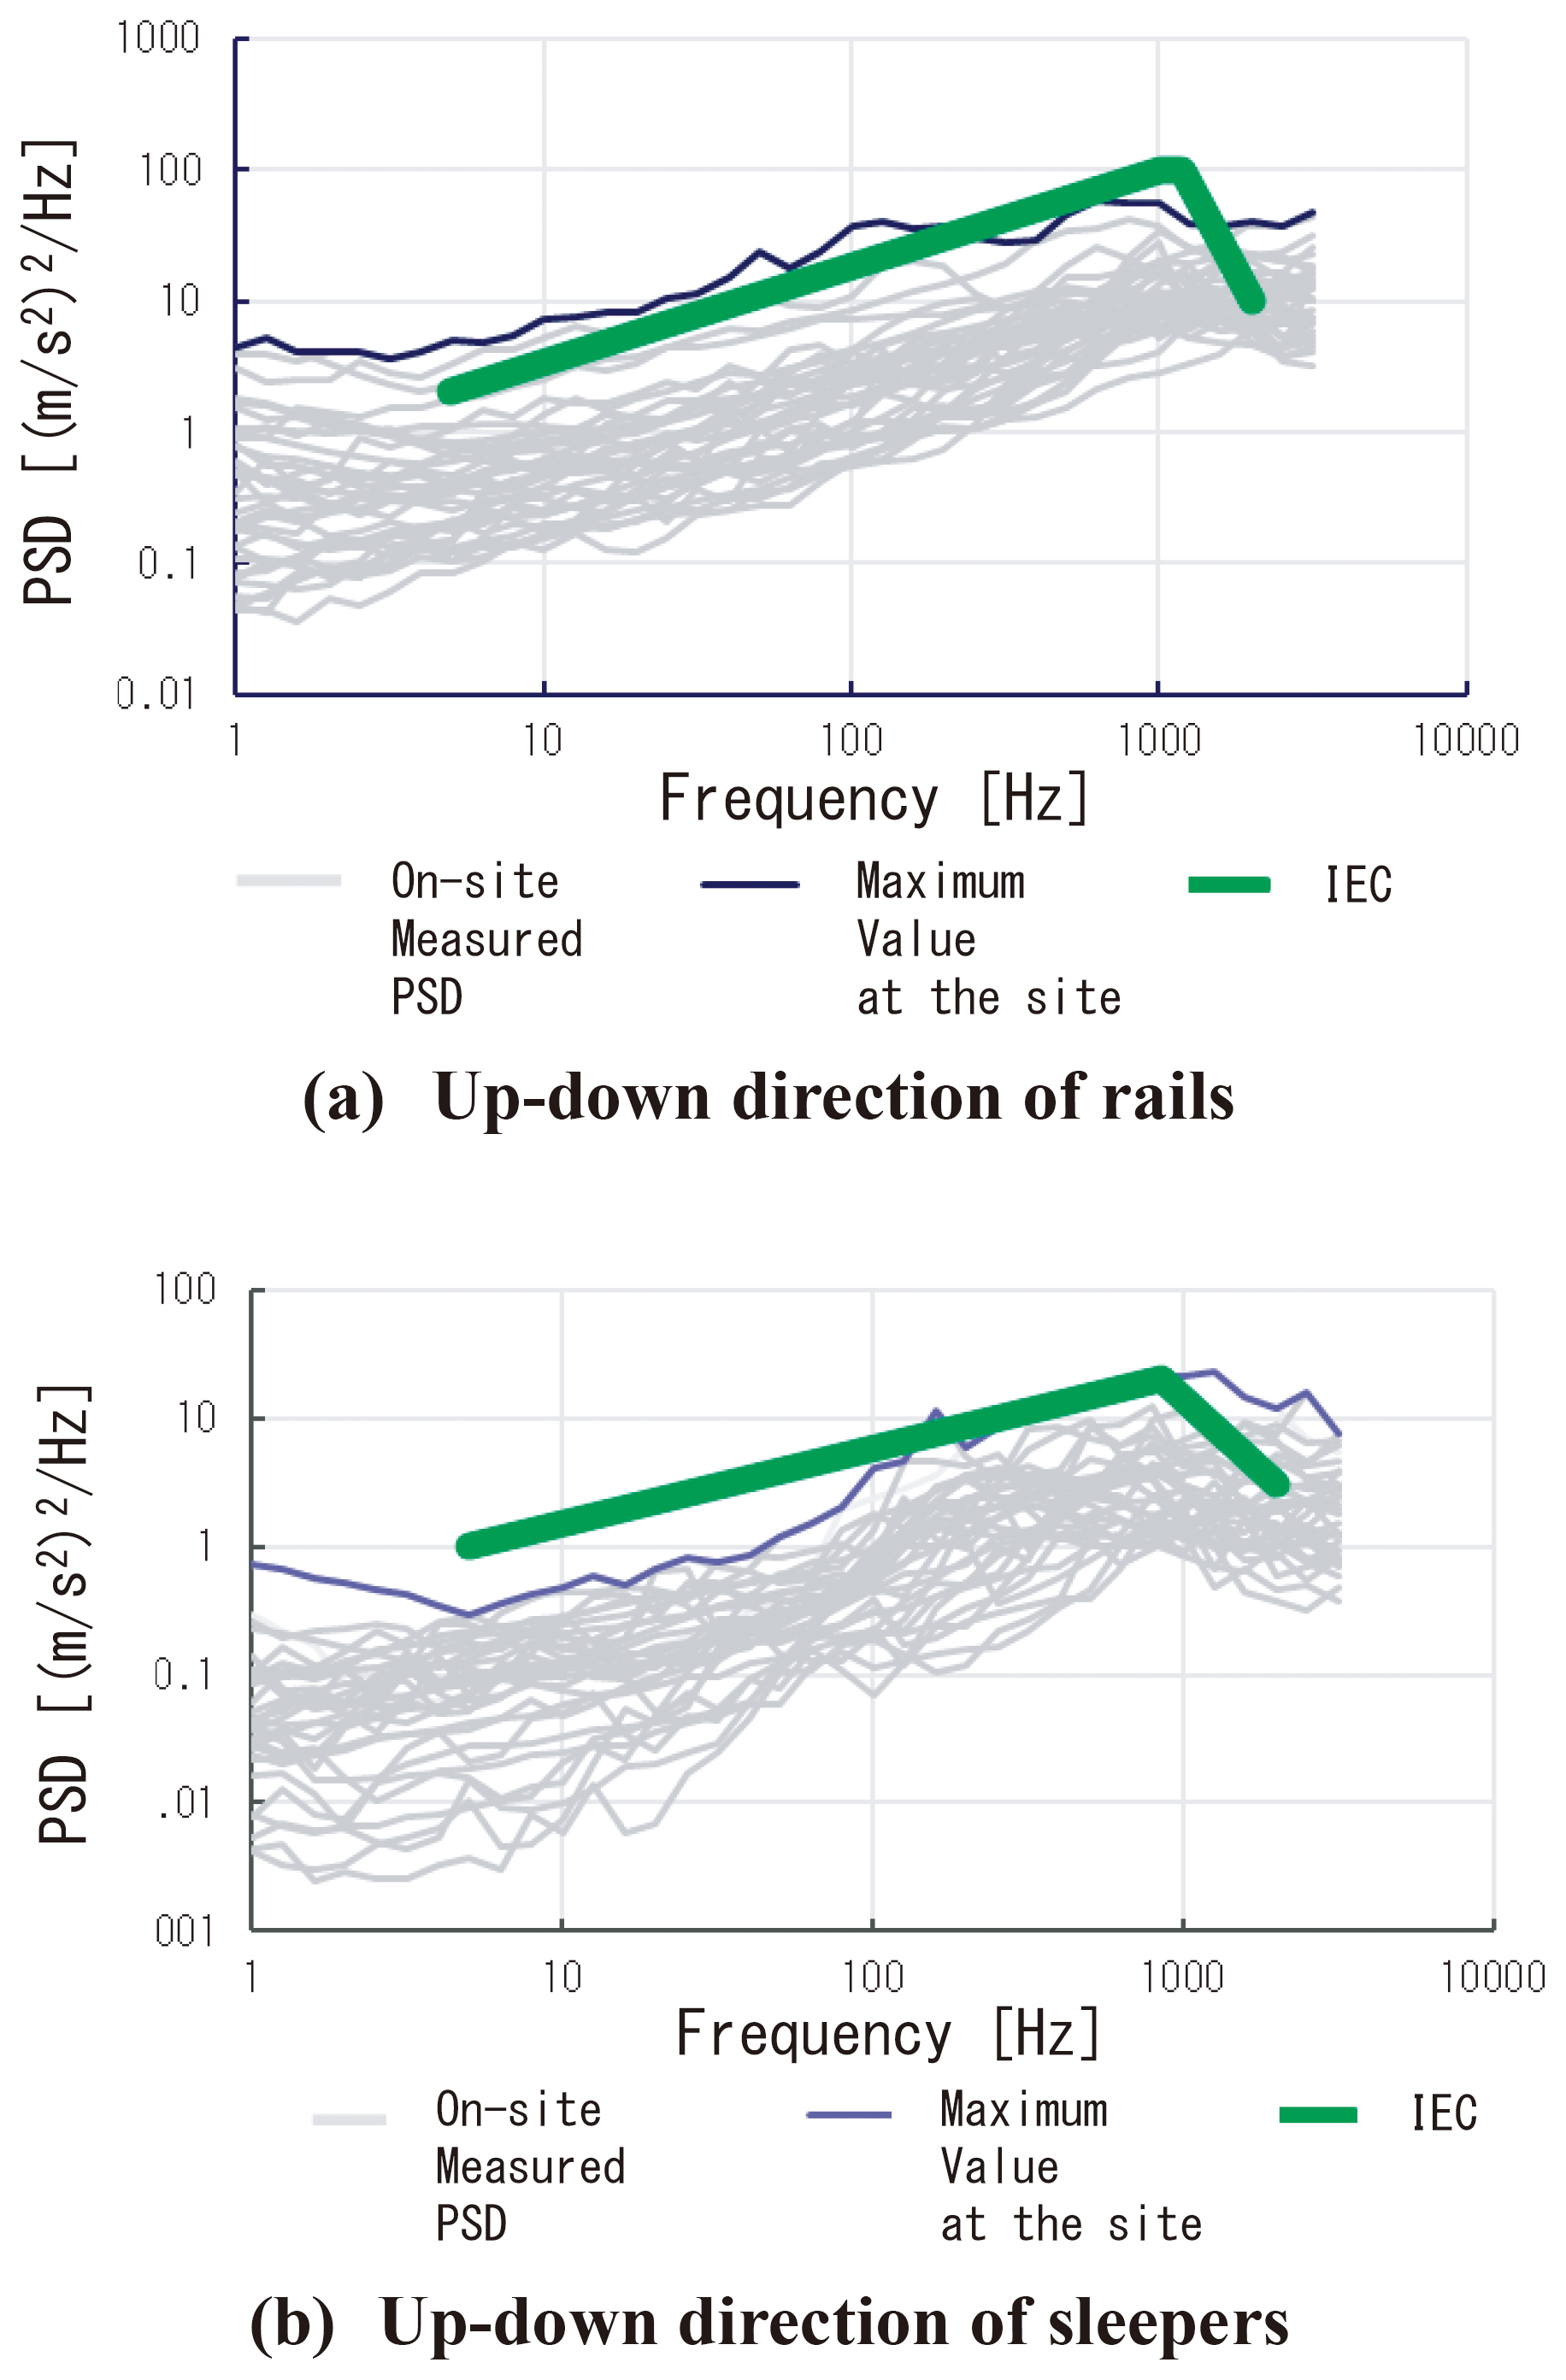
Fig. 7 PSD of vibration acceleration
7. Summary
In order to understand the trends in vibration acceleration to which signalling equipment is exposed when trains pass, this report measured the vibration acceleration at a total of 44 locations, on Shinkansen and Meter-gauged railway lines, for steady-state vibration from passing trains, and clarified the vibration acceleration to which signalling equipment is exposed under current general operating conditions. From the results, we presented the data necessary for the consideration of future revisions of the JIS standard, and also showed the ideal vibration acceleration amplitude for sinusoidal vibration tests in vibration endurance tests. Regarding the effects of impacts due to occasional wheel flats, which were not included in this study, we believe that it will be necessary to discuss this when revising the test methods defined in JIS E 3015 (Railway signalling safety components - Impact test methods) [8], and we plan to continue our study on this issue.
In addition, from the vibration acceleration data acquired, a domestic PSD was derived that can be compared with the IEC on the same scale. Comparison of these results with the PSD indicated by the IEC showed that no prominent PSD peaks were observed in any particular frequency range for rails and sleepers, and that the PSD increased with increasing frequency up to 1 kHz, showing that the distributions in Japan and Europe were similar. In addition, the PSD in the domestic on-site environment showed high results in the 1 kHz range and above. Regarding the difference with the distribution specified by the IEC, we believe that it is necessary to collect more data on the characteristics of PSD in Japan and to clarify the causes.
In the future, based on the PSD characteristics obtained this time, we plan to study the excitation time when conducting vibration endurance tests using vibration acceleration waveforms (random waves) converted to the time domain to reproduce the actual usage environment.
Acknowledgment
We would like to express our sincere gratitude to the people at the Hokkaido Railway Company, East Japan Railway Company, Central Japan Railway Company, West Japan Railway Company, Shikoku Railway Company, and Kyushu Railway Company for their generous cooperation in conducting the field surveys described in this report.
References
- [1] “Parts for railway signal - Vibration test methods,” Japanese Industrial Standards JIS E 3014:1976, 1976 (in Japanese).
- [2] “Parts for railway signal - Vibration test methods,” Japanese Industrial Standards JIS E 3014:1992, 1992 (in Japanese).
- [3] “Parts for railway signal - Vibration test methods,” Japanese Industrial Standards JIS E 3014:1999, 1999.
- [4] Oshimi, Y., Shiomi, S., Takasaki, K. and Kamiya, T., “Investigation of the Vibrational Acceleration to Signalling Systems in the Installation Environment,” Proceedings of the 29th Railway Technology Union Symposium (J-RAIL2022), No. S7-4-4, pp. 348-351, 2022 (in Japanese).
- [5] Isshiki, R., Oshimi, Y., Shiomi, S., Takasaki, K., Kamiya, T. and Aita, N., “Analysis of vibration received by signalling equipment for types of structures and tracks,” The papers of Technical Meeting on Transportation and Electric Railway, IEE Japan, TER-23-036, 2023 (in Japanese).
- [6] Shiomi, S., Naoya, A., Oshimi, Y., Kamiya, Y. and Isshiki, R., “Investigation on impacts received by signalling equipment connecting directly to a rail from railway vehicles passing,” The papers of Technical Meeting on TER, TER-23-035, 2023 (in Japanese).
- [7] “Rolling stock equipment - Vibration and shock tests,” Japanese Industrial Standards JIS E 4031:2013.
- [8] “Parts for railway signal - Shock test methods,” Japanese Industrial Standards JIS E 3015:1992, 1992 (in Japanese).
Authors

|
Yoshikazu OSHIMI
Assistant Senior Researcher, Signalling System Laboratory, Signalling and Operation Technology Division
Research Areas: Point Machine, Signalling Devices |

|
Shunsuke SHIOMI
Senior Chief Researcher, Head of Signalling System Laboratory, Signalling and Operation Technology Division
Research Areas: Point Machine, Signalling Devices |

|
Tsuyoshi KAMIYA
Researcher, Signalling System Laboratory, Signalling and Operation Division (Former)
Research Areas: Signalling Devices |

|
Ryuto ISSHIKI
Researcher, Signalling System Laboratory, Signalling and Operation Division (Former)
Research Areas: Signalling Devices |