Abstract
Sirtuin 1 (SIRT1) is an evolutionarily conserved NAD+-dependent protein deacetylase. Given that the absolute cellular concentrations of NAD+ are much higher than the reported SIRT1 Km value for NAD+ (~90 μM), we hypothesized that changes in cellular NAD+ may not be a significant regulator of SIRT1 activity. To test this hypothesis, we examined the effects of boosting or inhibiting NAD+ synthesis on the acetylation of histone H4 lysine 16 and H3 lysine 9, reported targets of SIRT1. Altering cellular NAD+ concentrations from 100 to 1400 μM did not affect acetylation, whereas treatment with a class I/II histone deacetylase inhibitor elevated acetylation dramatically. Unexpectedly, neither SIRT1 inhibition nor SIRT1 knockdown increased histone acetylation. We conclude that SIRT1 may not be the primary deacetylase of the acetylated histone residues and that global acetylation levels may not always represent cellular SIRT1 activity.
INTRODUCTION
Sirtuin 1 (SIRT1) is an evolutionarily conserved NAD+-dependent protein deacetylase that plays critical roles in various biological processes, such as carbohydrate [
1] and fat [
2] metabolism, the circadian cycle [
3,
4], and aging [
5,
6]. Increasing the deacetylase activity of SIRT1 has been reported to protect against age-related functional decline and diseases, such as metabolic syndrome, neurodegeneration, and cancer [
7-
10]. Thus, currently, attention has been focused on physiological and pharmacological interventions that boost cellular NAD+ levels to promote healthy aging [
11,
12].
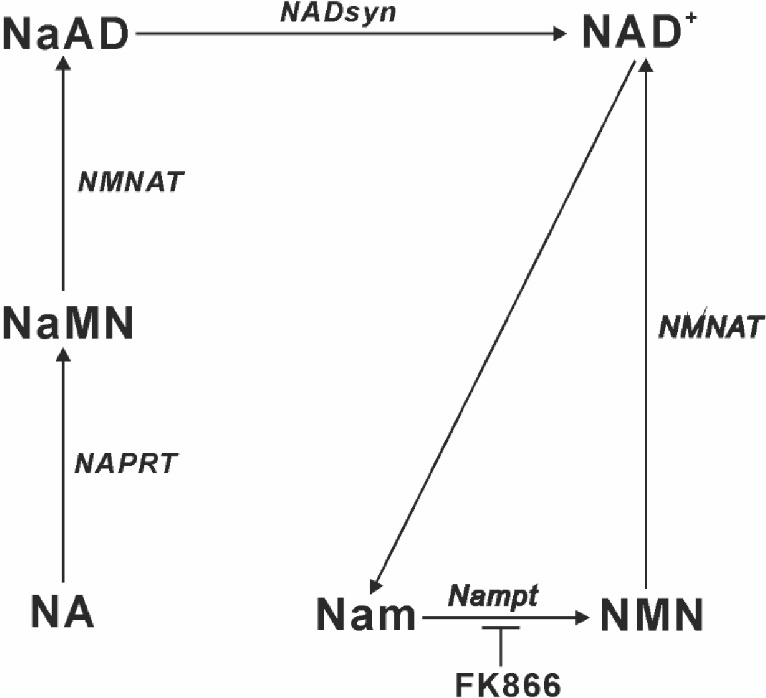
In mammalian cells, NAD+ synthesis is accomplished predominantly through the salvage pathway from nicotinamide (Nam) and nicotinic acid (NA) [
13,
14]. Nam is converted by Nam phosphoribosyltransferase (Nampt) to Nam mononucleotide (NMN) and is then converted to NAD+ (
Fig. 1). NA is converted by NA phosphoribosyltransferase (NAPRT) to NA mononucleotide, which is converted to NA adenine dinucleotide and then NAD+ (
Fig. 1). We have demonstrated previously that NA elevates cellular NAD+ levels in cells expressing NAPRT, thus protecting cells from stress [
15].
Using mass spectrometry and cell volume measurements, we recently determined absolute concentrations of NAD+ ([NAD+]) in primary cultured cells and various mammalian cell lines, and found that [NAD+] was maintained within a relatively narrow range of 400–700 μM, irrespective of cell origins [
16]. As the reported SIRT1 Km value for NAD+ (~90 µM) [
17] is much lower than the measured cellular [NAD+], we hypothesized that increased cellular NAD+ levels may not stimulate SIRT1 deacetylase activity. The evidence strongly suggests that changes in cellular NAD+ levels are not a significant regulator of SIRT1 activity [
18,
19].
In this study, we employed two human cell lines as model systems, altered cellular [NAD+] with NA and the Nampt inhibitor FK866 [
20], and examined the effects of changes in [NAD+] on the acetylation of histone H4 lysine 16 (H4K16) and histone H3 lysine 9 (H3K9), the preferred targets of the class III histone deacetylase (HDAC) SIRT1 [
21-
28]. An NA-driven increase in cellular [NAD+] to 1000–1400 μM from basal levels of 450–600 μM did not affect H4K16 (H4K16Ac) and H3K9 (H3K9Ac) acetylation, whereas treatment with the class I/II HDAC inhibitor trichostatin A (TSA) [
29] increased histone H4 and H3 acetylation dramatically. Decreasing [NAD+] from basal levels to 100–250 μM with FK866 also did not affect histone acetylation. To our surprise, EX-527, a SIRT1 inhibitor [
30], and SIRT1 knockdown also failed to increase histone acetylation. We conclude that SIRT1 may not be the primary deacetylase of acetylated H4K16 and H3K9 and that global H4K16 or H3K9 acetylation levels may not always be accurate indicators of cellular SIRT1 deacetylase activity.
MATERIALS AND METHODS
Materials
NA and Nam were obtained from Nacalai Tesque (Kyoto, Japan), and TSA was obtained from FUJIFILM Wako Pure Chemical Corporation (Osaka, Japan). FK866 and EX-527 were obtained from Sigma-Aldrich (St. Louis, MO, USA) and AdooQ Bioscience (Irvine, CA, USA), respectively. Stock solutions of TSA (1 mM) and EX-527 (30 mM) were prepared in dimethyl sulfoxide (DMSO). Custom Eagle’s minimum essential medium (MEM) without Nam (Nam-free MEM) was obtained from Biological Industries (Beit Haemek, Israel).
Cell cultures
Human hepatoma HepG2 cells stably expressing NAPRT (HepG2-NAPRT) [
31] and cervical carcinoma HeLa cells (RCB0007), obtained from RIKEN Cell Bank (Tsukuba, Japan), were maintained in MEM (FUJIFILM Wako Pure Chemical Corporation) containing antibiotics and 10% fetal bovine serum.
HepG2-NAPRT (1.5–2 × 10⁵ cells/well) and HeLa (1.5–2 × 10⁵ cells/well) cells were seeded in collagen I-coated 12-well plates (BD Biosciences, Bedford, MA, USA) and CELLSTAR 12-well plates (Greiner Bio-One, Frickenhausen, Germany), respectively. HepG2-NAPRT cells were pre-cultured for 16 h in 0.95 mL Nam-free MEM supplemented with dialyzed serum at a final concentration of 0.5% and then cultured in media containing various concentrations of NA, FK866, EX-527, or TSA for 8 h. HeLa cells were pre-cultured for 48 h in 1 mL Nam-free MEM supplemented with 2 μM Nam and then cultured in media containing the indicated concentrations of NA or FK866 for 24 h. For each experiment, a second replicate was performed to determine cell counts and volumes.
SIRT1 knockdown
HepG2-NAPRT cells (1.2 × 10⁵ cells/well) were seeded in 12-well plates, as described above. The next day, cells were transfected with 50 nM final concentrations of SIRT1 siRNA (sc-40986, Santa Cruz Biotechnology, Santa Cruz, CA, USA) or control siRNA (sc-37007, Santa Cruz Biotechnology) using the Avalanche-Omni transfection reagent (EZ Biosystems, College Park, MD, USA). Two days after transfection, cells were cultured in Nam-free MEM containing 0.5% dialyzed serum for 8 h.
Determination of cell counts and volume
Cells were trypsinized, suspended, and counted using a Scepter instrument (Millipore, Billerica, MA, USA), which also provides a readout of the counted cells’ approximate volume. These data allowed for calculations of the cellular NAD+ concentrations [
16].
NAD+ extraction
NAD+ extraction was performed by removing the culture media from each well and adding 0.4 mL of 0.5 M perchloric acid. After centrifugation, the supernatant was collected, neutralized with an equal volume of 1 M ammonium formate, and analyzed by liquid chromatography with tandem mass spectrometry (LC/MS/MS), as described below.
LC/MS/MS
LC/MS/MS was performed as described previously [
16], using a Shimadzu Prominence HPLC system (Shimadzu, Kyoto, Japan) connected to a triple quadrupole tandem mass spectrometer (LCMS-8030, Shimadzu) equipped with an ESI source operating in positive mode. Briefly, NAD+ was separated on an Atlantis dC18 resin column (150 × 2.1 mm i.d. column; 3-µm particle size; Waters, Milford, MA, USA). The mobile phase consisted of 5 mM ammonium formate (solvent A) and methanol (solvent B). Solvent B was applied in a linear progression: 0 min, 2%; 3 min, 20%; 6 min, 70%; 11 min, 70%; 11.1 min, 2%; and 17 min, 2%. The flow rate was 0.15 mL/min. NAD+ quantitation was performed by the selected reaction monitoring mode with an ion transition of m/z 644.1 > 136.1. Shimadzu LabSolutions software (version 5.60SP2) was used for data acquisition and processing.
Determination of protein acetylation levels
SDS sample buffer was added to the cells after removing the culture media. Cell lysates were separated using SDS-PAGE and transferred onto Immobilon-P membranes (Millipore). Membranes were blocked with 20% EzBlock Chemi (ATTO, Tokyo, Japan) and then incubated in Can Get Signal Immunoreaction Enhancer Solution 1 (Toyobo, Osaka, Japan) for 18 h at 4°C with anti-acetyl-lysine (#9441, Cell Signaling Technology, Danvers, MA, USA), anti-H4K16Ac (#07-329, Upstate, Temecula, CA, USA), anti-H3K9Ac (#61664, Active Motif, Carlsbad, CA, USA), anti-histone H4 (#07-108, Upstate), anti-histone H3 (#17168-1-AP, Proteintech, Rosemont, IL, USA), or anti-SIRT1 antibodies (#8469, Cell Signaling Technology). The blots were incubated at room temperature for 1–3 h in Can Get Signal Immunoreaction Enhancer Solution 2 containing horseradish peroxidase–conjugated goat anti-rabbit immunoglobulin G (IgG) antibodies (#458, MBL, Nagoya, Japan), anti-mouse IgG antibodies (#330, MBL), or anti-rat IgG antibodies (#0825, Immunotech, Marseille, France). The bound antibodies were then detected with Chemi-Lumi One Super (Nacalai Tesque).
RESULTS
SIRT1 deacetylates histones with a preference for H4K16Ac and H3K9Ac [
21-
28]. To determine whether SIRT1 deacetylase can be activated by elevating cellular [NAD+], we examined the effects of increasing [NAD+] on H4K16 and H3K9 acetylation using NA, a precursor of the NAPRT-dependent NAD+ biosynthetic pathway (
Fig. 1). For these experiments, we used HepG2 cells overexpressing human NAPRT (HepG2-NAPRT cells) [
31]. We reported previously that exogenous NA added to mammalian cells expressing NAPRT increases cellular NAD+ levels [
15]. In this study, supplying HepG2-NAPRT cells with 20 μM NA increased cellular [NAD+] to 1400 μM from the basal level of 450 μM (
Fig. 2A). As shown in
Fig. 2B, two major acetylated protein bands corresponding to histones H4 and H3 were detected by anti-acetyl-lysine antibodies in HepG2-NAPRT whole-cell lysates. However, this increase in cellular NAD+ did not decrease the acetylation levels of H4K16 or H3K9 (
Fig. 2B). Next, we decreased cellular [NAD+] with 100 nM FK866, a Nampt inhibitor [
20]. The resulting decrease in [NAD+] to 250 μM from the basal level (
Fig. 2A) also did not affect acetylation levels of H4K16 or H3K9 (
Fig. 2B). SIRT1 expression also was not altered after the treatment with NA or FK866 (
Fig. 2B). Thus, an increase in cellular [NAD+] from 250 to 1400 μM, which is 15-fold higher than the reported SIRT1 Km value for NAD+ (~90 μM) [
17], does not affect histone acetylation levels.
Unlike NA or FK866, 1 μM TSA, a class I/II HDAC inhibitor [
29], dramatically increased the acetylation of sites on both histone H4 and H3 without accompanying changes in cellular [NAD+] or SIRT1 expression (
Fig. 2), confirming that the signals we observed using targeted acetylated lysine antibodies indeed represent protein acetylation.
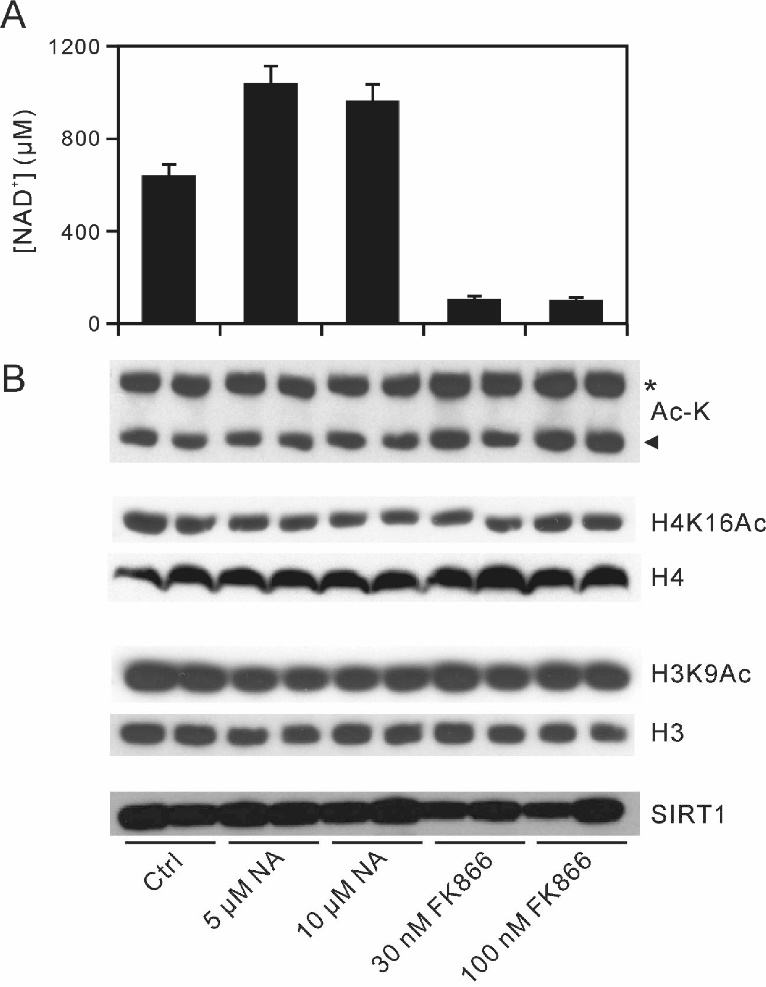
We next examined the effect of NA on histone acetylation in HeLa cells expressing endogenous NAPRT [
16]. As shown in
Fig. 3A, the addition of 5 and 10 μM NA to the culture medium of HeLa cells elevated cellular [NAD+] to around 1000 μM, which is 10-fold higher than the reported Km value for NAD+ of SIRT1, from basal levels of 600 μM. Such large increases in [NAD+] did not decrease acetylation levels of H4K16 or H3K9 (
Fig. 3B). Adding 30 and 100 nM FK866 decreased cellular [NAD+] from 600 to near 100 μM, close to the Km value of SIRT1 for NAD+ (
Fig. 3A), but did not increase acetylation levels of H4K16 or H3K9, as shown in
Fig. 3B. Moreover, SIRT1 expression was unchanged by FK866 (
Fig. 3B). Thus, increasing cellular [NAD+] by 10-fold from near the Km value for NAD+ of SIRT1 does not affect histone acetylation levels.
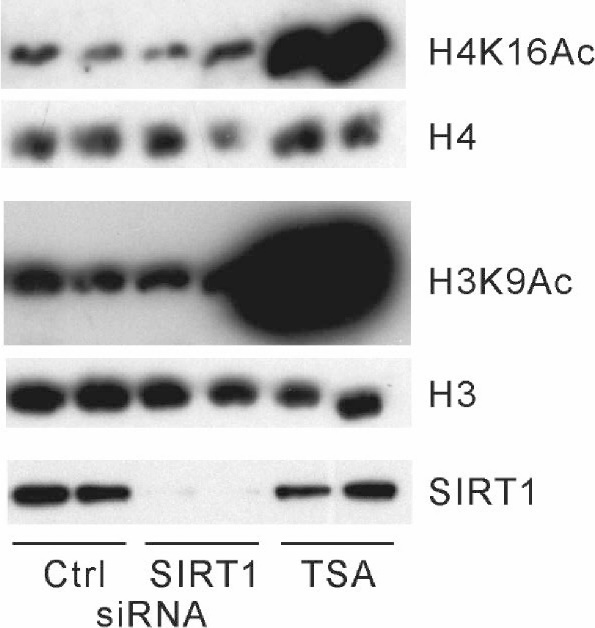
Although these findings indicate that cellular SIRT1 activity may not be altered by large changes in the [NAD+], we could not exclude the possibility that SIRT1 does not deacetylate a majority of histones. To test this possibility, we examined the effect of SIRT1 deacetylase activity inhibition or reductions in SIRT1 expression on histone acetylation in HepG2-NAPRT cells. To our surprise, treatment with EX-527 (30 μM), a SIRT1 inhibitor [
30] (
Fig. 2B), and SIRT1 knockdown (
Fig. 4) did not increase histone acetylation levels, indicating that SIRT1 deacetylates a limited number of histones.
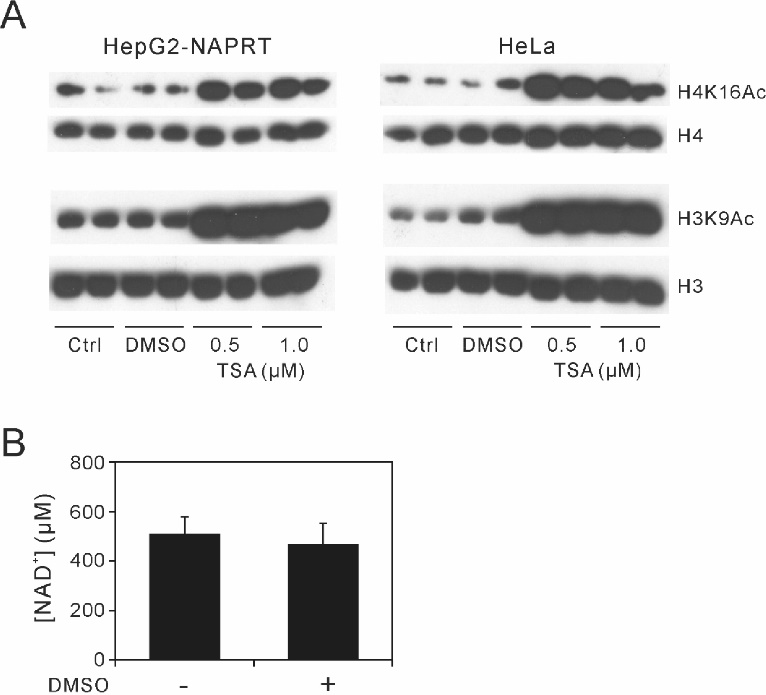
As the culture medium supplemented with 1 μM TSA or 30 µM EX-527 contained 0.1% DMSO, we examined the effects of 0.1% DMSO on histone acetylation and cellular [NAD+]. The presence of 0.1% DMSO in the culture medium did not affect histone acetylation in HepG2-NAPRT or HeLa cells (
Fig. 5A). [NAD+] in HepG2-NAPRT cells was also unaltered in the presence of 0.1% DMSO (
Fig. 5B).
DISCUSSION
NAD+ is an essential co-substrate required for SIRT1 deacetylase activity. We investigated whether changes in [NAD+] indeed regulate SIRT1 deacetylase activity. We altered cellular [NAD+] using NA and FK866 and examined the resulting changes in acetylated H4K16 and H3K9, which are reported SIRT1 targets [
21-
28]. We found that increasing cellular [NAD+] to 1000–1400 μM from basal levels of 450–600 μM or decreasing the [NAD+] to 100 μM did not affect histone H4 and H3 acetylation, whereas treatment with TSA, a class I/II HDAC inhibitor [
29], increased acetylation levels dramatically. Unexpectedly, neither EX-527, a SIRT1 inhibitor [
30], nor SIRT1 knockdown increased histone acetylation, indicating that global acetylation levels of H4K16 and H3K9 may not be appropriate indicators of intracellular SIRT1 deacetylase activity.
We investigated whether SIRT1 deacetylase activity is regulated strictly by cellular [NAD+]. In contrast to most studies that have described cellular NAD+ content [
16], we provided absolute cellular NAD+ concentrations by calculating the molar amounts of NAD+ based on LC/MS/MS and cellular volume measurements. We manipulated [NAD+] by boosting NAD+ synthesis with NA in HepG2 cells overexpressing NAPRT (HepG2-NAPRT) and HeLa cells expressing endogenous NAPRT. In HepG2-NAPRT cells, NA-induced increases in [NAD+] from 450 to 1400 μM did not reduce H4K16 and H3K9 acetylation. In addition, increasing [NAD+] in HeLa cells from 600 to 1000 μM using NA did not reduce histone acetylation. We also manipulated cellular NAD+ levels using the Nampt inhibitor FK866. In HepG2-NAPRT and HeLa cells, treatment with FK866 decreased cellular [NAD+] from 450 to 250 μM and from 600 to 100 μM, respectively, which did not result in increased H4K16 and H3K9 acetylation. Cellular NAD+ concentrations obtained here could represent the concentrations of nuclear/cytosol fractions [
16]. Thus, our observations are consistent with the notion that normal levels of cellular NAD+ are more than what is required for the nuclear enzyme SIRT1, and thus, [NAD+] is not a limiting factor for deacetylase activity under normal conditions if SIRT1 is a major deacetylase of acetylated H4K16 and H3K9.
We found that SIRT1 knockdown or inhibition with EX-527 did not influence H4K16 or H3K9 acetylation. In contrast, the class I/II HDAC inhibitor TSA elevated H4K16 and H3K9 acetylation dramatically. H4K16 and H3K9 may thus be deacetylated mainly by class I/II HDACs but not SIRT1. These observations provide evidence that global acetylation levels of H4K16 and H3K9 may not always be proper indicators of intracellular SIRT1 deacetylase activity.
Acetylated H4K16 or H3K9 are preferred SIRT1 substrates [
21-
28]. Gardell et al. reported that boosting NAD+ synthesis with a Nampt activator and the resultant activation of SIRT1 decreases H4K16 acetylation in A549 cells [
26]. In contrast, we found that increasing or decreasing [NAD+] in two different cell types did not affect H4K16 or H3K9 acetylation. Okabe et al. also found that H3K9 acetylation is not changed by NAD+ synthesis blockade by FK866 in 3T3-L1 cells [
27]. These contradictory findings might arise from different cellular contexts, such as the cell type–specific recruitment of SIRT1 and class I/II HDACs to chromatin. In our culture models, class I/II HDACs rather than SIRT1 may be the primary deacetylators of H4K16 and H3K9.
Resting NAD+ levels in this study were 450–600 μM. Although we cannot directly determine whether SIRT1 deacetylase activity depends strictly on cellular [NAD+], based on the much higher cellular [NAD+] than the Km value for NAD+ of SIRT1 (~90 μM) [
17] under resting conditions, any increase in cellular [NAD+] beyond basal levels would not further increase SIRT1 deacetylase activity. Thus, changes in cellular [NAD+] would not be a significant regulator of SIRT1 deacetylase. Indeed, several lines of evidence strongly suggest the existence of SIRT1 regulation mechanisms independent of changes in NAD+ levels. For example, SIRT1 is phosphorylated in response to adrenergic stimulation, resulting in enhanced deacetylase activity [
18]. SIRT1 also physically associates with nuclear protein deleted in breast cancer-1 (DBC-1) under feeding conditions that inhibit SIRT1 activity, whereas DBC-1 dissociates from SIRT1 after starvation, thus increasing SIRT1 activity [
19].
In conclusion, global acetylation levels of H4K16 or H3K9 do not always serve as accurate indicators of intracellular SIRT1 deacetylase activity. A conclusive determination of whether SIRT1 deacetylase activity depends strictly on cellular NAD+ levels will require studies with specific SIRT1 substrates for which acetylation levels increase significantly on SIRT1 knockdown. Measures of intracellular SIRT1 deacetylase activity based on global H4K16 or H3K9 acetylation levels should be evaluated carefully, and the effects of SIRT1 knockdown should be considered [
26,
27].
Acknowledgments
The authors would like to thank Enago (www.enago.jp) for the English language review.
Conflict of Interest
The authors declare no conflicts of interest.
References
- 1)
Rodgers
JT
,
Lerin
C
,
Haas
W
,
Gygi
SP
,
Spiegelman
BM
,
Puigserver
P
.
Nutrient control of glucose homeostasis through a complex of PGC-1α and SIRT1. Nature
2005;
434:
113-
8. doi:
10.1038/nature03354.
- 2)
Picard
F
,
Kurtev
M
,
Chung
N
,
et al.
Sirt1 promotes fat mobilization in white adipocytes by repressing PPAR-γ. Nature
2004;
429:
771-
6. doi:
10.1038/nature02583.
- 3)
Ramsey
KM
,
Yoshino
J
,
Brace
CS
,
et al. Circadian clock feedback cycle through NAMPT-mediated NAD+ biosynthesis. Science
2009;
324:
651-
4. doi:
10.1126/science.1171641.
- 4)
Nakahata
Y
,
Sahar
S
,
Astarita
G
,
Kaluzova
M
,
Sassone-Corsi
P
.
Circadian control of the NAD+ salvage pathway by CLOCK-SIRT1. Science
2009;
324:
654-
7. doi:
10.1126/science.1170803.
- 5)
Braidy
N
,
Guillemin
GJ
,
Mansour
H
,
Chan-Ling
T
,
Poljak
A
,
Grant
R
.
Age related changes in NAD+ metabolism oxidative stress and Sirt1 activity in wistar rats
.
PLoS One
2011;
6:e19194. doi:
10.1371/journal.pone.0019194.
- 6)
Massudi
H
,
Grant
R
,
Braidy
N
,
Guest
J
,
Farnsworth
B
,
Guillemin
GJ
.
Age-associated changes in oxidative stress and NAD+ metabolism in human tissue
.
PLoS One
2012;
7:e42357. doi:
10.1371/journal.pone.0042357.
- 7)
Guarente
L
.
Franklin
H
.
Epstein lecture: Sirtuins, aging, and medicine.
N Engl J Med
2011;
364:
2235-
44. doi:
10.1056/NEJMra1100831.
- 8)
Schug
TT
,
Li
X
.
Sirtuin 1 in lipid metabolism and obesity.
Ann Med
2011;
43:
198-
211. doi:
10.3109/07853890.2010.547211.
- 9)
Hall
JA
,
Dominy
JE
,
Lee
Y
,
Puigserver
P
.
The sirtuin family’s role in aging and age-associated pathologies.
J Clin Invest
2013;
123:
973-
9. doi:
10.1172/JCI64094.
- 10)
Hubbard
BP
,
Sinclair
DA
.
Small molecule SIRT1 activators for the treatment of aging and age-related diseases.
Trends Pharmacol Sci
2014;
35:
146-
54. doi:
10.1016/j.tips.2013.12.004.
- 11)
Verdin
E
.
NAD+ in aging, metabolism, and neurodegeneration. Science
2015;
350:
1208-
13. doi:
10.1126/science.aac4854.
- 12)
Fang
EF
,
Lautrup
S
,
Hou
Y
,
et al. NAD+ in aging: Molecular mechanisms and translational implications
.
Trends Mol Med
2017;
23:
899-
916. doi:
10.1016/j.molmed.2017.08.001.
- 13)
Chiarugi
A
,
Dölle
C
,
Felici
R
,
Ziegler
M
.
The NAD metabolome--a key determinant of cancer cell biology.
Nat Rev Cancer
2012;
12:
741-
52. doi:
10.1038/nrc3340.
- 14)
Garten
A
,
Schuster
S
,
Penke
M
,
Gorski
T
,
Giorgis
T
,
Kiess
W
.
Physiological and pathophysiological roles of NAMPT and NAD metabolism.
Nat Rev Endocrinol
2015;
11:
535-
46. doi:
10.1038/nrendo.2015.117.
- 15)
Hara
N
,
Yamada
K
,
Shibata
T
,
Osago
H
,
Hashimoto
T
,
Tsuchiya
M
.
Elevation of cellular NAD levels by nicotinic acid and involvement of nicotinic acid phosphoribosyltransferase in human cells.
J Biol Chem
2007;
282:
24574-
82. doi:
10.1074/jbc.M610357200.
- 16)
Hara
N
,
Osago
H
,
Hiyoshi
M
,
Kobayashi-Miura
M
,
Tsuchiya
M
.
Quantitative analysis of the effects of nicotinamide phosphoribosyltransferase induction on the rates of NAD+ synthesis and breakdown in mammalian cells using stable isotope-labeling combined with mass spectrometry
.
PLoS One
2019;
14:e0214000. doi:
10.1371/journal.pone.0214000.
- 17)
Cantó
C
,
Menzies
KJ
,
Auwerx
J
.
NAD+ metabolism and the control of energy homeostasis: A balancing act between mitochondria and the nucleus
.
Cell Metab
2015;
22:
31-
53. doi:
10.1016/j.cmet.2015.05.023.
- 18)
Gerhart-Hines
Z
,
Dominy
JE
Jr,
Blättler
SM
,
et al. The cAMP/PKA pathway rapidly activates SIRT1 to promote fatty acid oxidation independently of changes in NAD+
.
Mol Cell
2011;
44:
851-
63. doi:
10.1016/j.molcel.2011.12.005.
- 19)
Escande
C
,
Chini
CC
,
Nin
V
,
et al.
Deleted in breast cancer-1 regulates SIRT1 activity and contributes to high-fat diet-induced liver steatosis in mice.
J Clin Invest
2010;
120:
545-
58. doi:
10.1172/JCI39319.
- 20)
Hasmann
M
,
Schemainda
I
.
FK866, a highly specific noncompetitive inhibitor of nicotinamide phosphoribosyltransferase, represents a novel mechanism for induction of tumor cell apoptosis.
Cancer Res
2003;
63:
7436-
42.
- 21)
Imai
S
,
Armstrong
CM
,
Kaeberlein
M
,
Guarente
L
.
Transcriptional silencing and longevity protein Sir2 is an NAD-dependent histone deacetylase.
Nature
2000;
403:
795-
800. doi:
10.1038/35001622.
- 22)
Vaquero
A
,
Scher
M
,
Lee
D
,
Erdjument-Bromage
H
,
Tempst
P
,
Reinberg
D
.
Human SirT1 interacts with histone H1 and promotes formation of facultative heterochromatin.
Mol Cell
2004;
16:
93-
105. doi:
10.1016/j.molcel.2004.08.031.
- 23)
Ryall
JG
,
Dell’Orso
S
,
Derfoul
A
,
et al.
The NAD+-dependent SIRT1 deacetylase translates a metabolic switch into regulatory epigenetics in skeletal muscle stem cells
.
Cell Stem Cell
2015;
16:
171-
83. doi:
10.1016/j.stem.2014.12.004.
- 24)
Sun
L
,
Kokura
K
,
Izumi
V
,
et al. MPP8 and SIRT1 crosstalk in E-cadherin gene silencing and epithelial-mesenchymal transition
.
EMBO Rep
2015;
16:
689-
99. doi:
10.15252/embr.201439792.
- 25)
Rifaï
K
,
Judes
G
,
Idrissou
M
,
et al. SIRT1-dependent epigenetic regulation of H3 and H4 histone acetylation in human breast cancer
.
Oncotarget
2018;
9:
30661-
78. doi:
10.18632/oncotarget.25771.
- 26)
Gardell
SJ
,
Hopf
M
,
Khan
A
,
et al.
Boosting NAD+ with a small molecule that activates NAMPT
.
Nat Commun
2019;
10:3241. doi:
10.1038/s41467-019-11078-z.
- 27)
Okabe
K
,
Nawaz
A
,
Nishida
Y
,
et al.
NAD+ metabolism regulates preadipocyte differentiation by enhancing α-ketoglutarate-mediated histone H3K9 demethylation at the PPARγ promoter
. Front
Cell Dev Biol
2020;
8:586179. doi:
10.3389/fcell.2020.586179.
- 28)
Sarikhani
M
,
Garbern
JC
,
Ma
S
,
et al.
Sustained activation of AMPK enhances differentiation of human iPSC-derived cardiomyocytes via sirtuin activation. Stem
Cell Reports
2020;
15:
498-
514. doi:
10.1016/j.stemcr.2020.06.012.
- 29)
Dokmanovic
M
,
Clarke
C
,
Marks
PA
.
Histone deacetylase inhibitors: overview and perspectives. Mol
Cancer Res
2007;
5:
981-
9. doi:
10.1158/1541-7786.MCR-07-0324.
- 30)
Gertz
M
,
Fischer
F
,
Nguyen
GT
,
et al.
Ex-527 inhibits Sirtuins by exploiting their unique NAD+-dependent deacetylation mechanism
. Proc
Natl Acad Sci USA
2013;
110:
E2772-
81. doi:
10.1073/pnas.1303628110.
- 31)
Hara
N
,
Shibata
T
,
Osago
H
,
Yamada
K
,
Tsuchiya
M
.
Formation of [nicotinamide-2H3]NAD+ from [2H4]nicotinamide and [2H4]nicotinic acid in human HepG2N cells and involvement of 2H/1H exchange at the redox site of NAD+/NADH
.
J Nutr Sci Vitaminol
2014;
60:
17-
21. doi:
10.3177/jnsv.60.17.