Abstract
With the development of information technology, digital pathology, including image
analysis, and automatic diagnosis of pathological tissue, has developed remarkably. It has
become possible to recognize and quantify histopathological features using artificial
intelligence (AI). We have attempted to analyze and quantify various histopathological
findings using image processing software. In this report, we introduce the latest results
of recognition and quantification of various pathological findings in the liver, kidney,
and lung using image processing software, including Image-Pro Plus, Tissue Studio, and
HALO. HALO is an image analysis platform specialized for the study of pathological
tissues, which enables tissue segmentation by using AI. Using HALO, histopathological
changes, which are difficult or impossible to analyze with conventional image analysis,
could be easily, and accurately analyzed. Quantification of pathological findings by image
analysis can contribute to improve objectivity, precision, and persuasiveness of
pathological evaluation. Quantification of morphological changes of histopathological
findings using digital pathology including AI in robust pathology is a new and innovative
evaluation technique. In the future, a versatile and useful tool is expected to enable
faster and more efficient pathological evaluation in both non-clinical and clinical
fields.
Introduction
Pathological examination is powerful in investigating the toxicity and efficacy of
compounds, or disease condition by directly observing morphological changes in various
tissues in both clinical and nonclinical settings. Evaluation by experienced pathologists
and peer review by multiple individuals increases objectivity. However, the evaluations are
qualitative or semiquantitative and introducing a bias between individuals and between
facilities is unavoidable; moreover, human evaluation is time- and labor-intensive. Many
semiquantitative scoring systems are used as an index of morphological changes of
pathological tissues [1]. Although these scoring
systems are useful and sufficient for pathological evaluation, quantifying morphological
changes of pathological tissues has the following advantages. Morphological changes of
pathological tissues can be quantified objectively, accurately, and precisely. If these
quantitative results are visualized by image enhancement or expressed graphically, it
persuades researchers who are not familiar with pathology. Moreover, the reliability is
improved by statistically analyzing the quantitative values. If quantitative analysis of
pathological evaluations can be automated, it can improve efficiency, save labor, and
speed-up evaluation. A quantification tool that can detect morphological changes that are
difficult for a pathologist to judge can revolutionize pathological evaluation.
Quantification of histopathological changes by morphometry have been performed for a long
time. Recently, with the development of information technology, digital pathology has also
developed remarkably. An increasing number of researchers have been attempting to analyze
pathological tissue and diagnose the pathology using machine learning or artificial
intelligence (AI) [2,3,4,5,6,7,8]. Notably, in the clinical field, some
cancer tissues can be recognized by automatic diagnosis software with high accuracy [9,10,11]. In contrast, in the nonclinical field, specific
areas of interest are stained using special staining or immunostaining, and the area or
number may be simply quantified in many cases. However, it is diffucult to analyze and
quantify complex and highly variable tissue morphology using hematoxylin and eosin (HE)
stained specimens.
With the widespread use of digital pathology, image processing software that can quantify
morphological changes of pathological tissues has enabled analysis. We have analyzed and
quantified various histopathological findings using a conventional image processing software
such as Image-Pro Plus (IPP) and Tissue Studio to convert quantitative results into
indicators of drug efficacy or toxicity [7, 12]. However, these quantitative analyses require high
expertise in the setting of conditions and construction of algorithms for image processing
software in addition to pathological knowledge. Therefore, it is not easy for everyone to
analyze tissue image, and this practice tends to be of low versatility. Recently, we have
analyzed and recognized tissue morphological changes using HALO which is an image analysis
platform specialized for the study of pathological tissues [8]. By learning the morphological features of pathological tissues using AI,
including random forest or neural network, it is possible to recognize complex features of
pathological tissues that could not be recognized and analyzed by conventional software. In
this review, we introduce some examples of morphological feature recognition and
quantification of histopathological findings using image processing software, and discuss
their potential and future prospects.
Image Analysis of Pathological Tissue Using Image Processing Software
HALO has an image analysis function based on parameter settings, including color and form,
of pathological tissues. By adding a functional module specialized for analysis of various
morphologies of pathological tissues, these quantitative analyses are possible [8, 13,14,15,16,17].
Furthermore, by learning and recognizing the morphological structures and features of
pathological tissues, these regions (tissue class) and structures can be easily separated
and quantified. Recent studies have used HALO to easily separate tissue classes and quantify
various morphological features in pathological tissue [18,19,20]. Table 1 shows the summary of
quantitative analysis of pathological findings that we have attempted using various image
processing software. Examples of image analysis, mainly using HALO in the main organs of
rodent or humans, are described below.
Table 1.
Summary of the properties of quantification of the various findings using image
processing software
| Organ |
Findings |
Measurement parameter |
Image-pro premier |
Tissue studio |
HALO |
HALO module |
| Liver |
Degeneration/necrosis hepatocytes |
Area of degeneration/necrosis |
No |
- |
Yes |
RF Classifier |
| Hepatocellular hypertrophy |
Size and number of hepatocyte (simulated) |
No |
Yes |
Yes |
(RF Classifier) + Cytonuclear |
| Hepatocellular vacuolation (lipid) |
Size of each vacuole |
Yes |
No |
Yes |
Vacuole |
| Hepatocellular vacuolation (phospholipid) |
Size of each vacuole |
Yes |
No |
Yes |
Vacuole |
| Bile duct proliferation |
Area of bile duct |
No |
- |
Yes |
RF Classifier |
| Fibrosis (with azan stain) |
Area of fibrosis |
Yes |
Yes |
Yes |
RF Classifier or Area quantification |
| Kidney |
Basophilic tubules (regeneration) |
Area of basoplilic tubule |
No |
- |
Yes |
RF Classifier, NN Classifier |
| Hyaline casts |
Area of cast |
- |
- |
Yes |
RF Classifier, NN Classifier |
| Degeneration/necrosis tubules |
Area of degeneration/necrosis |
No |
- |
Yes |
NN Classifier |
| Glomeruli |
Area and number of glomerulus |
No |
No |
Yes |
NN Classifier |
| Fibrosis of glomeluri (with sirius red stain) |
Area and numer of fibrosis in each glomerulus |
No |
No |
Yes |
NN Classifier |
| Glomeruli, mesangial cell proliferation |
Area and number of mesangial cell proliferative glomerulus |
No |
- |
Yes |
NN Classifier |
| Glomerulosclerosis |
Area and number of glomerulosclerosis |
No |
- |
Yes |
NN Classifier |
| Vacuolation of renal tubular epithelium |
Area of vacuole |
No |
No |
- |
- |
| Lung |
Dilation of alveolar space |
HALO: Area of alveolar space IPP: Mean linear intercept
(MLI) |
Yes |
- |
Yes |
(RF Classifier) + Muscle fiber |
| Fibrosis (with azan stain) |
Area of fibrosis |
No |
- |
Yes |
RF Classifier |
| Spleen |
Atrophy of marginal zone |
Area of white pulp, red pulp, and marginal zone |
No |
No |
Yes |
RF Classifier |
| Decrease of extramedullary hematopoiesis |
Area of erythroblast (simulated) |
No |
No |
Yes |
RF Classifier + Cytonuclear |
| Thymus |
Cortical atrophy |
Area of cortex and medulla |
No |
No |
Yes |
RF Classifier |
| Adipocyte |
Adipocyte hypertrophy |
Size and number of adipocyte |
Yes |
No |
Yes |
(RF Classifier) + Muscle fiber |
| Pancreas |
Atrophy (Hypertrophy) of islets of Langerhans |
Area of islets of Langerhans (α, β cell) |
No |
Yes |
Yes |
Islet |
| Skeletal muscle |
Degeneration/necrosis (with IgG-immunostain) |
IgG-positive area of myocyte |
No |
- |
Yes |
RF Classifier |
| Parotid gland |
Atrophy of acinar cells |
Size and number of acinar cell |
No |
- |
Yes |
RF Classifier + Vacuole |
| Sublingual gland |
Atrophy of acinar cells |
Size and number of acinar cell |
No |
- |
Yes |
RF Classifier + Vacuole |
| Adrenal grand |
Adrenocortical hypertrophy |
Size and number of adrenocortical cells (simulated) |
No |
Yes |
Yes |
(RF Classifier) + Cytonuclear |
| Intestine |
Increase of mucin |
Area of mucin-derived vacuole |
Yes |
- |
Yes |
RF Classifier or Area quantification |
| Intestinal villi |
Length of intestinal villi |
Yes |
- |
Yes |
- |
| Skin |
Thickening of (epi) dermis |
Thickness of (epi) dermis |
Yes |
- |
Yes |
- |
Yes: quntificable, No: not quantificable, -: not examine, RF: random forest, NN: neural
network, IPP: Image-Pro Plus.
Liver
Pathological changes may occur in the liver as it metabolizes foreign substances absorbed
by the body. Although vacuoles derived from lipids or phospholipids can be analyzed by IPP
[7, 12], the
size of vacuoles is easily quantified using HALO (Fig.
1A–C) [8]. The area of fibrosis (stained with
azan stain, Sirius red stain, or Masson’s trichrome stain) was quantifiable using both IPP
and HALO. By quantifying changes in the size of lipid droplets and the area of fibrosis,
conventional pathological evaluation of the liver in the nonalcoholic steatohepatitis (NASH)
model using nonalcoholic fatty liver disease (NAFLD) activity score (NAS) [21, 22] was more
precise and objective [12]. In this image analysis,
some sinusoidal spaces were recognized as lipid droplets, which is a drawback of the
evaluation system. Therefore, automated image analysis should be accompanied by visual
examination. Hepatocyte hypertrophy was analyzed using Tissue Studio or HALO [7, 8], which
includes the use of an algorithm that simulates the cytoplasm by recognizing hepatocyte
nuclei. However, the nucleus does not appear in extremely enlarged hepatocytes, which cannot
be simulated and evaluated. Furthermore, hepatocyte degeneration or necrosis such as
eosinophilic cytoplasm and atrophied nuclei (Fig.
1D–F) and bile duct area (Fig. 1G–I),
which were difficult or impossible to analyze with conventional image processing software,
were recognized and the areas were quantified using HALO [8].

Kidney
The structure of renal pathology is complex; therefore, in many cases, semiquantitative
evaluation methods, including scoring the degree of tubular damage [23] and glomerular lesions, are performed and morphometric changes of
pathological tissue have never been quantified. Using random forest classifier of HALO,
hyaline casts, basophilic tubules (Fig. 2A–C), and
degenerated or necrotic tubules (Fig. 2D–F) were
recognized, and the areas were quantified [8]. In
addition, using the neural network classifier (deep learning) of HALO, morphometric changes
in the glomeruli, including mesangial cell proliferation or sclerosis, were recognized and
the area of lesion or number of abnormal glomeruli were quantified (Fig. 2G–I). Furthermore, we investigated whether various
histopathological findings in animal renal disease model could be recognized and analyzed.
If histopathological changes in complex renal tissues can be recognized automatically,
easily, and accurately using image processing software, it can revolutionize pathological
examination.

Lung
The size of alveolar spaces that have changed by tobacco exposure is evaluated using an
indirect indicator such as the mean linear interception (MLI) [24], and we have quantified it easily and efficiently using morphological
processing and macro tool equipped in IPP (Fig.
3B) [7]. The size of alveolar spaces was
directly quantified using HALO (Fig. 3A, 3C, 3D).
For the evaluation of pulmonary fibrosis, semiquantitative methods such as the Ashcroft
scale are used frequently (Fig. 3F) [25, 26]. Recently,
a method based on evaluating pulmonary tissue density has been reported [27, 28]. Pulmonary
fibrosis is stained blue or red with azan or Sirius red, respectively; however, tissues
other than fibrosis are also stained. Therefore, it is impossible to distinguish and
quantify using color settings of the conventional image analysis method. Using HALO, we have
quantified the fibrosis area by recognizing morphological features of fibrosis, normal
alveolar walls, and foamy macrophages, which are stained in the same color as the fibrosis
(Fig. 3E, 3G, 3H).

Furthermore, if the type of infiltrating inflammatory cells, such as macrophages and
mononuclear cells, in the pulmonary lesion can be identified and analyzed in detail, it can
be applied to pulmonary pathological evaluation including pneumonia due to chronic
obstructive pulmonary disease.
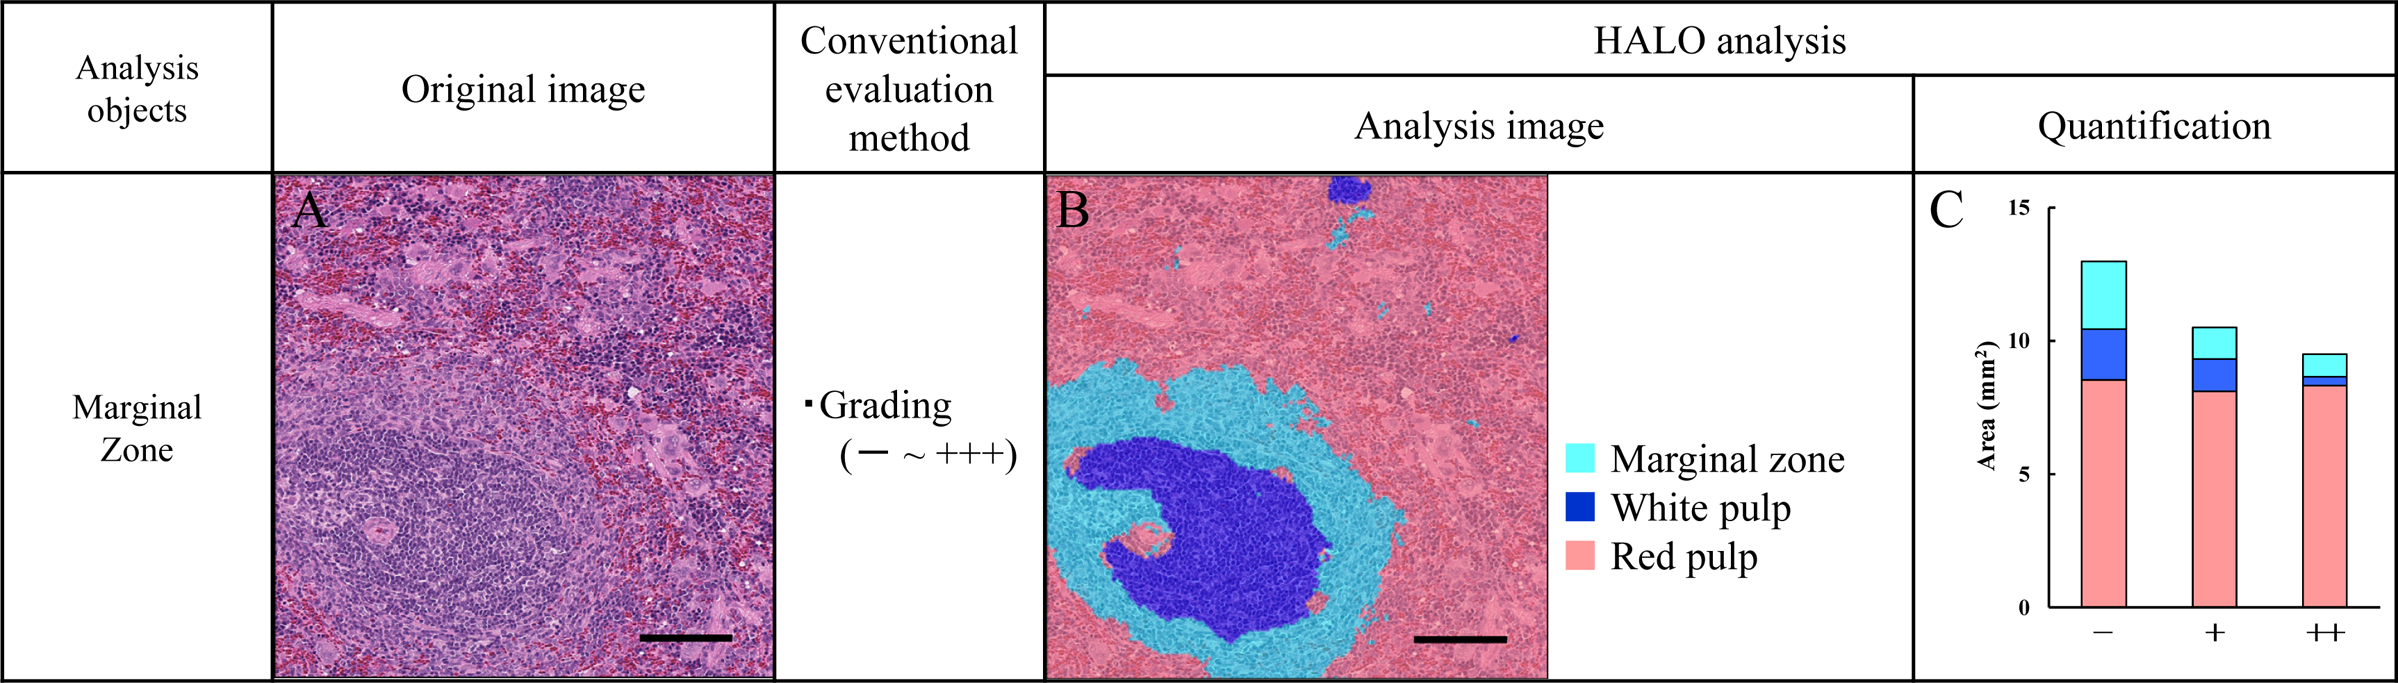
Spleen
Pathologically, the spleen has red pulp, white pulp, and marginal zone, which is the border
region between the red pulp and white pulp. The region of red pulp, white pulp, and marginal
zone in the spleen often change as a result of immune stimulation. The morphological
features of the red pulp, white pulp, and marginal zone were learned and separated using
HALO, and the degree of findings such as atrophy of the white pulp and the marginal zone
were quantified (Fig. 4A–C) [8].
Adipocyte
The size of adipocytes can be quantified using Adobe Photoshop [29] or IPP (Fig. 5B) [7], but it is necessary to connect the contours of the
adipocytes that are not connected at several places either manually or by morphological
processing, which are labor- and time-intensive. Using HALO, the size of the adipocyte was
analyzed and quantified easily (Fig. 5A, 5C, 5D)
[8].
Other Organs and Tissues
As described in Table 1, various morphological
changes of pathological tissues can be quantified.
Ethical Approval
All animal experiments were in accordance with the institutional guidelines and were
approved in advance by the Committee of Animal Experiments in the Research Division of
Mitsubishi Tanabe Pharma Corporation.
Conclusions and Perspectives
With the development of digital pathology in recent years, we have examined whether digital
image analysis of various pathological tissues is possible using several image processing
software. By using HALO (random forest classifier and neural network classifier), various
morphological features of pathological tissues that could not be recognized using
conventional image processing software could be recognized, thereby making it possible to
recognize and quantitatively analyze significant morphological changes. It was difficult for
the random forest classifier to recognize detailed tissue morphology such as glomeruli.
However, it was possible to recognize morphological changes in and around the glomerulus
using the neural network algorithm with deep learning algorithm. In addition, complex
pathological changes including basophilic changes and degeneration or necrosis of renal
tubules was learned and recognized using HALO.
Inflammatory cells, which often appear in various pathological conditions, can be
quantified using IPP or HALO if they have a simple size and color like lymphocytes. However,
it was difficult to extract when they formed clusters, and could not be distinguished from
other types of inflammatory infiltrating cells, such as macrophages or neutrophils. It seems
that organizational structure as small as nucleus is difficult to recognize and we expect
development of software to enable these functions in the future.
It is possible to recognize and quantify various organizational structures and
morphological changes. However, it is not a versatile method and it is necessary for a
pathologist to confirm the results of image analysis. To establish suitable image analysis
methods, many verifications, and validations are required. In addition, it is necessary to
seek the existence and utility value as a tool for final diagnosis and evaluation. On the
other hand, it is possible that advanced morphological feature recognition using AI enables
detection of morphological changes that are difficult for humans to distinguish. Thus,
subtle drug effects and changes in toxicity, which are difficult to analyze via conventional
pathological evaluation using microscopy, may be detected.
Histopathological changes are easy to analyze when fibrosis or infiltrating cells can be
specifically stained using immunohistochemistry. However, it will be more useful and
versatile if the morphological changes of pathological tissue in HE stain, which is the most
common in pathological specimens, can be recognized and quantified.
If various histopathological structures and morphological changes were analyzed and
quantified by recognizing the features of pathological tissues automatically and easily, it
will not only assist evaluation by conventional microscopy, but also significantly
revolutionize conventional pathological evaluation. In the future, we expect that many users
will verify and utilize image processing software, including HALO, to make quantitative
evaluation of pathological tissue a versatile and useful method.
Potential Conflicts of Interest
All authors are employees of Mitsubishi Tanabe Pharma Corporation. The authors declare that
they have no conflicts of interest.
Acknowledgments
The authors thank Tetsuhiro Kakimoto, Masaharu Tanaka, Atsushi Fukunari, Hiroyuki Utsumi,
Yuri Fujimoto, and Yoko Takada for supporting the present study and helpful discussions.
References
- 1. Klopfleisch,
R.
2013. Multiparametric and semiquantitative scoring systems for
the evaluation of mouse model histopathology-a systematic review.
BMC Vet. Res.
9: 123.
- 2. Kwak, J.
T., Hewitt,
S. M.,
Kajdacsy-Balla, A.
A., Sinha,
S. and
Bhargava,
R.
2016. Automated prostate tissue referencing for cancer
detection and diagnosis. BMC
Bioinformatics
17: 227.
- 3. Atupelage,
C.,
Nagahashi,
H., Kimura,
F.,
Yamaguchi,
M., Tokiya,
A.,
Hashiguchi,
A. and
Sakamoto,
M.
2014. Computational hepatocellular carcinoma tumor grading
based on cell nuclei classification. J. Med. Imaging
(Bellingham)
1: 034501.
- 4. Kakimoto,
T., Kimata,
H.,
Iwasaki, S.,
Fukunari,
A. and
Utsumi,
H.
2013. Automated recognition and quantification of pancreatic
islets in Zucker diabetic fatty rats treated with exendin-4.
J. Endocrinol.
216: 13–20.
- 5. Kakimoto,
T., Okada,
K.,
Hirohashi,
Y., Relator,
R., Kawai,
M., Iguchi,
T.,
Fujitaka,
K., Nishio,
M., Kato,
T.,
Fukunari,
A. and
Utsumi,
H.
2014. Automated image analysis of a glomerular injury marker
desmin in spontaneously diabetic Torii rats treated with losartan.
J. Endocrinol.
222: 43–51.
- 6. Kato,
T., Relator,
R., Ngouv,
H.,
Hirohashi,
Y., Takaki,
O.,
Kakimoto,
T. and Okada,
K.
2015. Segmental HOG: new descriptor for glomerulus detection
in kidney microscopy image. BMC
Bioinformatics
16: 316.
- 7. Horai,
Y., Kakimoto,
T.,
Takemoto,
K. and
Tanaka,
M.
2017. Quantitative analysis of histopathological findings
using image processing software. J. Toxicol.
Pathol.
30: 351–358.
- 8. Horai,
Y., Mizukawa,
M.,
Nishina, H.,
Nishikawa,
S., Ono,
Y.,
Takemoto,
K. and Baba,
N.
2019. Quantification of histopathological findings using a
novel image analysis platform. J. Toxicol.
Pathol.
32: 319–327.
- 9. Yoshida,
H.,
Shimazu, T.,
Kiyuna, T.,
Marugame,
A.,
Yamashita,
Y., Cosatto,
E.,
Taniguchi,
H., Sekine,
S. and
Ochiai,
A.
2018. Automated histological classification of whole-slide
images of gastric biopsy specimens. Gastric
Cancer
21: 249–257.
- 10. Yoshida,
H.,
Yamashita,
Y., Shimazu,
T.,
Cosatto, E.,
Kiyuna, T.,
Taniguchi,
H., Sekine,
S. and
Ochiai,
A.
2017. Automated histological classification of whole slide
images of colorectal biopsy specimens.
Oncotarget
8: 90719–90729.
- 11. Yamamoto,
Y., Offord,
C. P.,
Kimura, G.,
Kuribayashi,
S., Takeda,
H.,
Tsuchiya,
S., Shimojo,
H., Kanno,
H., Bozic,
I., Nowak,
M. A.,
Bajzer, Ž.
and Dingli,
D.
2016. Tumour and immune cell dynamics explain the PSA bounce
after prostate cancer brachytherapy. Br. J.
Cancer
115: 195–202.
- 12. Horai,
Y., Utsumi,
H., Ono,
Y.,
Kishimoto,
T., Ono,
Y. and
Fukunari,
A.
2016. Pathological characterization and morphometric analysis
of hepatic lesions in SHRSP5/Dmcr, an experimental non-alcoholic steatohepatitis model,
induced by high-fat and high-cholesterol diet. Int. J.
Exp. Pathol.
97: 75–85.
- 13. Lieberman, A.
P., Yu,
Z., Murray,
S.,
Peralta, R.,
Low, A.,
Guo, S.,
Yu, X. X.,
Cortes, C.
J., Bennett,
C. F.,
Monia, B.
P., La Spada,
A. R. and
Hung,
G.
2014. Peripheral androgen receptor gene suppression rescues
disease in mouse models of spinal and bulbar muscular atrophy.
Cell Rep.
7: 774–784.
- 14. Ascierto, M.
L., Makohon-Moore,
A., Lipson,
E. J.,
Taube, J.
M., McMiller,
T. L.,
Berger, A.
E., Fan,
J.,
Kaunitz, G.
J., Cottrell,
T. R.,
Kohutek, Z.
A., Favorov,
A.,
Makarov, V.,
Riaz, N.,
Chan, T.
A., Cope,
L., Hruban,
R. H.,
Pardoll, D.
M., Taylor,
B. S.,
Solit, D.
B., Iacobuzio-Donahue,
C. A. and
Topalian, S.
L.
2017. Transcriptional mechanisms of resistance to anti-PD-1
therapy. Clin. Cancer Res.
23: 3168–3180.
- 15. Karumuthil-Melethil,
S.,
Marshall, M.
S., Heindel,
C.,
Jakubauskas,
B.,
Bongarzone, E.
R. and Gray,
S. J.
2016. Intrathecal administration of AAV/GALC vectors in
10-11-day-old twitcher mice improves survival and is enhanced by bone marrow
transplant. J. Neurosci. Res.
94: 1138–1151.
- 16. Canesin,
G.,
Evans-Axelsson,
S., Hellsten,
R.,
Krzyzanowska,
A., Prasad,
C. P.,
Bjartell,
A. and
Andersson,
T.
2017. Treatment with the WNT5A-mimicking peptide Foxy-5
effectively reduces the metastatic spread of WNT5A-low prostate cancer cells in an
orthotopic mouse model. PLoS One
12: e0184418.
- 17. O’Rourke, D.
M., Nasrallah,
M. P.,
Desai, A.,
Melenhorst, J.
J., Mansfield,
K.,
Morrissette, J. J.
D., Martinez-Lage,
M., Brem,
S.,
Maloney, E.,
Shen, A.,
Isaacs, R.,
Mohan, S.,
Plesa, G.,
Lacey, S.
F., Navenot,
J. M.,
Zheng, Z.,
Levine, B.
L., Okada,
H., June,
C. H.,
Brogdon, J.
L. and Maus,
M. V.
2017. A single dose of peripherally infused EGFRvIII-directed
CAR T cells mediates antigen loss and induces adaptive resistance in patients with
recurrent glioblastoma. Sci. Transl.
Med.
9: eaaa0984.
- 18. Van
Cutsem, E.,
Bang, Y.
J., Mansoor,
W., Petty,
R. D.,
Chao, Y.,
Cunningham,
D., Ferry,
D. R.,
Smith, N.
R., Frewer,
P.,
Ratnayake,
J., Stockman,
P. K.,
Kilgour, E.
and Landers,
D.
2017. A randomized, open-label study of the efficacy and
safety of AZD4547 monotherapy versus paclitaxel for the treatment of advanced gastric
adenocarcinoma with FGFR2 polysomy or gene amplification.
Ann. Oncol.
28: 1316–1324.
- 19. Hagiya, A.
S., Etman,
A.,
Siddiqi, I.
N., Cen,
S., Matcuk,
G. R.
Jr., Brynes,
R. K. and
Salama, M.
E.
2018. Digital image analysis agrees with visual estimates of
adult bone marrow trephine biopsy cellularity. Int. J.
Lab. Hematol.
40: 209–214.
- 20. Guntermann,
C., Piaia,
A., Hamel,
M. L.,
Theil, D.,
Rubic-Schneider,
T., Del
Rio-Espinola, A.,
Dong, L.,
Billich,
A., Kaupmann,
K., Dawson,
J.,
Hoegenauer,
K., Orain,
D.,
Hintermann,
S., Stringer,
R., Patel,
D. D.,
Doelemeyer,
A., Deurinck,
M. and
Schümann,
J.
2017. Retinoic-acid-orphan-receptor-C inhibition suppresses
Th17 cells and induces thymic aberrations. JCI
Insight
2: e91127.
- 21. Kleiner, D.
E., Brunt,
E. M., Van
Natta, M.,
Behling,
C., Contos,
M. J.,
Cummings, O.
W., Ferrell,
L. D., Liu,
Y. C.,
Torbenson, M.
S., Unalp-Arida,
A., Yeh,
M.,
McCullough, A.
J., Sanyal,
A. J.,
Nonalcoholic Steatohepatitis Clinical Research Network.
2005. Design and validation of a histological scoring system
for nonalcoholic fatty liver disease.
Hepatology
41: 1313–1321.
- 22. Brunt, E.
M., Janney,
C. G., Di
Bisceglie, A. M.,
Neuschwander-Tetri, B.
A. and Bacon,
B. R.
1999. Nonalcoholic steatohepatitis: a proposal for grading and
staging the histological lesions. Am. J.
Gastroenterol.
94: 2467–2474.
- 23. Hotta,
K., Sho,
M., Yamato,
I.,
Shimada, K.,
Harada, H.,
Akahori,
T., Nakamura,
S.,
Konishi, N.,
Yagita, H.,
Nonomura,
K. and
Nakajima,
Y.
2011. Direct targeting of fibroblast growth factor-inducible
14 protein protects against renal ischemia reperfusion injury.
Kidney Int.
79: 179–188.
- 24. Dunnill, M.
S.
1962. Quantitative methods in the study of pulmonary
pathology. Thorax
17: 320–328.
- 25. Ashcroft,
T.,
Simpson, J.
M. and Timbrell,
V.
1988. Simple method of estimating severity of pulmonary
fibrosis on a numerical scale. J. Clin.
Pathol.
41: 467–470.
- 26. Hübner, R.
H., Gitter,
W., El
Mokhtari, N. E.,
Mathiak,
M., Both,
M., Bolte,
H.,
Freitag-Wolf,
S. and Bewig,
B.
2008. Standardized quantification of pulmonary fibrosis in
histological samples. Biotechniques
44: 507–511, 514–517.
- 27. Gilhodes, J.
C., Julé,
Y., Kreuz,
S.,
Stierstorfer,
B., Stiller,
D., Wollin,
L.
2017. Quantification of pulmonary fibrosis in a bleomycin
mouse model using automated histological image nalysis.
PLoS One. 12:
e0170561.
- 28. Seger,
S., Stritt,
M.,
Vezzali, E.,
Nayler, O.,
Hess, P.,
Groenen,
PMA.,
Stalder, A.
K.
2018. A fully automated image analysis method to quantify lung
fibrosis in the bleomycin induced rat model. PLoS
One. 16: e0193057.
- 29. Chen, H.
C. and Farese,
R. V.
Jr. 2002.
Determination of adipocyte size by computer image
analysis. J. Lipid Res.
43: 986–989.