Experimental Animal
Autonomic nervous activity in rats can be evaluated by blood photoplethysmography-derived pulse rate variability analysis
2021 Volume 3 Issue 1 Pages 17-21
Details
2021 Volume 3 Issue 1 Pages 17-21
In humans, pulse rate variability (PRV) obtained from pulse waves (PWs) is utilized to assess cardiac autonomic nervous function which normally heart rate variability (HRV) obtained from inter-beat (RR) intervals of an electrocardiogram (ECG) recording represents. However, the acceptability of PRV as an index of autonomic function in rats has not been evaluated and, therefore, was the aim of the present study. PW and ECG waveforms of normotensive Sprague Dawley (SD) rats and Spontaneously Hypertensive Rats (SHR) were recorded using photoplethysmography of the tail and radiotelemetry. The frequency component in a series of intervals between the maximum points of the second derivative photoplethysmography waveform or between the RR intervals of the ECG waveform was analyzed using the Cooley–Tukey fast Fourier transform algorithm and the correlativity of the low frequency (LF) power, high-frequency (HF) power, and LF/HF ratio were determined. The R-values for the coefficients of determination between parameters from HRV and PRV were above 0.98 in both normotensive and hypertensive rats, indicating that these two analyses provide the same results. Our findings suggest that the PRV method may be an alternative to HRV in rats with hypertension to effectively evaluate autonomic nerve function in drug discovery research. Since oscillometric tail-cuff BP analyses in rats are commonly used in pharmaceutical research, the PRV would provide additional valuable information on cardiac autonomic nervous function during the evaluation of drug efficacy and safety.
● Frequency analysis of photoplethysmography-derived pulse rates in rats, revealed similar peaks in the HF and LF regions in power spectrum waveforms as those demonstrated in frequency analyses of the RR interval using radiotelemetric ECG recording.
● HF, LF, and LF/HF calculated from PRV and HRV showed high correlations, with R-values of the coefficients of determination of ≥0.98 in both normotensive and hypertensive rats.
● These findings suggested that PRV analysis obtained from the PW waveform in rats can be an index of autonomic nervous function as well as HRV analysis obtained from the ECG and may be an efficient method for the evaluation of autonomic nerve function in drug discovery research.
Heart rate variability (HRV) obtained from the inter-beat (RR) intervals of electrocardiogram (ECG) recordings is a useful method to assess cardiac autonomic nervous function [1]. HRV has been used as an index for sympathovagal interactions in many animal species, including rats, mice, guinea pigs, rabbits, dogs, pigs, cattle, horses, and humans [2,3,4,5,6,7,8,9,10,11]. Furthermore, frequency analysis of human blood pressure (BP) waveforms reveals frequency peaks common to HRV can. The low-frequency (LF) peak is reflected mainly by the sympathetic vasomotor [12], while the high-frequency (HF) peak is reflected mainly by the mechanical effects of respiration [13]. In human clinical practice, the analysis of BP variability and pulse rate variability (PRV) is used as an index for autonomic nervous activity [14,15,16,17,18,19,20].
In general, the ECG evaluation of rats and mice tends not to be emphasized in the research and development of human medicines due to species differences in ion channel expression in the myocardium. For example, the International Council for Harmonisation of Technical Requirements for Pharmaceuticals for Human Use (ICH) S7B guidelines do not recommend the use of rats and mice in cardiac safety pharmacology studies [21]. In comparison, BP evaluation tests using rats and mice are widely conducted in the evaluations of drug efficiency and pharmacological safety. Moreover, although differences in channel expression are thought to affect RR intervals, autonomic nervous function can be evaluated using HRV analysis in rats by analyzing appropriate frequency bands [22]. Thus, the evaluation of both autonomic nervous function and BP measurements in rats and mice would allow a more effective evaluation of drug effects and toxicity in the autonomic nervous system. In particular, the demonstration of comparable results between PRV analysis using photoplethysmography with the oscillometric tail-cuff method and HRV analysis using the ‘invasive’ radiotelemetry method would allow a more efficient, high-throughput analysis of autonomic nervous function without surgery. However, only one report in rabbits [10] has addressed this topic in small experimental animals and the acceptability of PRV as an alternate method for HRV has not been evaluated in rats. Therefore, the present study evaluated the concordance and utility of PRV using photoplethysmography-derived PW analysis compared to HRV using radiotelemetry ECG analysis in normotensive rats (Sprague Dawley) and hypertensive rats (Spontaneously Hypertensive Rats).
This study included six normotensive rats, Crl:CD (SD) (male, retired, 500–750 g, Charles River Laboratories Japan, Inc., Yokohama, Japan), and three hypertensive rats, SHR/NCrlCrlj (male, 3–4 months of age, Charles River Laboratories Japan, Inc., Yokohama, Japan). The rats were housed in a temperature-controlled room (24°C) under automatically controlled lighting (light on for 12 hr) and provided food (MF, Oriental Yeast Co., Ltd., Tokyo, Japan) and water ad libitum. All experiments using rats were conducted under the Animal Experimentation Guidelines of The University of Tokyo and were approved by the Institutional Animal Care and Use Committee of the Graduate School of Agricultural and Life Sciences at The University of Tokyo.
Experimental preparation and measurementsA small telemetry device (Softron, Tokyo, Japan) for transmitting ECG data was implanted into the dorsal subcutaneous region under systemic inhalation anesthesia with isoflurane. Paired-wire electrodes included with the telemetry device were placed under the skin of the dorsal and ventral thorax to record the apex-base (A-B) lead ECG. After more than a week recovery period, ECG signals were recorded from the signal-receiving board (Softron). ECG data were continuously sampled at 1-ms intervals and the ECG waveforms were recorded using an ECG processor and analyzing software (SRV2, Softron) on a personal computer in series with an analog-digital converter. The ECG data were stored on an external hard disk. The frequency component of the variability of the R-wave interval on ECG (HRV) was analyzed. Data sets comprising 512 points were resampled at 100 msec and more than 60 data sets with 4-sec shifts were applied to the Hamming window to obtain the power spectrum of fluctuation based on the Cooley–Tukey fast Fourier transform algorithm [23]. Two major spectral components, LF (0.04–1.0 Hz) and HF (1.0–3.0 Hz) power, were detected. The HF power was then used as an index of parasympathetic nervous activity while the LF power was used as an index reflecting both sympathetic and parasympathetic activity. Finally, the LF/HF ratio was used as an index of the balance between sympathetic and parasympathetic nervous activities [22].
Concurrently, BP and PW were measured for 5–10 min using a tail-cuff apparatus (BP98AL, Softron). The rats were placed in a net holder ringed with a temperature controller (37°C) and caudal arterial pressure was measured using an oscillometric cuff connected to the apparatus set at the ridge of the tail. Details of the tail-cuff BP measurements are described elsewhere [24]. For the pulse interval determination, the tail was pressurized to 60 mmHg and changes in vascular volume were detected as photoplethysmography-derived PW using infrared light-emitting diodes at 1-msec intervals. The interval between each maximum point of the second derivative photoplethysmography waveform and the frequency component of the interval (PRV) were then analyzed in the same manner as for HRV.
Statistical analysisAll data were analyzed using Office 365 Excel 2101 (Microsoft Corp.). Data are shown as means ± standard deviation. The correlations between the power values of HRV and PRV index (HF, LF, and LF/HF) were analyzed using Pearson’s product-moment correlation coefficients. The significance level was set at <5%.
The average heart rates were 349.1 ± 41.4 bpm in the SD rats and 385.6 ± 18.9 bpm in the SHRs. The systolic, diastolic, and mean BPs were 125.1 ± 10.5 mmHg, 102.1 ± 12.2 mmHg, and 109.8 ± 11.2 mmHg, respectively, in the SD rats, and 199.1 ± 5.8 mmHg, 159.0 ± 5.8 mmHg, and 172.3 ± 1.9 mmHg, respectively, in the SHRs.
The frequency analyses of RR intervals obtained from the ECG waveform and pulse intervals obtained from the caudal artery PW showed similar peaks in the HF and LF regions in both analyses in SD rats and SHRs (Fig. 1). To examine the correlation between PRV and HRV, scatterplots of HF, LF, and LF/HF were drawn and the coefficients of determination were calculated. The coefficients of determination between the R-values obtained from the PRV and HRV were above 0.98 in both normotensive SD rats and SHRs, indicating a high correlation between PRV and HRV (Figs. 2 and 3). The points were nearly on the regression line, “Y=aX + b”, on the scatterplots, with R2 values of ≥0.96, indicating the high predictive performance of these regression formulas. Although the HF in SD rats tended to be higher in PRV and the LF/HF was lower, these findings suggest that the PRV method may be used as a substitute for HRV in normotensive and hypertensive conditions.
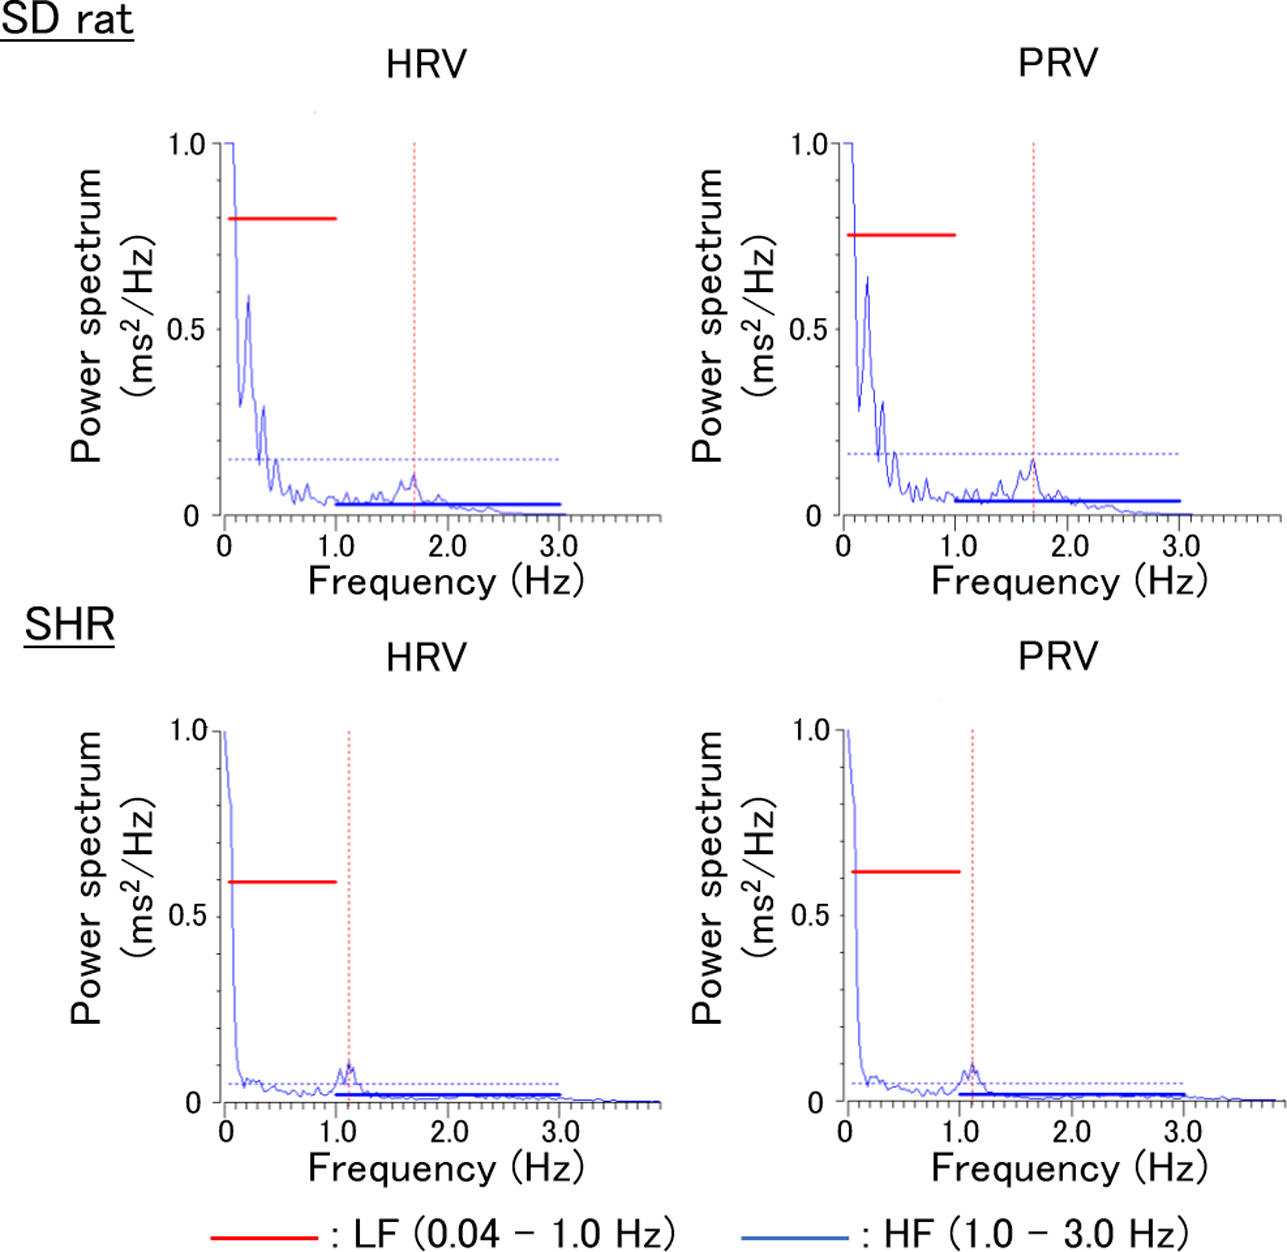
Typical power spectral densities of heart rate variability (HRV) and pulse rate variability (PRV) obtained from individual Sprague Dawley (SD) rat and Spontaneously Hypertensive Rat (SHR). HF, high frequency; LF, low frequency.

Scatterplots of high frequency (HF), low frequency (LF), and LF/HF obtained from both heart rate variability (HRV) and pulse rate variability (PRV) analyses in Sprague Dawley (SD) rats.

Scatterplots of high frequency (HF), low frequency (LF), and LF/HF obtained from both heart rate variability (HRV) and pulse rate variability (PRV) analyses in Spontaneously Hypertensive Rats (SHRs).
In hypertensive conditions, arterial stiffness can be affected by both structural and functional changes [25]. These changes affect PW velocity; therefore, we analyzed PRV in SHRs. The results were considered to be preliminary as only three SHRs were analyzed in this study; however, the results suggested that PRV can predict autonomic nervous function in both normotensive and hypertensive rats, comparable to HRV. In SHRs, both HF and LF in PRV were almost the same as the HRV. Arterial stiffness indices could be measured using PW velocity and PW analysis in humans [26]. Therefore, there is a possibility that the decrease in elasticity in arteries associated with hypertension results in a decrease difference between PRV and HRV. Although elasticity changes with aging, the normotensive rats used in this study were retired. Thus, the relationship between arterial stiffness and PRV results requires further evaluation in future studies. Another limitation of this study was that the correlation between PRV and HRV was evaluated only in stable normotensive and hypertensive conditions based on short-term PW and ECG recordings, without evaluating the effects of drug-induced transient BP change on PRV. Therefore, the evaluation of the correlations between PRV and HRV during dramatic drug-induced BP changes in future studies may provide more detailed information on the equivalence of PRV and HRV. Another limitation was the restraint and warming of animals in the tail-cuff method. The rats were held in a warm tube, which may have stressed them. To eliminate the effects of restraint and heat stress, it is better to use telemetry devices to obtain the BP waveform. However, implantation of telemetry devices for BP recording requires advanced techniques, as well as surgery and telemetry studies, lack throughput in drug discovery research. The tail-cuff method can be used in preliminary screening studies to allow high throughput in the early stages of drug discovery.
The main receptors expressed in the autonomic nervous system are classically divided into α and β for adrenaline, and muscarine and nicotine for acetylcholine. There are several subtypes of α-and β-adrenaline receptors, muscarine receptors, and nicotine receptors, the components of which can be further subdivided into subunits. However, in drug safety and general pharmacological tests, it is practically difficult to examine the effects of test compounds on each receptor, including subtypes and subunits in various tissues and organs. In addition, experiments using tracers, such as receptor binding studies, cannot be easily performed everywhere. Moreover, when examining the effects of drugs on the autonomic nervous system, the range required is too wide and it is not easy to comprehensively investigate in detail. Studies in which screening can be performed widely in vivo are useful for improving the efficiency of drug discovery. The high-throughput evaluation of autonomic nervous function in rats, which are widely used for safety pharmacology and general pharmacology evaluations, will improve the efficiency of drug discovery research. The results of this study suggest that the PRV analysis obtained from the PW waveform in rats can be used as an index of autonomic nervous function, comparable to HRV analysis obtained from the ECG. It is considered that an efficient evaluation of the effect on the autonomic nervous system will be possible by examining the effect on the autonomic nervous system using PRV and conducting a more detailed examination if there is any effect there.
Hidetoshi KOBAYASHI is part of Softron Co., Ltd., which is the vendor of the instruments used for PW and ECG waveform, and BP analysis in this study.