Abstract
Estrogen affects mitochondrial function in various tissues, but the precise mechanism remains unclear. We, therefore investigated the effect on estrogen-regulated mitochondrial morphology by dynamin-related protein 1 (Drp1) and its Ser616-phosphorylated derivative (pDrp1Ser616) are involved in mitochondrial fission. MCF7 human breast cancer cells were treated with 17β-estradiol (E2), an estrogen receptor (ER) α and β antagonist (ICI 182, 780), an ERα antagonist (MPP), and an ERβ antagonist (PHTPP) for 24 hr. The expression of Drp1 and pDrp1Ser616 was analyzed by western blotting and immunohistochemistry. Mitochondrial morphology was analyzed by transmission electron microscopy (TEM). In control cells, Drp1 was detected in the cytoplasm of all cells while pDrp1 was observed in the cytoplasm of 3.4 ± 1.0% of the total population. After E2 treatment, pDrp1Ser616-positive cells comprised 30.6 ± 5.6% of the total population, 10.5 ± 1.7% after E2 + ICI treatment, 12.4 ± 4.2% after E2 + MPP treatment, and 24.0 ± 2.2% after E2 + PHTPP treatment. In ERα knockdown MCF7 cells, pDrp1 expression was decreased after E2 treatment compared to E2-treated wild type cells. Tubular pattern mitochondria were found in the control cells but the number of short and small pattern mitochondria (< 0.5 μm2) was significantly increased after E2 treatment (as observed by TEM). We, therefore concluded that the phosphorylation of Drp1 is important for E2-dependent mitochondrial morphological changes through ERα.
I. Introduction
Breast cancer is the most common cancer in women and one of the leading causes of cancer death worldwide. Despite advances in early detection and curative treatment, breast cancer prevalence and mortality continue to increase globally [15, 22]. Estrogen is a sex hormone responsible for the development of female sexual characteristics and is an important etiological factor for the development and progression of breast cancer. The biological effects of estrogen are mediated through estrogen receptors (ER) α and β, which are members of a large superfamily of nuclear receptors and membrane-bound G protein-coupled estrogen receptor 1 (GPER1) [10, 12, 21, 41].
Estrogen also has direct and indirect effects on mitochondrial structure and biogenesis which are intermediated by the genomic and membrane-initiated activities of receptors [4, 20, 32]. 17β-Estradiol (E2) was reported to transform breast cancer cells into secretory cells containing large, clear mitochondria with well-defined cristae formation. These effects occurred in ER-positive cell lines, including MCF7, but not in ER-negative cells, suggesting that the effects of E2 on mitochondrial ultrastructure are mediated through ER [40]. The role of estrogen and ERα in the preservation and regulation of mitochondrial structure and function were revealed in rat and mice myocytes [46], in mice ovarian interstitial cells [37], and in the brown adipose tissue of rats [16, 17, 30]. These reports suggested that estrogen regulates cellular functions by modifying mitochondrial morphology, although the precise mechanism remains unclear.
Mitochondrial morphology is dynamic and is controlled by balancing continuous fission and fusion events. In mammals, the core mitochondrial fusion machinery consists of dynamin-related GTPases optic atrophy 1 in the inner mitochondrial membrane and mitofusins 1 and 2 in the outer mitochondrial membrane. Mitochondrial fusion is required to recover the activities of damaged mitochondria, while fission is necessary for the correct redistribution of mitochondrial DNA during cell division and for transporting mitochondria to daughter cells during mitosis and meiosis [11, 23–25, 34]. Mitochondrial fission requires the recruitment of dynamin-related protein 1 (Drp1) from the cytoplasm to the outer mitochondrial membrane and Drp1 assembles into fission foci. Mitochondrial fission is regulated by post-translational modifications of Drp1: phosphorylation, ubiquitination, SUMOrylation, and S-nitrosylation [7, 14, 26, 28, 45]. Drp1 phosphorylation is initiated at several sites and thus is involved in different mechanisms of various pathological processes. In general, phosphorylation at Ser616 induces Drp1 activity while phosphorylation at Ser637 inhibits Drp1 activity. Upregulation of Drp1 and phosphorylation at Ser616 are related to cancer progression in breast cancer, lung adenocarcinoma and pancreatic cancer [38]. Currently, the role of Drp1 in hormone-dependent malignant tumors is unclear and its detailed regulatory mechanisms remain to be determined.
We, therefore, aimed to evaluate the possible mechanism of estrogen-regulated mitochondrial structure, focusing on Drp1 phosphorylation, in MCF7 human breast cancer cells proliferation. To address this aim, cell proliferation was determined by the MTT assay after treatment with E2 or E2 plus ER antagonists. Drp1 phosphorylation was determined at the Ser616 position by western blot and immunohistochemistry, and mitochondrial morphology was determined by transmission electron microscopy (TEM).
II. Materials and Methods
Cell culture
MCF7 human breast cancer cells were from RIKEN Cell Bank (Ibaraki, Japan). Cells were cultivated routinely in Dulbecco’s Modified Eagle’s Medium (DMEM, Gibco, Thermo Fisher Scientific Inc., Waltham, MA, USA) supplemented with 10% (v/v) heat-inactivated fetal bovine serum (FBS, Hyclone, GE Healthcare Life Sciences, Logan, UT, USA), 100 μg/ml of streptomycin sulfate, 70 μg/ml of benzylpenicillin potassium, 3 mg/ml of sodium hydrogen carbonate and 0.5 M L-glutamine solution in a humidified chamber (5% CO2, 37°C) (Wako Pure Chemical Industries, Ltd., Osaka, Japan). Cells were grown for five days to 80% confluence and then trypsinated using a 10% dilution of 0.5% trypsin-EDTA mixture in phosphate buffer saline (PBS) without magnesium and calcium.
Estrogen and estrogen receptor (ER) antagonist treatment
Prior to treatment with estrogen or ER antagonists, MCF7 cells were cultured in phenol-red-free DMEM (Gibco, Thermo Fisher Scientific Inc., Waltham, MA, USA) with 10% dextran-coated charcoal-treated FBS (DCC-treated FBS) overnight, then, the cells were cultured in serum-free, phenol-red-free DMEM overnight. Cells maintained in medium containing 10% DCC-treated FBS and no added hormone are referred to as control cells. Other cells were treated with various doses of E2 (0.001, 0.01, 0.1, 1 and 10 μM) (Sigma Chemical Co., St. Louis, MO, USA) for different durations (4 hr, 8 hr, 12 hr, 24 hr and 48 hr). For pretreatment with ER antagonists, ICI (1 μM, Sigma Chemical Co., St. Louis, MO, USA), 1,3-bis(4-hydroxyphenyl)-4-methyl-5-[4-(2-piperidinylethoxy) phenol]-1H-pyrazole dihydrochlorid (MPP, 10 μM, Tocris Bioscience, Bristol, UK) or 2-phenyl-3-(4-hydroxyphenyl)-5, 7-bis(trifluoromethyl)-pyrazolo[1,5-a] pyrimidine, 4-[2-Phenyl-5,7-bis(trifluoromethyl)pyrazolo[1,5-a]-pyrimidin-3-yl] phenol (PHTPP, 10 μM, Abcam, Cambridge, UK) were added 2 hr prior to E2 treatment to ensure degradation of the ER.
Cell proliferation assay
Cell proliferation was determined by the MTT assay (3-(4,5-dimethythiazol2-yl)-2,5-diphenyl tetrazolium bromide, Wako Pure Chemical Industries, Ltd., Osaka, Japan). Cells were seeded in 96-well plates at a density of 4000 cells/well. Cells were treated with 0.001% EtOH as control and 0.01 μM E2 with or without 1 μM ICI for 12 hr to 48 hr, then 10 μl MTT solution was added to each well and the cells were incubated at 37°C for 2 hr. Dimethyl sulfoxide (DMSO) was used to dissolve the formazan crystals and the resulting intracellular purple formazan was quantified with a spectrophotometer at an absorbance of 562 nm (Immuno Mini NJ-2300; Nalge Nunc Int. Co. Ltd., Tokyo, Japan).
Antibodies
Rabbit monoclonal antibodies against Drp1 (D6C7; 5 μg/ml) and pDrp1Ser616 (D9A1; 1 μg/ml) were from Cell Signaling Technology (Boston, MA, USA). Mouse monoclonal antibody against ERα (6F11, 6.7 μg/ml), goat-anti-rabbit conjugated Alexa Fluor® 488 and goat-anti-mouse conjugated Alexa Fluor® 546 were from Thermo Fisher Scientific, Inc. (Pittsburgh, PA, USA). Polyclonal antibodies against ERβ were prepared by the immunization of rabbits against synthetic peptides in cooperation with Scrum Inc. (Tokyo, Japan). To generate anti-ERβ antibody, we selected a synthetic oligopeptide sequence (CSTEDSKSKEGSQNLQSQ) corresponding to the N-terminal amino acid residues (No. 468–485) of human ERβ. Mouse monoclonal antibody against β-actin (AC-15; dilution 1:200,000) and normal goat IgG were from Sigma. Normal mouse IgG, normal rabbit IgG, horseradish peroxidase (HRP)-goat anti-mouse IgG (dilution 1:1000) and HRP-goat anti-rabbit IgG (dilution 1:1000) were from Dako (Glostrup, Denmark). 4',6-Diamidino-2-phenylindole (DAPI) was from SouthernBiotech (Birmingham, AL, USA).
Western blot analysis
Western blot analysis was performed as previously reported [2]. In brief, cells were seeded in 6 cm plates at a density of 0.8 × 10⁶ cells/well. After incubating the cells with various doses of E2 (0.001, 0.01, 0.1, 1 and 10 μM) for various durations (4 hr, 8 hr, 12 hr, 24 hr and 48 hr), total cell lysates were prepared using hot SDS solution comprising 0.9% SDS, 15 mM EDTA, 8 mM unlabeled methionine and a protease inhibitor cocktail. Following incubation at 100°C for 10 min, the samples were cooled, diluted to 0.3% SDS, then final concentrations of 33 mM Tris/acetate, pH 8.5 and 1.7% Triton X-100 were added. Lysate containing 10 μg of protein was mixed with loading solution [0.2 M Tris-HCL (pH 8.0), 0.5 M sucrose, 5 mM EDTA, 0.01% bromophenol blue, 10% 2-mercaptoethanol, and 2.5% SDS], boiled for 5 min, separated by sodium dodecyl sulfate-polyacrylamide gel electrophoresis (SDS-PAGE, Wako Pure Chemical Industries, Ltd., Osaka, Japan) on an 8% polyacrylamide gel, and electrophoretically transferred onto Polyvinylindene fluoride membrane (PVDF, Millipore, Bedford, MA, USA). The membranes were blocked with 5% nonfat milk in Tris-buffered saline with 0.1% Tween 20 (TBST; 20 mM Tris buffer, pH 7.6 and 150 mM NaCl) for 1 hr at room temperature and then incubated overnight with rabbit monoclonal antibody anti-Drp1 (dilution 1:500), anti-pDrp1 (dilution 1:1000), mouse monoclonal antibody anti-ERα (dilution 1:1000) and rabbit polyclonal antibody anti-ERβ (dilution 1:500) in Immunoreaction Enhancer Solution 1 (Can Get Signal®, Toyobo Co., Ltd., Osaka, Japan). The membranes were washed with TBST and incubated further with HRP-conjugated secondary antibodies (dilution 1:1000). Protein bands were detected using an enhanced ECL kit (GE Healthcare, Tokyo, Japan) using a digital imaging system (LAS4000, Fujifilm, Tokyo, Japan). Bands were measured using ImageJ (Version 1.51n, NIH Software, Bethesda, MD, USA).
Immunohistochemistry
Immunohistochemistry was performed as reported previously [2, 39]. Briefly, cells were seeded on coverslips in 12-well plates at a density of 1 × 10⁵ cells/well. Following the incubation of cells with E2 or E2 + ER antagonists for 24 hr, the cells were incubated with 200 nM MitoTracker® Red CMXRos (Waltham, MA, USA) for 30 min at 37°C in an incubator, then fixed and permeabilized with 4% paraformaldehyde (Merck Millipore, Darmstadt, Germany) in PBS for 20 min at room temperature and then 0.2% Triton X-100 in PBS for 10 min. After washing with 1× PBS three times, the cells were pre-incubated with 500 μg/ml normal goat IgG and 1% bovine serum albumin (BSA, Merck Millipore, Darmstadt, Germany) in PBS for 1 hr to block non-specific binding sites. Unless otherwise specified, all reactions were conducted at room temperature. Cells were reacted with primary antibodies (Drp1, 5 μg/ml and pDrp1Ser616, 1 μg/ml) for 4 hr. ERα and pDrp1Ser616 were simultaneously detected by double-staining as described previously [2]. Briefly, after blocking with 10% normal goat serum in 1% BSA in PBS, the cells were incubated with primary antibodies (ERα, 6.7 μg/ml and pDrp1Ser616, 1 μg/ml) for 4 hr. After washing with 0.075% Brij L23 (Sigma Chemical Co., St. Louis, MO, USA) in PBS, the cells were incubated with goat-anti-rabbit conjugated Alexa Fluor® 488 (dilution 1:500) for 30 min and the nuclei were stained with 0.5 μg/ml DAPI (SouthernBiotech, Birmingham, AL, USA). Normal rabbit IgG was used at the same concentration instead of the primary antibodies for each experiment as negative controls. Finally, coverslips were mounted and examined under a confocal laser microscope (LSM 700; Carl Zeiss AG, Oberkochen, Germany). Images were captured at ×400 magnification.
Transfection of ERα siRNA by electroporation
A mixture of 21 bp siRNA for ERα (s4823 and s4824, Ambion by Life Technologies, Thermo Fisher Scientific, Inc., Pittsburgh, PA, USA) at a concentration of 5 nM was transfected into MCF7 cells. Electroporation cuvettes from Nepa Gene Co., Ltd. (Chiba, Japan) were used for all electroporations. Cells were suspended in 100 μl of Opti-MEM (Gibco, Tokyo, Japan) and 5 nM of ERα siRNA was added under sterile conditions. The cells were transferred to a sterile 2 mm cuvette and electroporated with two electric pulses (poring pulse: 125 V, 2.5 ms long with a 50 ms interval, transfer pulse: 20 V, 50 ms long with a 50 ms interval). After transfection, the cells were gently suspended in 3 ml of pre-warmed DMEM supplemented with 10% FBS.
Transmission electron microscopy (TEM)
Cells were seeded on coverslips in 12-well plates at a density of 1 × 10⁵ cells/well. After incubation with 0.001% EtOH as control or 0.01 μM E2, the cells were fixed in 2% paraformaldehyde and 2.5% glutaraldehyde in 0.1 M cacodylate buffer (pH 7.4) for 2 hr at 4°C, followed by washing with 0.1 M cacodylate buffer at 4°C. Post-fixation was conducted with 1% osmium tetroxide in 0.1 M cacodylate buffer for 2 hr at 4°C, followed by washing with 0.1 M cacodylate buffer. The cells were then dehydrated through a series of ethanol (EtOH) and propylene oxide solutions and embedded in Epon for 24 hr at 60°C. Ultra-thin sections were cut and stained with 0.5% uranyl acetate and 3% lead citrate at 20°C for 30 min and 7 min, respectively. The sections were observed using a transmission electron microscope (Hitachi HT7700, Hitachi High-Technologies Corporation, Tokyo, Japan), and the size of the mitochondria was measured using ImageJ version 1.51n, software.
Quantitative analysis
For immunohistochemistry, the percentage of pDrp1Ser616 positive cells were counted for clear confirmation. Slides were observed under ×200 magnification and digital pictures were taken. At least 2000 cells were counted and the percentage of pDrp1Ser616 positive cells was calculated in control, E2 +/− ICI, MPP, or PHTPP treated cells. For TEM, the electron microscopic images were taken under 2.0 k zoom and area of mitochondria were measured and analyzed using ImageJ software. At least 250 mitochondria were measured in five random cells per group.
Statistical analysis
All experiments were performed in triplicate. Data are expressed as mean ± standard error and the differences between the groups were analyzed by Student’s t-test with Statistical Package for the Social Sciences (Version 11.5; SPSS Inc., Chicago, IL, USA). P < 0.05 was considered statistically significant.
III. Results
Both ERα and ERβ were expressed in MCF7 cells
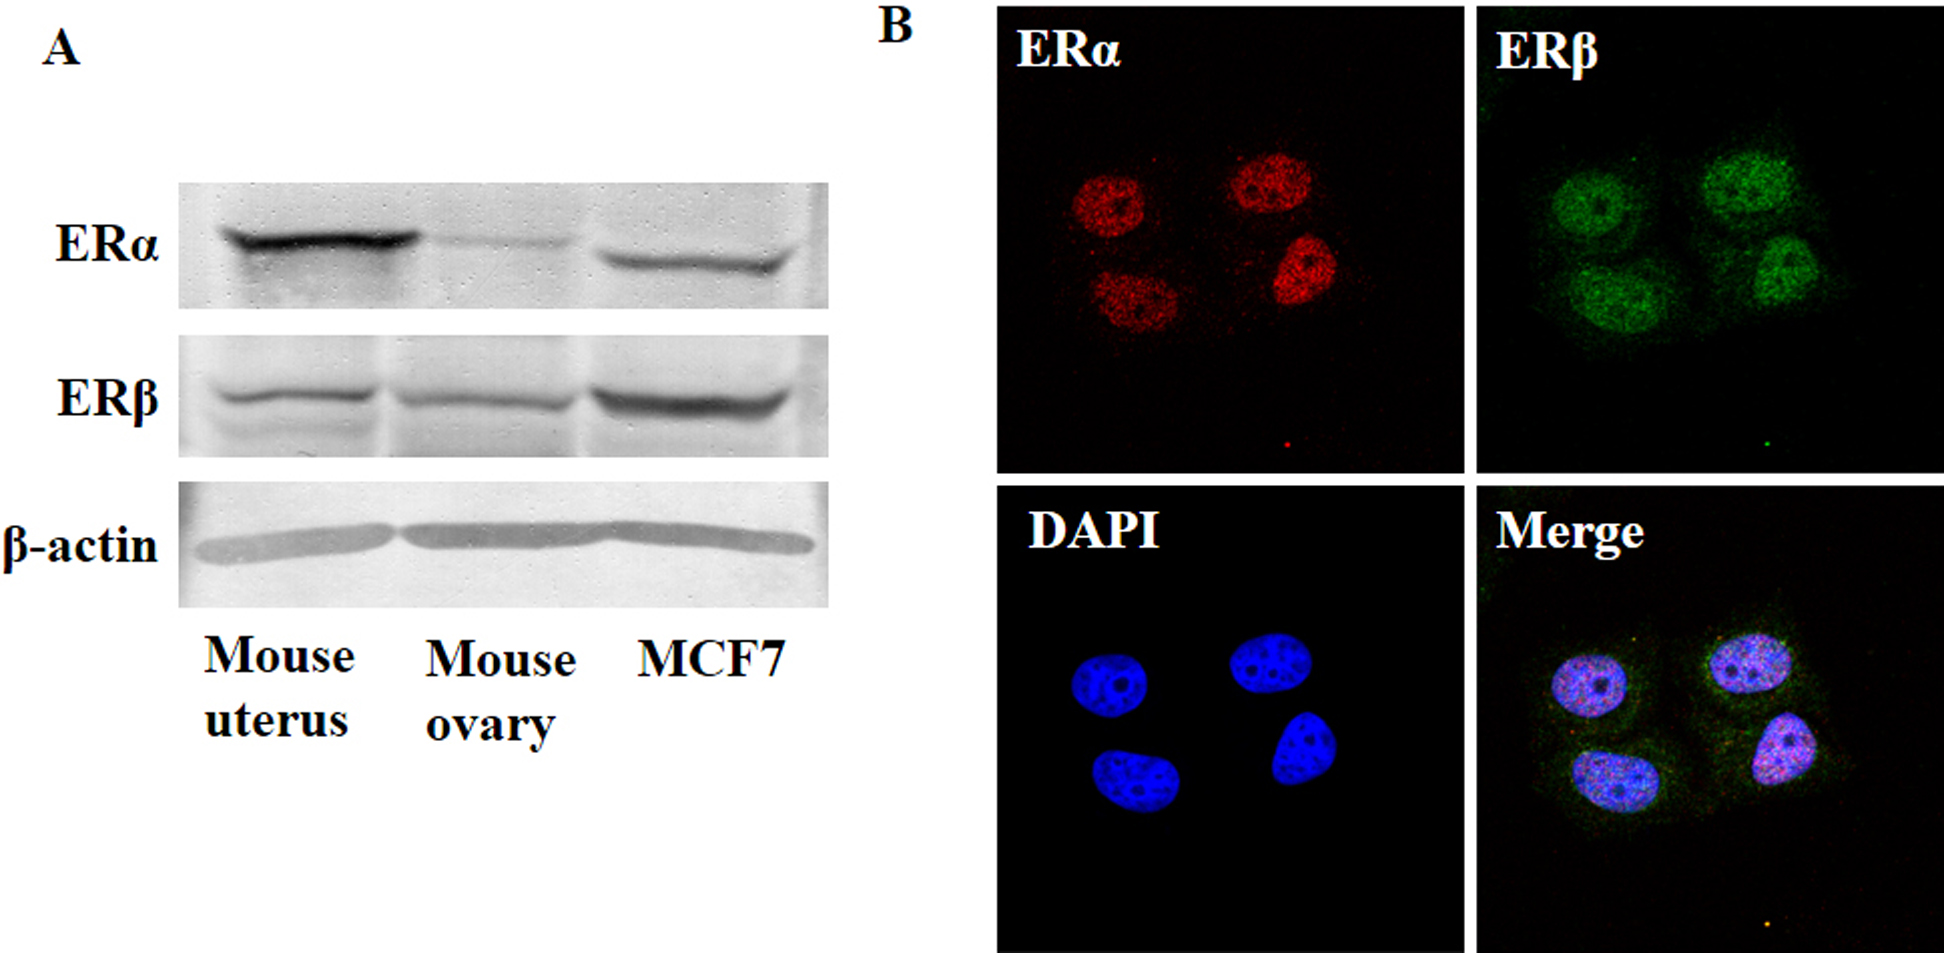
To clarify the expression and localization of ERα and ERβ in MCF7 cells, we performed western blotting and immunohistochemistry, respectively. Mouse uterus and ovary were used as positive controls in western blotting analysis. As shown in Fig. 1A, both ERα and ERβ were expressed in MCF7 cells. ERα and ERβ mainly expressed in the nucleus, but were sparsely expressed in the cytoplasm (Fig. 1B).
17β-Estradiol induced MCF7 cell proliferation
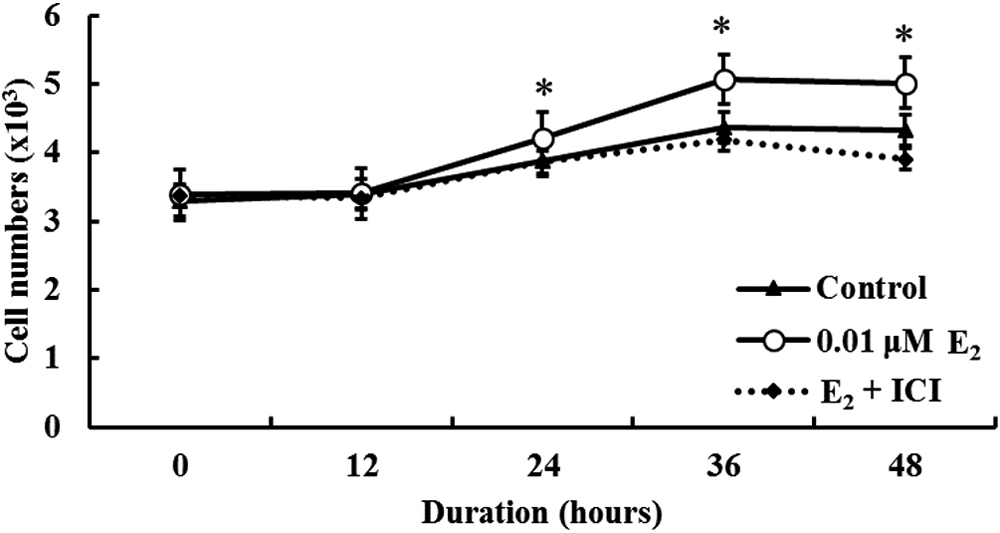
To verify the effects of E2 on MCF7 cell proliferation, an MTT assay was performed after incubation with E2 with or without ICI treatment. As shown in Fig. 2, cell proliferation was increased significantly by E2 treatment for 24 hr, but, cell proliferation was decreased by E2 + ICI treatment compared to E2 treatment alone.
17β-Estradiol induced pDrp1Ser616 in MCF7 cells
To determine the effects of E2 on Drp1 and pDrp1Ser616, the expression of Drp1 and pDrp1Ser616 was analyzed by western blotting. The results indicated that pDrp1Ser616 expression was increased significantly by E2 in a dose-dependent manner, but there was no significant change in Drp1 expression after E2 treatment (Fig. 3A, B and C). However, an E2 concentration of 0.01 μM was selected for further experiments as it is a physiologically relevant concentration for mammalian cells. We then examined the time-course effect of 0.01 μM E2 on both Drp1 and pDrp1Ser616 expression by western blotting. The results revealed that pDrp1Ser616 expression was significantly increased after E2 treatment for 24 hr, 36 hr and 48 hr whereas Drp1 expression was not changed significantly after E2 treatment (Fig. 3D, E and F).
ERα plays a major role in E2-induced Drp1 phosphorylation at Ser616
In order to determine the involvement of ERα and ERβ, cells were treated with a non-specific ER inhibitor (ICI 182,780, 1 μM), an ERα-specific inhibitor (MPP, 10 μM), or an ERβ-specific inhibitor (PHTPP, 10 μM) for 2 hr prior to E2 treatment. The expression of Drp1 and pDrp1Ser616 was examined by western blotting and immunohistochemistry. Western blotting revealed that pDrp1Ser616 expression was increased significantly by E2 alone or by E2 + PHTPP treatment, whereas, pDrp1Ser616 expression was significantly decreased by E2 + ICI or E2 + MPP treatment compared to E2 alone (Fig. 4A, B and C).
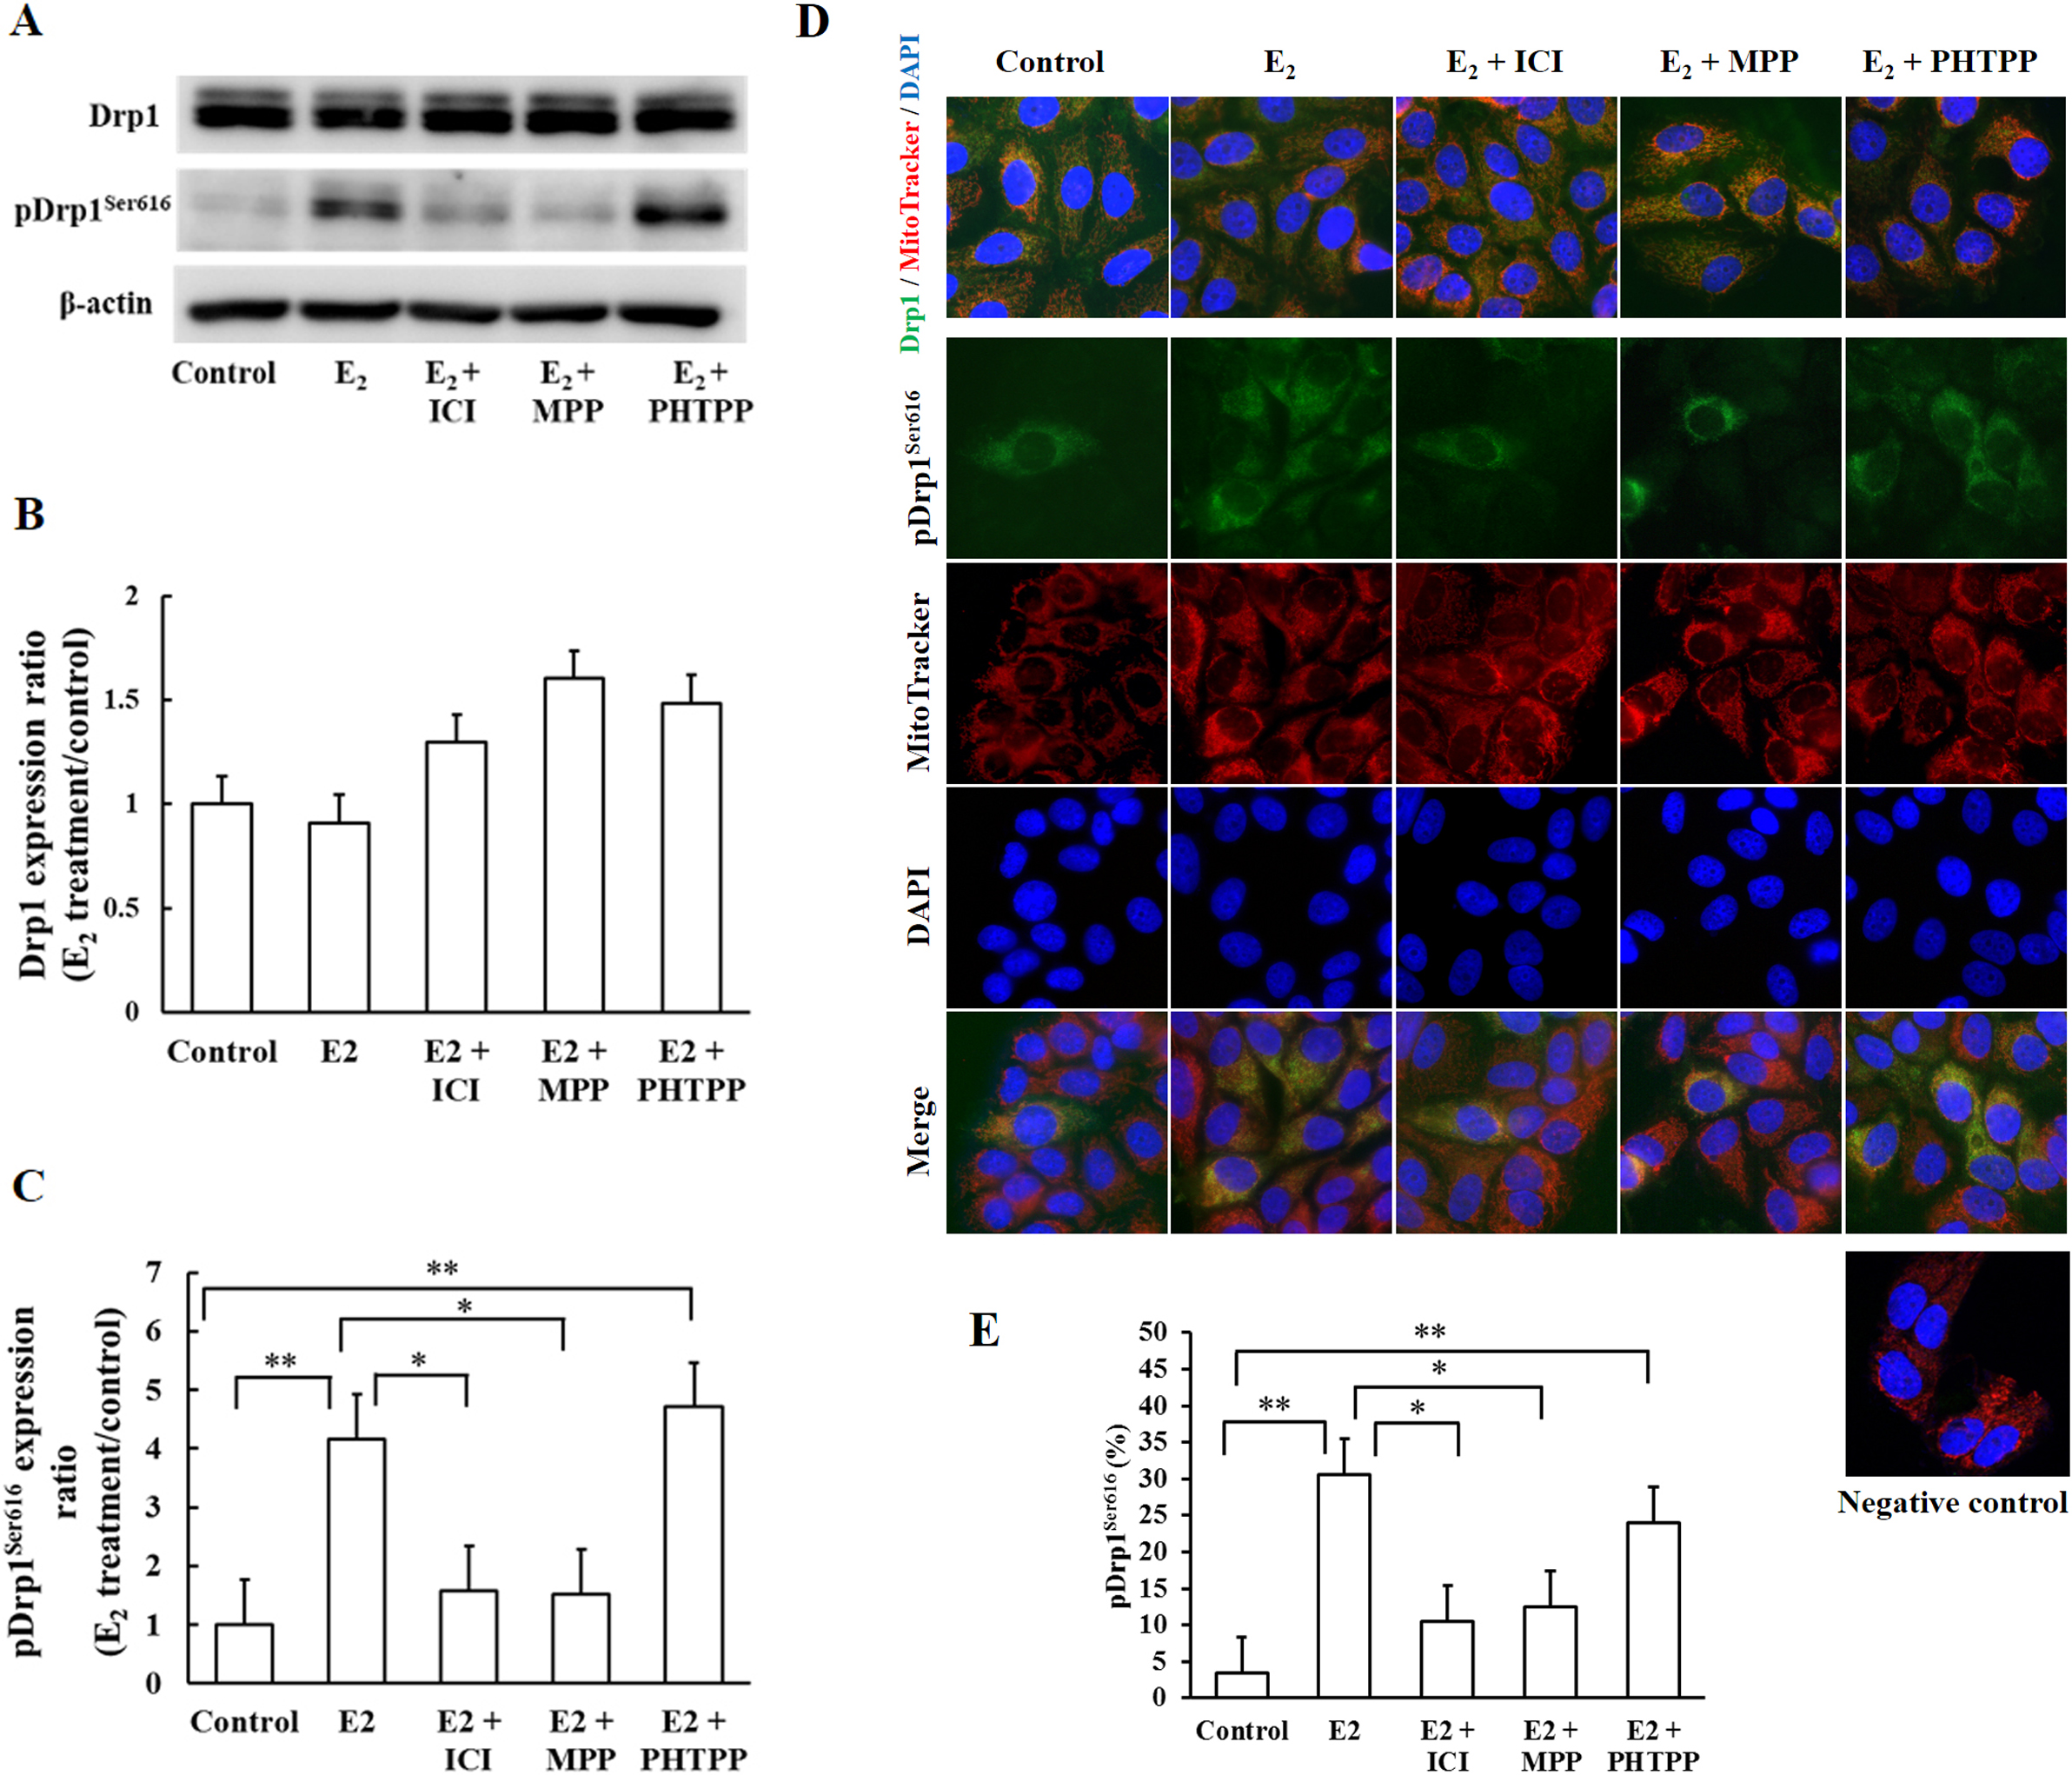
Next, we determined the expression pattern and localization of Drp1 and pDrp1Ser616 in MCF7 by immunohistochemistry. As shown in Fig. 4D (uppermost panel) Drp1 expression was found in the cytoplasm of all cells and co-localized with the mitochondria. Drp1 expression was not changed by treatment with E2 alone or with E2 combined with ER inhibitor. pDrp1Ser616 expression was found in the cytoplasm of MCF7 cells and co-localized with the mitochondria. In control cells, pDrp1Ser616 was expressed in 3.4 ± 1.0% of the total cell population; however, the number of pDrp1Ser616 positive cells was increased to 30.6 ± 5.6% of the total cell population by E2 treatment. After treatment with E2 + ICI or E2 + MPP, the number of pDrp1Ser616 positive cells decreased to 10.5 ± 1.7% and 12.4 ± 4.2%, respectively, compared to E2 treated cells. However, the number of pDrp1Ser616 positive cells was increased significantly (24.0 ± 2.2%) by E2 + PHTPP treatment (Fig. 4E).
ERα knockdown inhibited E2-induced Drp1 phosphorylation at Ser616
To verify the role of ERα, we transiently transfected MCF7 cells with ERα siRNA by electroporation and ERα protein expression was analyzed by western blotting and immunohistochemistry. As shown in Fig. 5A and B, ERα protein expression was decreased in ERα knockdown cells compared to wild type MCF7.
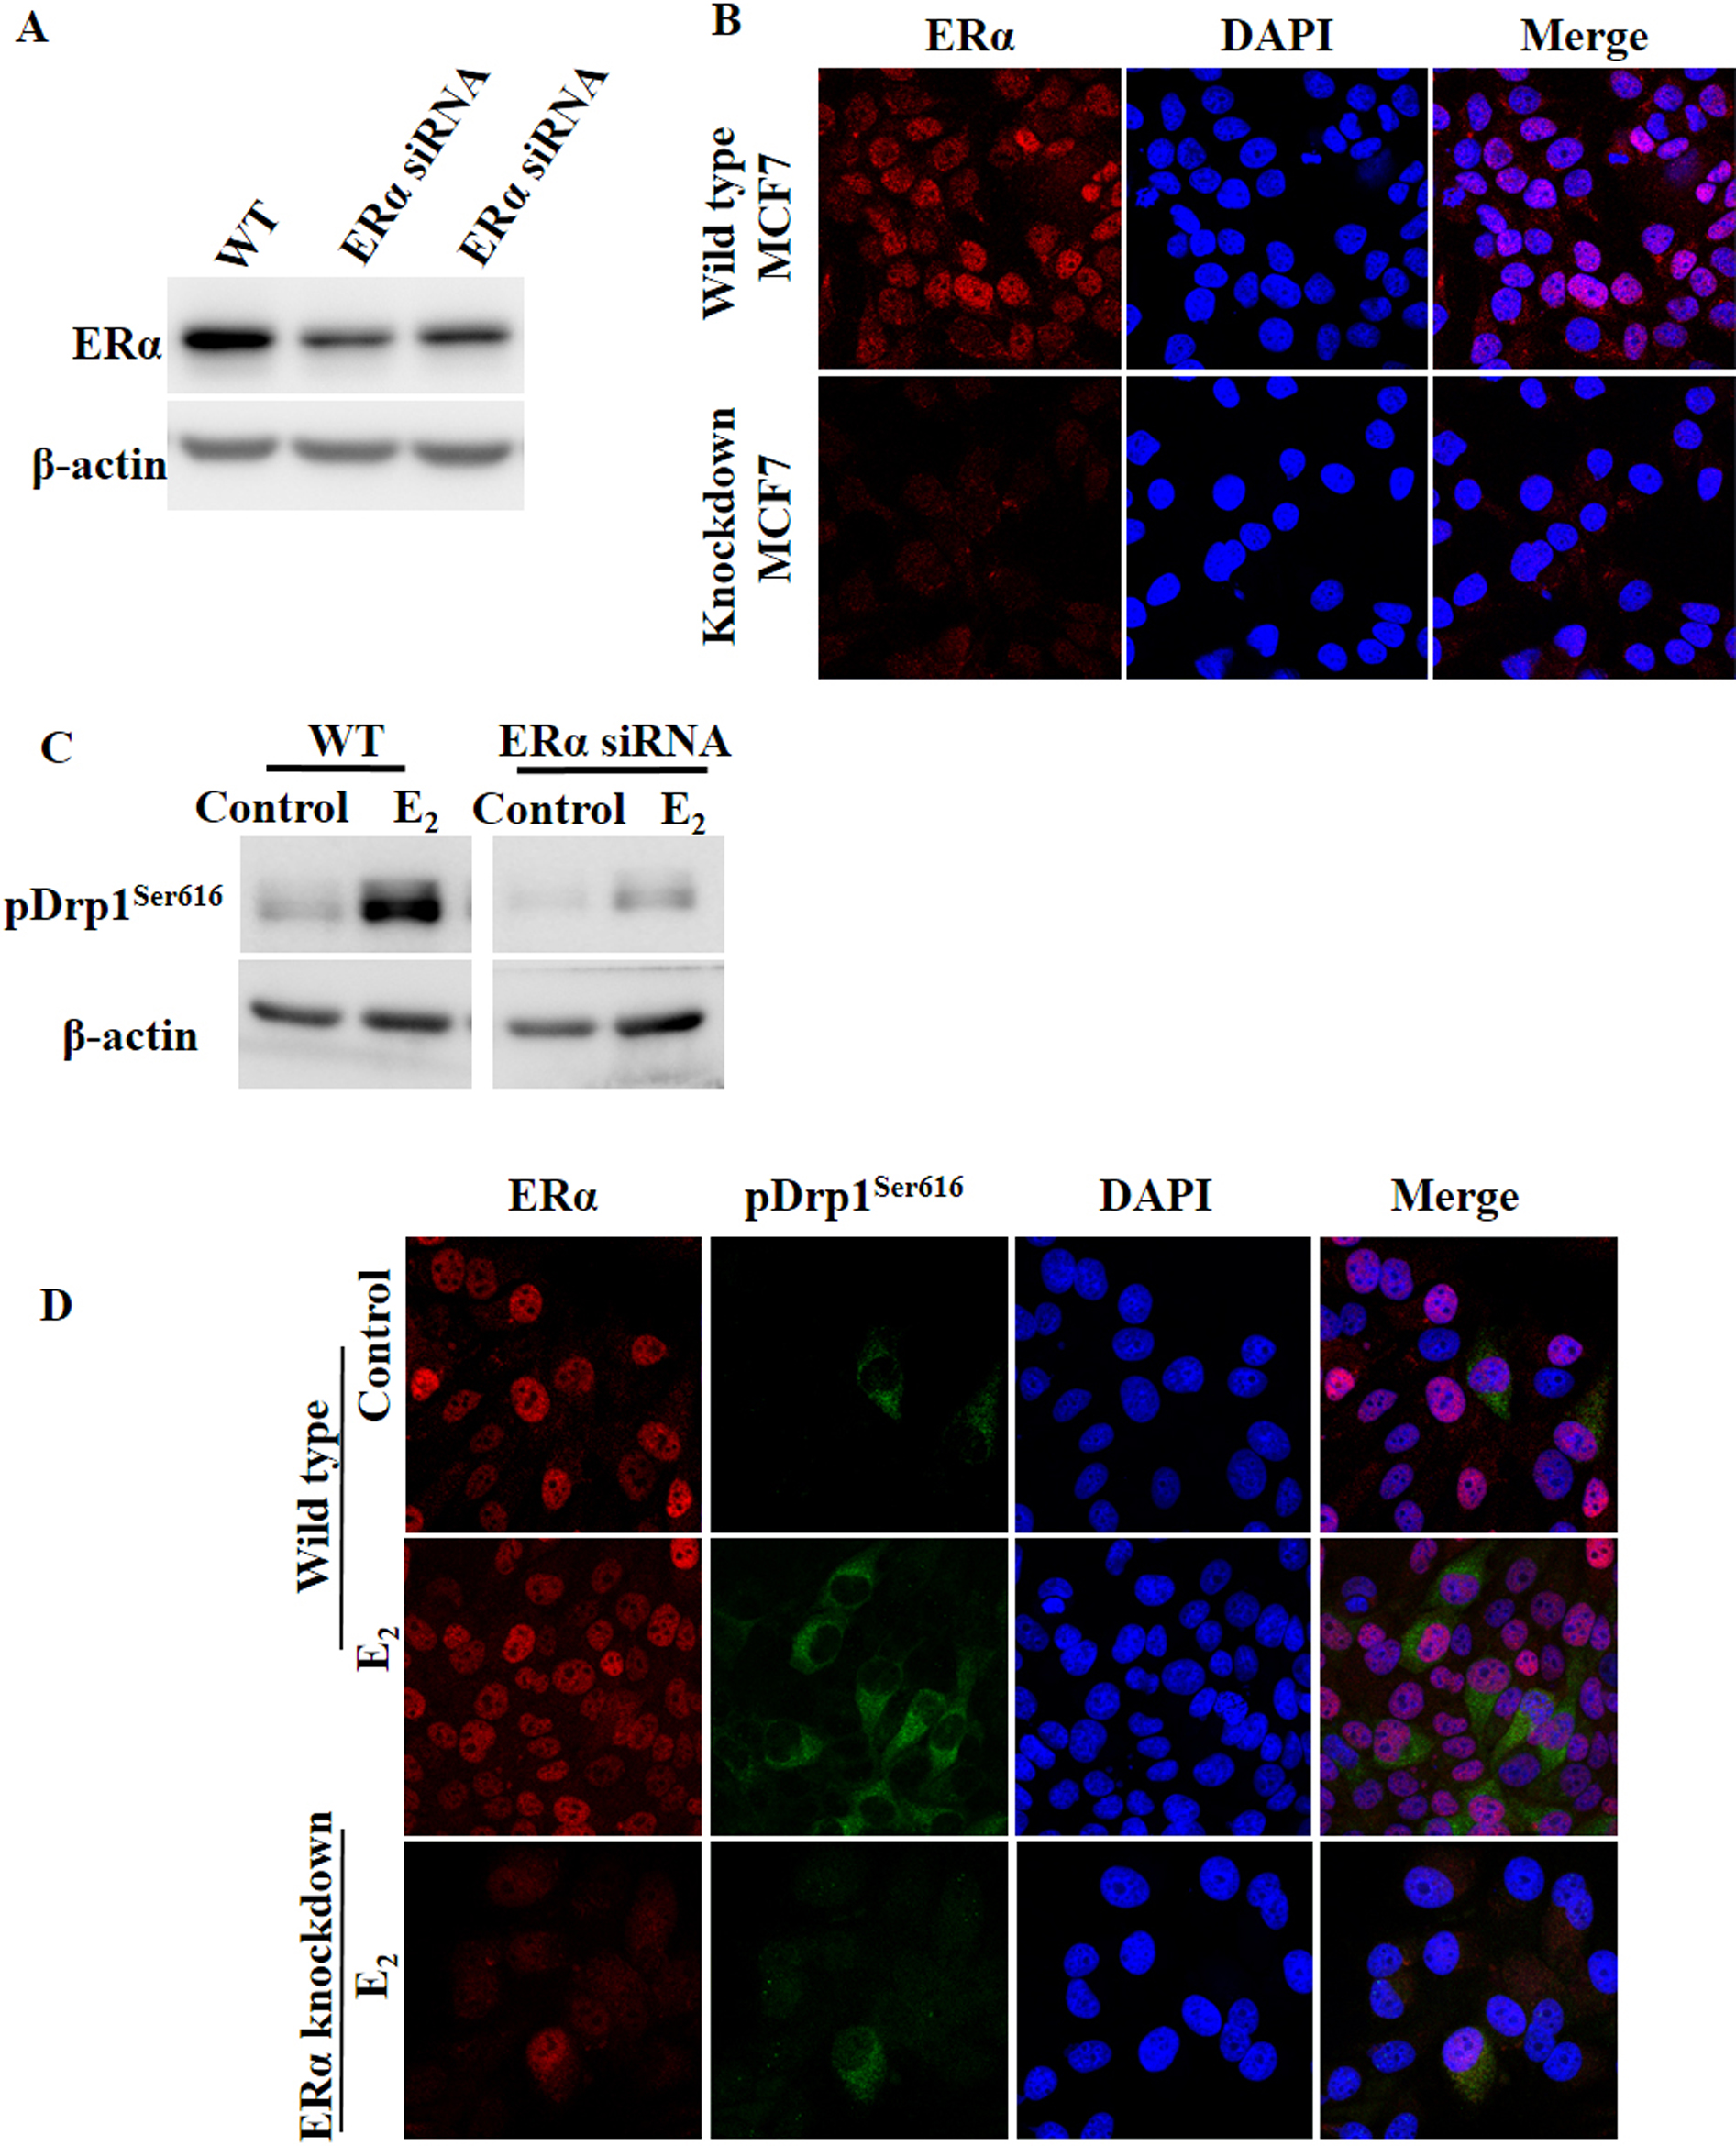
To evaluate the effect of E2 and ERα on pDrp1Ser616 expression, pDrp1Ser616 expression was determined by western blotting and immunohistochemistry in wild type and ERα knockdown MCF7 cells after E2 treatment. In ERα knockdown cells, pDrp1Ser616 protein expression was decreased after E2 treatment compared to that of wild type MCF7 cells (Fig. 5C). Next, we performed double staining for ERα and pDrp1Ser616 expression using immunohistochemistry. In wild type cells, pDrp1Ser616 expression was detected in only a few cells and was co-expressed with ERα. After E2 treatment, pDrp1Ser616 expression was increased and co-expressed with ERα. As expected, in ERα knockdown cells, pDrp1Ser616 expression was decreased after E2 treatment compared to that of wild type cells (Fig. 5D).
E2 regulated mitochondrial morphology observed by TEM
To assess the effects of E2 on mitochondrial morphological changes, we evaluated mitochondrial size by TEM. Tubular-pattern mitochondria were found in control cells but E2 treatment resulted in an increased number of small and short mitochondria (Fig. 6A). Mitochondrial size was measured using ImageJ software and the number of small mitochondria (< 0.5 μm2) was significantly increased (68.7 ± 7.5%) after 36 hr of E2 treatment (Fig. 6B).
IV. Discussion
In this study, we investigated the relationship between estrogen on Drp1 and its post-translational modification and mitochondrial morphology using western blotting, immunohistochemistry, and TEM. The results revealed that Drp1 phosphorylation at Ser616 was induced by estrogen through ERα, and mitochondrial morphology was also changed from a tubular pattern to short and small mitochondria in MCF7 cells. These results indicated that estrogen and ERα are important for regulating mitochondrial morphology through Drp1 phosphorylation in MCF7 cells.
Drp1 is a major mitochondrial fission-related protein which is mainly localized in the cytoplasm and is translocated to the mitochondrial outer membrane during mitochondrial fission [3, 33]. Drp1 translocation is regulated by post-translational modifications, including phosphorylation, SUMOrylation, ubiquitination, and S-nitrosylation [6, 18, 35, 42]. Of these modifications, phosphorylation at Ser616 was previously shown to enhance Drp1 recruitment from the cytoplasm to the mitochondria, resulting in increased cell proliferation activity in cancer cells [19, 35]. On the other hand, Drp1 activity was blocked by phosphorylation at Ser637 and mitochondrial fission was inhibited in rat brain tissue [29, 44].
It is well known that estrogen is an important regulator for breast cancer proliferation and it preserves mitochondrial structure and biogenesis in various tissues, such as heart, liver and brown adipose tissue [13, 16, 17, 30, 46]. In this study, the expression of pDrp1Ser616 was increased by estrogen in a dose- and time-dependent manner, and cell proliferation activity was also increased after estrogen treatment of MCF7. In addition, mitochondrial morphology was changed from a tubular pattern to short and small mitochondria (< 0.5 μm2) after estrogen treatment, as observed by TEM. Therefore, our results using MCF7 suggest that estrogen may be important for regulating mitochondrial morphology and cancer cell proliferation, depending on Drp1 phosphorylation.
The activity of estrogen is mediated by binding with ERα and ERβ, which are members of the nuclear receptor superfamily of transcription factors [20]. To clarify whether estrogen binds to ERα or ERβ, MCF7 cells were treated with non-specific and specific ER inhibitors. We found that pDrp1Ser616 expression was decreased after treatment with estrogen plus ICI (an inhibitor of both ERα and ERβ) or MPP (an ERα-specific inhibitor) compared to treatment with estrogen alone. However, pDrp1Ser616 expression was still increased by treatment with estrogen plus PHTPP (an ERβ-specific inhibitor). To obtain further confirmation, we used ERα knockdown MCF7 cells to analyze pDrp1Ser616 expression after E2 treatment. This result also revealed that pDrp1Ser616 expression was decreased in ERα knockdown cells after estrogen treatment compared to that in wild type cells. Our results suggest that ERα, but not ERβ, plays an important role in estrogen-dependent mitochondrial morphological changes in MCF7 cells.
In a classic signaling pathway, estrogen-ER complex can bind to specific consensus sequences in the nuclear DNA, known as estrogen responsive element (ERE) or to nuclear transcription factors, such as activator protein 1 (AP-1) or specificity protein 1 (SP-1) and regulate the transcriptional activity of nuclear encoded mitochondrial genes [1, 20, 27, 43]. In the other hand, the mitochondrial genome also contains ERE-like sequences (mtERE) and AP-1 transcription factor [4, 5, 20]. Several studies have reported the detection of estrogen binding to mitochondria and the presence of estrogen-binding proteins within mitochondria [4, 20, 21]. It was also reported that estrogen enhances ERα and ERβ mitochondrial localization in MCF7 cells [5]. Therefore, it is possible that ERα and ERβ may bind with mtERE or AP-1 in mitochondria and impact mtDNA gene expression and other functions, such as oxidative phosphorylation [5, 20]. Although our results suggest that estrogen and ERα, but not ERβ, may be important for mitochondrial morphological changes, further experiments are needed to reveal whether estrogen binds to nuclear ERs or to mitochondrial localized ERs to regulate mitochondrial morphology.
In a clinical setting, adjuvant endocrine therapy such as with tamoxifen or aromatase inhibitors lows disease progression and increases the survival of breast cancer patients. However, many patients must deal with recurrent drug resistance [8, 9, 36]. There has been recent focus on mitochondrial dynamics in the disease process, as well as on targeted treatment in various diseases, including cancer [19]. Indeed, the Drp1 inhibitor (mitochondrial fission inhibitor-1, mdivi-1) is a candidate for the treatment of ischemia-reperfusion injury of heart, skeletal muscle atrophy, and cancers such as ovarian cancer, cervical cancer, breast cancer and melanoma [38]. However, the controversial effects on cell survival were observed depending on the cell type and experimental setting [31]. Therefore, further examination for targeting post-translational modification is necessary for devising a new strategy for treating various diseases, including cancer.
In conclusion, our results demonstrate that Drp1 phosphorylation at Ser616, involved in the regulation of mitochondrial morphology, may be induced by estrogen through ERα. Although we did not provide direct evidence, our result regarding the regulation of Drp1 phosphorylation by estrogen, may be helpful for the development of further treatments in estrogen-dependent breast cancer.
V. Conflicts of Interest
The authors declare that there are no conflicts of interest.
VI. Acknowledgments
This study was supported in part by a Grant-in-Aid for Scientific Research from the Japan Society for the promotion of Science (No. 16K08471 to Y. Hishikawa).
VII. References
- 1 Arpino, G., Wiechmann, L., Osborne, C. K. and Schiff, R. (2008) Crosstalk between the estrogen receptor and the HER tyrosine kinase receptor family: molecular mechanism and clinical implications for endocrine therapy resistance. Endocr. Rev. 29; 217–233.
- 2 Batmunkh, B., Choijookjuu, N., Srisowanna, N., Byambatsoqt, U., Synn Oo, P., Noor Ali, M., Yamaguchi, Y. and Hishikawa, Y. (2017) Estrogen accelerates cell proliferation through estrogen receptor α during rat liver regeneration after partial hepatectomy. Acta Histochem. Cytochem. 50; 39–48.
- 3 Cassidy-Stone, A., Chipuk, J. E., Ingerman, E., Song, C., Yoo, C., Kuwana, T., Kurth, M. J., Shaw, J. T., Hinshaw, J. E., Green, D. R. and Nunnari, J. (2008) Chemical inhibition of the mitochondrial division dynamin reveals its role in Baz/Bak-dependent mitochondrial outer membrane permeabilization. Dev. Cell 14; 193–204.
- 4 Chen, J. Q., Yager, J. D. and Russo, J. (2005) Regulation of mitochondrial respiratory chain structure and function by estrogens/estrogen receptors and potential physiological/pathophysiological implications. Biochim. Biophys. Acta 1746; 1–17.
- 5 Chen, J. Q., Brown, T. R. and Yager, J. D. (2008) Mechanisms of hormone carcinogenesis: evolution of views, role of mitochondria. Adv. Exp. Med. Biol. 630; 1–18.
- 6 Cho, D. H., Nakamura, T., Fang, J., Cieplak, P., Godzik, A., Gu, Z. and Lipton, S. A. (2009) S-nitroyslation of Drp1 mediates beta-amyloid-related mitochondrial fission and neuronal injury. Science 324; 102.
- 7 Detmer, S. A. and Chan, D. C. (2007) Functions and dysfunctions of mitochondrial dynamics. Nat. Rev. Mol. Cell Biol. 8; 870–879.
- 8 Geisler, J. and Lønning, P. E. (2001) Resistance to endocrine therapy of breast cancer: recent advances and tomorrow’s challenges. Clin. Breast Cancer 1; 297–308.
- 9 Gjerde, J., Geisler, J., Lundgren, S., Ekse, D., Varhaug, J. E., Mellgren, G., Steen, V. M. and Lien, E. A. (2000) Associations between tamoxifen, estrogens, and FSH serum levels during steady state tamoxifen treatment in postmenopausal women with breast cancer. BMC Cancer 10; 313.
- 10 Gruber, C. J., Tschugguel, W., Schneeberger, C. and Huber, J. C. (2002) Production and actions of estrogens. N. Engl. J. Med. 346; 340–352.
- 11 Hales, K. G. (2004) The machinery of mitochondrial fusion, division, and distribution, and emerging connections to apoptosis. Mitochondrion 4; 285–308.
- 12 Hishikawa, Y., Damavandi, E., Izumi, S. and Koji, T. (2003) Molecular histochemical analysis of estrogen receptor alpha and beta expressions in the mouse ovary: in situ hybridization and Southwestern histochemistry. Med. Electron Microsc. 36; 67–73.
- 13 Hishikawa, Y., Tamaru, N., Ejima, K. and Koji, T. (2004) Expression of keratinocyte growth factor and its receptor in human breast cancer: its inhibitory role in the induction of apoptosis possibly through the over expression of Bcl-2. Arch. Histol. Cytol. 67; 455–465.
- 14 Hu, C., Huang, Y. and Li, L. (2017) Drp1-dependent mitochondrial fission plays critical roles in physiological and pathological progresses in mammals. Int. J. Mol. Sci. 18; pii: E144.
- 15 Jemal, A., Siegel, R., Xu, J. and Ward, E. (2010) Cancer statistics, 2010. CA Cancer J. Clin. 60; 277–300.
- 16 Justo, R., Frontera, M., Pujol, E., Rodríguez-Cuenca, S., Lladó, I., García-Palmer, F. J., Roca, P. and Gianotti, M. (2005) Gender-related differences in morphology and thermogenic capacity of brown adipose tissue mitochondrial subpopulations. Life Sci. 76; 1147–1158.
- 17 Justo, R., Boada, J., Frontera, M., Oliver, J., Bermúdez, J. and Gianotti, M. (2005) Gender dimorphism in rat liver mitochondria oxidative metabolism and biogenesis. Am. J. Physiol. Cell Physiol. 289; C372–378.
- 18 Karbowski, M., Neutzner, A. and Youle, R. J. (2007) The mitochondrial E3 ubiquitin ligase MARCH5 is required for Drp1 dependent mitochondrial division. J. Cell Biol. 178; 71–84.
- 19 Kashatus, J. A., Nascimento, A., Myers, L. J., Sher, A., Byrne, F. L., Hoehn, K. L., Counter, C. M. and Kashatus, D. F. (2015) Erk2 phorphorylation of Drp1 promotes mitochondrial fission and MAPK-deriven tumor growth. Mol. Cell 57; 537–551.
- 20 Klinge, C. M. (2008) Estrogenic control of mitochondrial function and biogenesis. J. Cell. Biochem. 105; 1342–1351.
- 21 Matthews, J. and Gustafsson, J. A. (2003) Estrogen signaling: a subtle balance between ER alpha and ER beta. Mol. Interv. 3; 281–292.
- 22 Murakami, E., Nakanishi, Y., Hirotani, Y., Ohni, S., Tang, X., Masuda, S., Enomoto, K., Sakurai, K., Amano, S., Yamada, T. and Nemoto, N. (2016) Roles of Ras homolog A in invasive ductal breast carcinoma. Acta Histochem. Cytochem. 49; 131–140.
- 23 Nakada, K., Inoue, K. and Hayashi, J. (2001) Interaction theory of mammalian mitochondria. Biochem. Biophys. Res. Commun. 288; 743–746.
- 24 Ogawa, K., Tsuji, M., Tsuyama, S. and Sasaki, F. (2003) Histamine increased the uptake of Rhodamine 123 in mitochondria of living parietal cells in cultured gastric glands from starved guinea pigs. Acta Histochem. Cytochem. 36; 255–262.
- 25 Ong, S. B. and Hausenloy, D. J. (2010) Mitochondrial morphology and cardiovascular disease. Cardiovasc. Res. 88; 16–29.
- 26 Otera, H. and Mihar, K. (2012) Mitochondrial dynamics: functional link with apoptosis. Int. J. Cell Biol. 2012; 1–10.
- 27 Pedram, A., Razandi, M. and Levin, E. R. (2006) Nature of functional estrogen receptors at the plasma membrane. Mol. Endocrinol. 20; 1996–2009.
- 28 Prieto, J., Leon, M., Ponsoda, X., Sendra, R., Bort, R., Ferrer-Lorente, R., Raya, A., Lopez-Garcia, C. and Torres, J. (2016) Early ERK1/2 activation promotes Drp1-dependent mitochondrial fission necessary for cell reprogramming. Nat. Commun. 7; 11124.
- 29 Qi, X., Disatnik, M. H., Shen, N., Sobel, R. A. and Mochly-Rosen, D. (2011) Aberrant mitochondrial fission in neurons induced by protein kinase C {delta} under oxidative stress conditions in invo. Mol. Biol. Cell 22; 256–265.
- 30 Rodriguez-Cuenca, S., Pujol, E., Justo, R., Frontera, M., Oliver, J., Gianotti, M. and Roca, P. (2002) Sex-dependent thermogenesis, differences in mitochondrial morphology and function, and adrenergic response in brown adipose tissue. J. Biol. Chem. 277; 42958–42963.
- 31 Rosdah, A. A., Holien, J. K., Delbridge, L. M., Dusting, G. J. and Lim, S. Y. (2016) Mitochondrial fission—a drug target for cytoprotection or cytodestruction? Pharmacol. Res. Perspect. 4; e00235.
- 32 Sastre-Serra, J., Nadal-Serrano, M., Pons, D. G., Roca, P. and Oliver, J. (2012) Mitochondrial dynamics is affected by 17β-estradiol in the MCF-7 breast cancer cell line. Effects on fusion and fission related genes. Int. J. Biochem. Cell Biol. 44; 1901–1905.
- 33 Shin, H. W., Takatsu, H., Mukai, H., Munekata, E., Murakami, K. and Nakayama, K. (1999) Intramolecular and interdomain interactions of a dynamin-related GTP-binding protein, Dnm1p/Vps1p-like protein. J. Biol. Chem. 274; 2780–2785.
- 34 Strack, S., Wilson, T. J. and Cribbs, J. T. (2013) Cyclin-dependent kinases regulate splice-specific targeting of dynamin-related protein 1 to microtubules. J. Cell Biol. 201; 1037–1051.
- 35 Taguchi, N., Ishihara, N., Jofuku, A., Oka, T. and Mihara, K. (2007) Mitotic phosphorylation of dynamin-related GTPase Drp1 participates in mitochondrial fission. J. Biol. Chem. 282; 11521–11529.
- 36 Thomas, C. and Gustafsson, J. A. (2011) The different roles of ER subtypes in cancer biology and therapy. Nat. Rev. Cancer 11; 597–608.
- 37 Toda, K., Takeda, O., Okada, T., Akira, S., Saibara, T., Kaname, T., Yamamura, K., Onishi, S. and Shizuta, Y. (2001) Targeted disruption of the aromatase P450 gene (Cyp19) in mice and their ovarian and uterine responses to 17beta-oestradiol. J. Endocrinol. 170; 99–111.
- 38 Trotta, A. P. and Chipuk, J. E. (2017) Mitochondrial dynamics as regulators of cancer biology. Cell. Mol. Life Sci. 74; 1999–2017.
- 39 Tsuchiya, K., Ikeda, T., Batmunkh, B., Choijookhuu, N., Ishizaki, H., Hotokezaka, M., Hishikawa, Y. and Nanashima, A. (2017) Frequency of CD4+CD161+ T cell and interleukin-10 expression in inflammatory bowel diseases. Acta Histochem. Cytochem. 50; 21–28.
- 40 Vic, P., Vignon, F., Derocq, D. and Rochefort, H. (1982) Effect of estradiol on the untrastructure of the MCF7 human breast cancer cells in culture. Cancer Res. 42; 667–673.
- 41 Vrtačnik, P., Ostanek, B., Mencej-Bedrač, S. and Marc, J. (2014) The many faces of estrogen signaling. Biochem. Med. (Zagreb). 24; 329–342.
- 42 Wasiak, S., Zunino, R. and McBride, H. M. (2007) Bax/Bak promote sumoylation of DRP1 and its stable association with mitochondria during apoptotic cell death. J. Cell Biol. 177; 439–450.
- 43 Watson, C. S., Alyea, R. A., Jeng, Y. J. and Kochukov, M. Y. (2007) Nongenomic actions of low concentration estrogens and xenoestrogens on multiple tissues. Mol. Cell. Endocrinol. 274; 1–7.
- 44 Xie, Q., Wu, Q., Horbinski, C. M., Flavahan, W. A., Yang, K., Zhou, W., Dombrowski, S. M., Huang, Z., Fang, X., Shi, Y., Ferguson, A. N., Kashatus, D. F., Bao, S. and Rich, J. N. (2015) Mitochondrial control by DRP1 in brain tumor initiating cells. Nat. Neurosci. 18; 501–510.
- 45 Zaja, I., Bai, X., Liu, Y., Kikuchi, C., Dosenovic, S., Yan, Y., Canfield, S. G. and Bosnjak, Z. J. (2014) Cdk1, PKCδ and calcineurin-mediated Drp1 pathway contributes to mitochondrial fission-induced cardiomyocyte death. Biochem. Biophys. Res. Commun. 453; 710–721.
- 46 Zhai, P., Eurell, T. E., Cooke, P. S., Lubahn, D. B. and Gross, D. R. (2000) Myocardial ischemia-reperfusion injury in estrogen receptor-alpha knockout and wild-type mice. Am. J. Physiol. Heart Circ. Physiol. 278; H1640–1647.