Abstract
Liposomes, artificial phospholipid vesicles, have been developed as a non-viral drug delivery system to allow contained agents to be efficiently delivered to target sites via systemic circulation. Liposomes have been used as a gene transfer tool with cultured cells; however, their precise trafficking and processing remain uncertain. Furthermore, liposomes with different surface charges are known to exhibit distinct properties. The purpose of the current study was to elucidate the intracellular trafficking and processing of liposomes with anionic and cationic surface charges from a morphological view point. We found that cationic liposomes (CLs) were more effectively taken by the cells than anionic liposomes (ALs). Confocal laser scanning microscopy and transmission electron microscopy demonstrated distinct intracellular localization and processing patterns of ALs and CLs. ALs and their contents were localized in lysosomes but not in cytosol, indicating that ALs are subjected to the endosome-lysosome system. In contrast, contents of CLs were distributed mainly in the cytosol. CLs appear to disturb the cell membrane and then collapse to release their contents into the cytosol. It is feasible that the contents of CLs enter the cytosol directly rather than via the endosome-lysosome system.
I. Introduction
Liposomes, artificial phospholipid vesicles, are designed to contain agents and deliver them to target sites via the systemic circulation. Clinically, liposomes have been used as vectors for anti-cancer drugs and they exhibit excellent therapeutic efficacy and low toxicity due to the absence of immunogenic viral proteins [11, 13, 14, 19, 23, 25, 28, 44, 48]. Liposomes are also being developed as vectors for gene therapies to treat genetic and acquired disorders [4, 8, 10, 22, 31, 34, 35, 37, 38, 49]. Although in vivo transfection efficiencies of liposomes are not yet as high as those of viral vectors, liposomes have been used as a gene transfer tool for in vitro lipofection [1, 10, 20, 22, 52, 59]. The gene transfer efficacies of liposomes depend on their own physical and chemical characteristics, including surface electric charge, size, and lipid structure [17]. Among these features, surface electric charge is one of the most important factors in efficient gene transfer, and transfection efficacy of cationic liposomes (CLs) is substantially higher than that of anionic liposomes (ALs) [1, 10, 41, 42, 49, 60]. Thus, CLs have been studied intensively as carriers of nucleic acids for gene delivery and gene silencing [1, 7, 8, 10, 20, 31, 34, 35, 37, 38, 41, 42, 45, 49, 56, 60]. The reason for the difference in gene transfer efficacies between ALs and CLs remains unknown.
For appropriate expression of gene constructs, liposomes must overcome cellular and intracellular barriers, including the plasma membrane, the endosome-lysosome system, and the nuclear membrane [26, 55, 57]. Both ALs and CLs are believed to be taken up by cells via endocytosis and to be transferred to the endosome-lysosome system [12, 17, 50]; therefore, escape from the endosome-lysosome system is a key step for high transfection efficiency [3, 9, 27, 54]. Recently, dendron-bearing lipids, novel cationic lipids with poly-amidoamine dendrons and two alkyl chains, have been developed as materials for liposomes [51]. The dendron-bearing lipids are designed to escape endosomal capture. The tertiary amino groups in the poly-amidoamine dendrons are considered to suppress lowering of endosome pH, while the two alkyl chains promote liposomal membrane fusion with endosomes [6, 15, 21, 24, 36, 46, 51, 58]. In gene transfection experiments, the dendron-bearing liposomes showed high gene transfer efficiency and effective induction of expression of included constructs in transfected cells [6, 15, 21, 24, 36, 46, 51, 58]. However, escape of the dendron-bearing liposomes and their contents from endosomes has not been verified by morphological analyses.
To elucidate the trafficking and processing of liposomes, we investigated localization of ALs, dendron-bearing CLs, and their contents in cultured cells using morphological techniques. Through these experiments, we aimed to determine whether endosomal escape occurs.
II. Materials and Methods
Cell cultures
RS182 [18] and A431 [5] cell lines were provided by Dr. Hajime Tei (Kanazawa University) and Katayama Chemical Industries (Kobe, Japan), respectively. NIH3T3 [33] (Cell # JCRB0615) and NY [47] (Cell # JCRB0614) cell lines were obtained from the JCRB cell bank (Osaka, Japan). RS182, NIH3T3, A431, and NY are rat neuron-, mouse fibroblast-, human squamous carcinoma-, and human osteosarcoma-derived cell lines, respectively. RS182 and NIH3T3 cells were cultured in high-glucose Dulbecco’s modified Eagle’s medium (DMEM; Sigma-Aldrich, St. Louis, MO, USA) supplemented with 10% fetal bovine serum (FBS; Equitech-Bio, Kerrville, TX, USA) and 1% penicillin/streptomycin solution (Wako, Osaka, Japan). A431 cells were cultured in supplemented low-glucose DMEM (Sigma-Aldrich). NY cells were cultured in supplemented Eagle’s minimal essential medium (EMEM; Thermo Fisher Scientific, Waltham, MA, USA). RS182 cells were incubated in a fully humidified 5% CO2 incubator at 33°C [18]. The other cell lines were maintained at 37°C. Media were changed every 3–4 days, and the cells were routinely passaged every 6–8 days.
Liposomes
Anionic Glycolipo-A0 liposomes (Katayama Chemical Industries) were composed of dipalmitoyl phosphatidylcholine, cholesterol, ganglioside GM3, dicetylphosphate, dipalmitoyl-phosphatidyl-ethanolamine, and phosphatidyl-ethanolamine (PE) at a molar ratio of 35:40:15:5:5:0.1. The zeta potential of anionic liposomes were −55 to −56 mV. Cationic dendron-bearing liposomes incorporating unsaturated bonds, generation-1 (DL-U2-G1; Katayama Chemical Industries) were comprised of poly-amidoamine dendrimer and PE at a molar ratio of 1:0.1 [15]. The zeta potential of cationic liposomes were 50 to 53 mV. Fluorescent dye- and/or colloidal gold-containing liposomes with a diameter of 100–200 nm were used. For flow cytometry (FCM) and confocal laser scanning microscopy (CLSM) analyses, Glycolipo-A0 containing Cy3, Cy3/colloidal gold or rhodamine, and DL-U2-G1 containing rhodamine were used as ALs and CLs, respectively. For transmission electron microscopy (TEM) analyses, colloidal gold-containing Glycolipo-A0 and DL-U2-G1 were used as ALs and CLs, respectively. Appropriate inclusion of colloidal gold particles in the liposomes was confirmed by TEM (Fig. 1). The effects of the application of ALs or CLs on cell viability has been reported to be negligible [15, 29, 32, 39, 40].

Suitable host cells for morphological analyses were selected based on their ability to take up Cy3-containing ALs. RS182, NIH3T3, A431 and NY cells were examined using FCM. Cellular uptake of fluorescence-containing liposomes was measured using a Coulter Elite flow cytometer (BD Bioscience, San Jose, CA, USA) equipped with an Octagon ion laser. Cultured cells were plated at 1.0 × 10⁶ in 38-mm2 12-well Costar cell culture plates (Sigma-Aldrich). After incubation for 3 days, fluorescence-contained reagents (Cy3 or Cy3/colloidal gold-contained ALs) or Cy3-labeled serum albumin were applied to the cells for various periods (0.5–48 hr). After the application, cells were washed three times with phosphate-buffered saline (PBS) and then detached by trypsinization and collected by centrifugation (181 × g, 3 min) and then resuspended in PBS containing 0.08% sodium azide. For Cy3 uptake experiments, propidium iodide (PI, 5 μg/ml) was added to each sample 1 min prior to analysis. Cy3 and PI were excited by a 488 nm solid-state laser, and the fluorescence emission was detected using 585/42 nm and 670 nm filters, respectively. The cells were appropriately gated by forward and side scatter against a cells-only control to ensure that autofluorescence was excluded from the analysis. Ten thousand gated events were collected for each sample, and mean fluorescence intensity (MFI) was obtained using FACSDiva software (BD Biosciences). Three samples for each condition were analyzed.
To compare uptake of ALs and CLs, rhodamine-containing liposomes were applied to RS182 cells for 30 min. Fluorescence intensity of both rhodamine-containing AL and CL solutions was adjusted to 0.9–2.0 × 10⁶ before application using a multimode microplate reader (Filter Max F5, Molecular Devices, Sunnyvale, CA, USA). RS182 cells were plated at 1.0 × 10⁶ in 38-mm2 12-well Costar cell culture plates (Sigma-Aldrich). After incubation for 3 days, rhodamine-containing ALs or CLs were applied to the cells for 30 min. After the treatment, cells were washed three times with PBS and then cultured in fresh medium for various time periods (0, 30, and 90 min). After three washes with PBS, the cells were detached by trypsinization and collected by centrifugation (181 × g, 3 min) and then resuspended in PBS. Rhodamine was excited by a 488 nm solid-state laser, and the fluorescence emission was detected using 530/30 nm filters. Ten thousand gated events were collected for each sample, and the MFI was obtained. Three samples for each condition were analyzed.
Confocal laser scanning microscopy
RS182 cells were plated at 2.0 × 10⁶ in 35-mm culture 8-chamber slide 2s (Iwaki Cell Biology Corporation, Tokyo, Japan) and incubated for 3 days. For lysosomal staining, the cells were incubated with a lysosome marker (Lysosomes-GFP, BacMam 2.0, Thermo Fisher Scientific) for 24 hr, and then cultured in fresh medium for 24 hr. Fluorescence intensities of the AL and CL solutions were adjusted to 0.8–2.4 × 10⁴ using a multimode microplate reader (Filter Max F5). To visualize liposome processing, the cells were treated with rhodamine-containing ALs or CLs for 30 min at 33°C. After treatment, the cells were washed three times with PBS followed by fixation with 5% PFA. 4',6-diamidinophenyl-indole (DAPI) was used for nuclear staining. Confocal images of cells were obtained using an upright ZEISS LSM710 Spectral confocal laser scanning microscope (Zeiss, Oberkochen, Germany) with a 63 × oil immersion objective (NA=1.4) lens and the 1.5 × digital zoom function. The image size was set to 1024 × 1024 pixels. For acquisition of triple fluorescence images, laser stacks for 405, 488 and 561 nm beams were used for DAPI, GFP and rhodamine, respectively. The images were taken with multitrack sequential acquisition settings to avoid inter-channel crosstalk. Optimized emission detection and wavelength filters were configured using Zeiss Zen 2009 control software: 410–485, 505–540, and 560–630 nm emission for DAPI, GFP, and rhodamine, respectively. The pinhole was set to 1.0 Airy unit. Z-stack acquisition intervals were set to 0.40 μm. Z-projections were generated from Z stacks comprised of 25–40 optical sections. Images of ten cells were collected from each dish, and three to four separate experiments were performed (n=10/dish, N=3–4).
Transmission electron microscopy
Intracellular distribution of liposomes and their contents was further analyzed using colloidal gold-containing liposomes and TEM. To observe colloidal gold-containing ALs or CLs, these liposomes were fixed in 1% glutaraldehyde and diluted in 5% ionic-liquid, 1-butyl-3-methylimidazolium tetrafluoroborate (Tokyo Chemical Industry, Tokyo, Japan), on 200-mesh copper grids covered with carbon coated collodion film (NISSIN EM., Tokyo, Japan). Four or five images of liposomes were collected from each grid, and ten separate experiments were performed for each liposomes (n=4–5/grid, N=10). To observe uptake of colloidal gold-containing liposomes, RS182 cells were plated at 1.0 × 10⁵ in 35-mm culture 8-chamber slide 2s (Iwaki) and were incubated for 3 days. The cells were treated with colloidal gold-containing ALs or CLs for 30 min. After the treatment, cells were washed three times with PBS followed by replacement with fresh medium and harvested 0 and 30 min later. After three washes with PBS, cells were fixed in 2% glutaraldehyde and 2% paraformaldehyde in 0.1 M phosphate buffer (PB) for 1 hr at 4°C. The specimens were post-fixed with 2% osmium tetroxide in 0.1 M PB for 1 hr at 4°C. The samples were then rinsed three times with 0.1 M PB, followed by dehydration through a graded series of ethanol. After embedding in Epon resin (Polysciences, Warrington, PA, USA), ultra-thin sections were cut with an ultra-microtome EM UC7 (Leica Microsystems, Nusslosh GmbH, Germany). The ultra-thin sections were stained with uranylacetate and lead citrate, and images were obtained using a TEM (H-7650; Hitachi High Technologies Corporation, Tokyo, Japan). Images of three or four cells were collected from each dish, and ten separate experiments were performed (n=3–4/dish, N=10).
Statistical analysis
All values are expressed as the mean ± SEM. Data were statistically analyzed by two-way repeated-measures analysis of variance, followed by the Bonferroni post hoc test using IBM SPSS Statistics (IBM, Chicago, IL, USA). Differences were considered significant at P < 0.05.
III. Results
Efficiency of liposome uptake in cultured cells
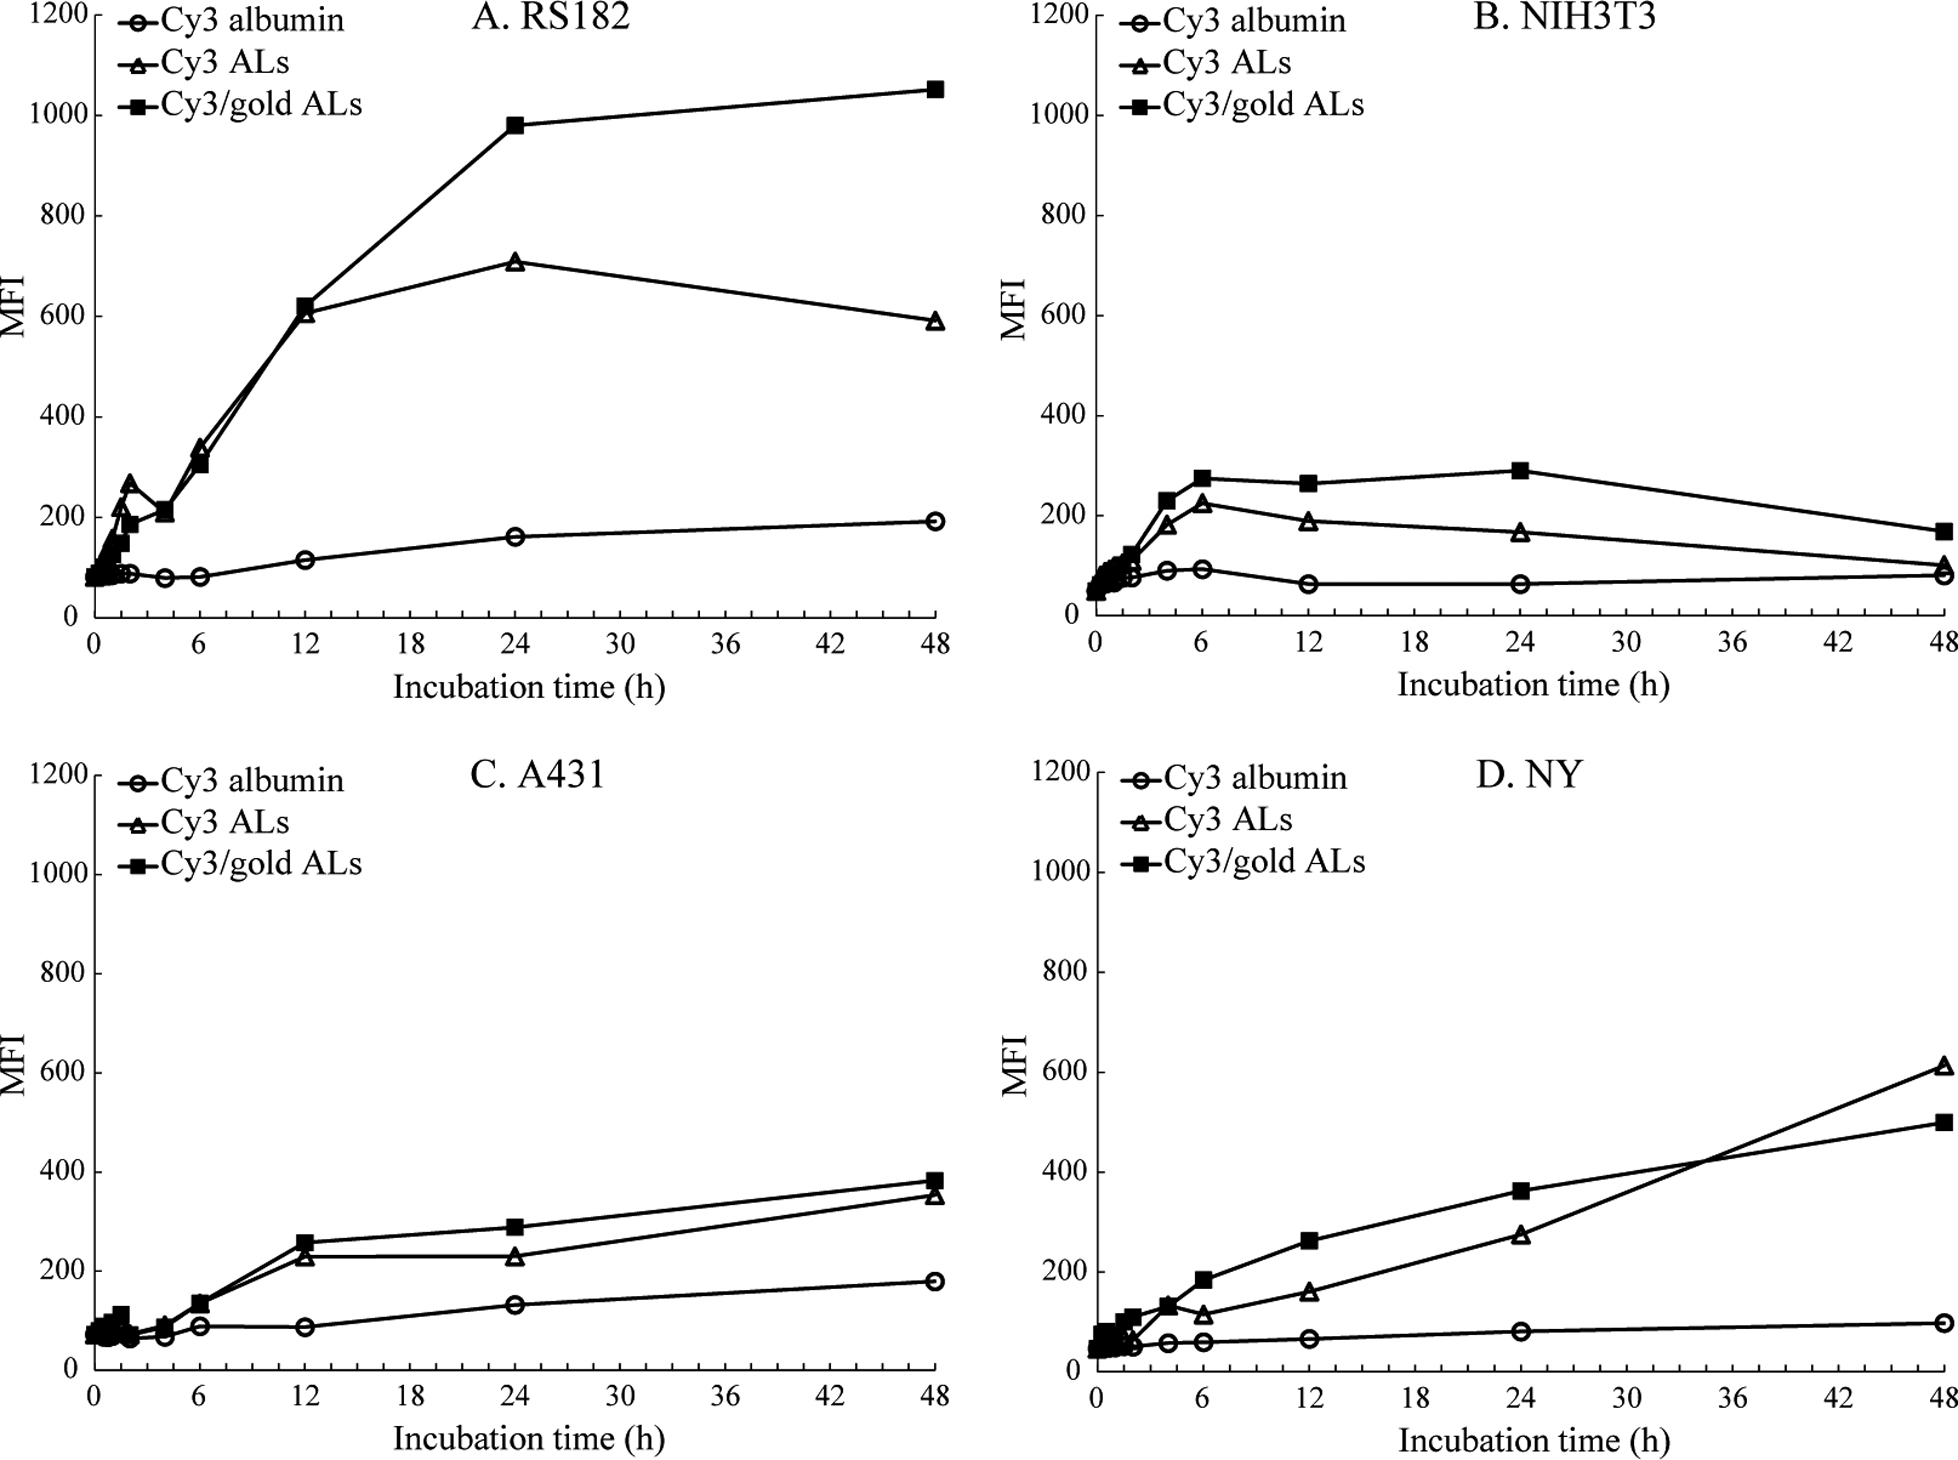
To determine suitable host cells based on liposome uptake efficiency, cell uptake of Cy3-containing ALs was examined using FCM. Accumulation of Cy3 was monitored in RS182, NIH3T3, A431, and NY cells after administration of Cy3-containing ALs (Fig. 2). A gradual increase of Cy3 signal was detected in all of the cell lines after the administration. Accumulation of Cy3 after administration of Cy3/colloidal gold-double-containing ALs displayed similar profiles to those after administration of Cy3-containing ALs, indicating that colloidal gold particles did not interfere with the efficiency of liposome uptake by cells. On the other hand, accumulation of Cy3 was not observed in cells treated with Cy3-labeled serum albumin, indicating that ALs enhanced the uptake of fluorescent-dye. RS182 cells exhibited the greatest uptake of liposomes among the four cell lines tested; therefore, RS182 cells were used in the following experiments.
Uptake of ALs and CLs in RS182 cells
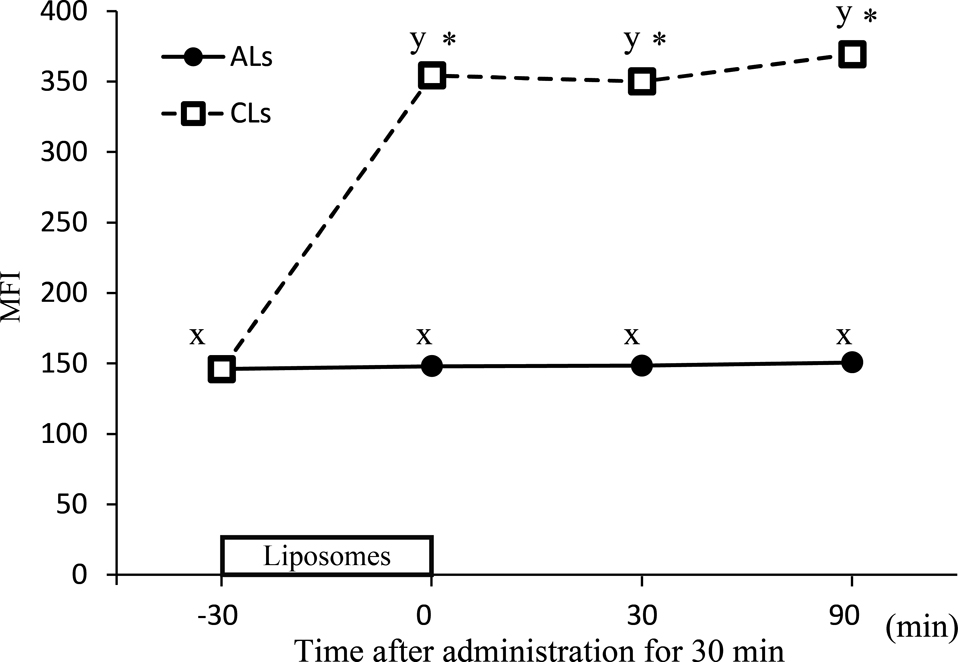
To compare uptake of ALs and CLs, rhodamine-containing liposomes were applied to RS182 cells. A significant increase of rhodamine signal was observed after administration of CLs, and the intensity of the signal was 2.3-fold higher than the basal MFI (Fig. 3). The intensity was retained after the removal of the liposomes, indicating negligible decay and/or leakage of rhodamine. In contrast, no significant increase of rhodamine signal was observed after administration of ALs.
Intracellular localization of liposomes and their contents—CLSM analysis
To investigate trafficking and processing of ALs and CLs, we examined intracellular localization of rhodamine using CLSM, 30 min after administration of rhodamine-containing liposomes to RS182 cells. Although no significant uptake of rhodamine-containing ALs was detected by FCM analysis, CLSM analysis was able to detect rhodamine signals in cells (Fig. 4). After administration of rhodamine-containing ALs, rhodamine signals were observed as spots within lysosomes, but not in other cell regions (Fig. 4A, C). On the other hand, after administration of rhodamine-containing CLs, rhodamine signals were widely distributed in the cytosol in addition to many rhodamine signal spots (Fig. 4B). Most of the rhodamine signal spots were observed in the cytosol, with only a few spots in lysosomes (Fig. 4D).
Intracellular localization of liposomes and their contents—TEM analysis
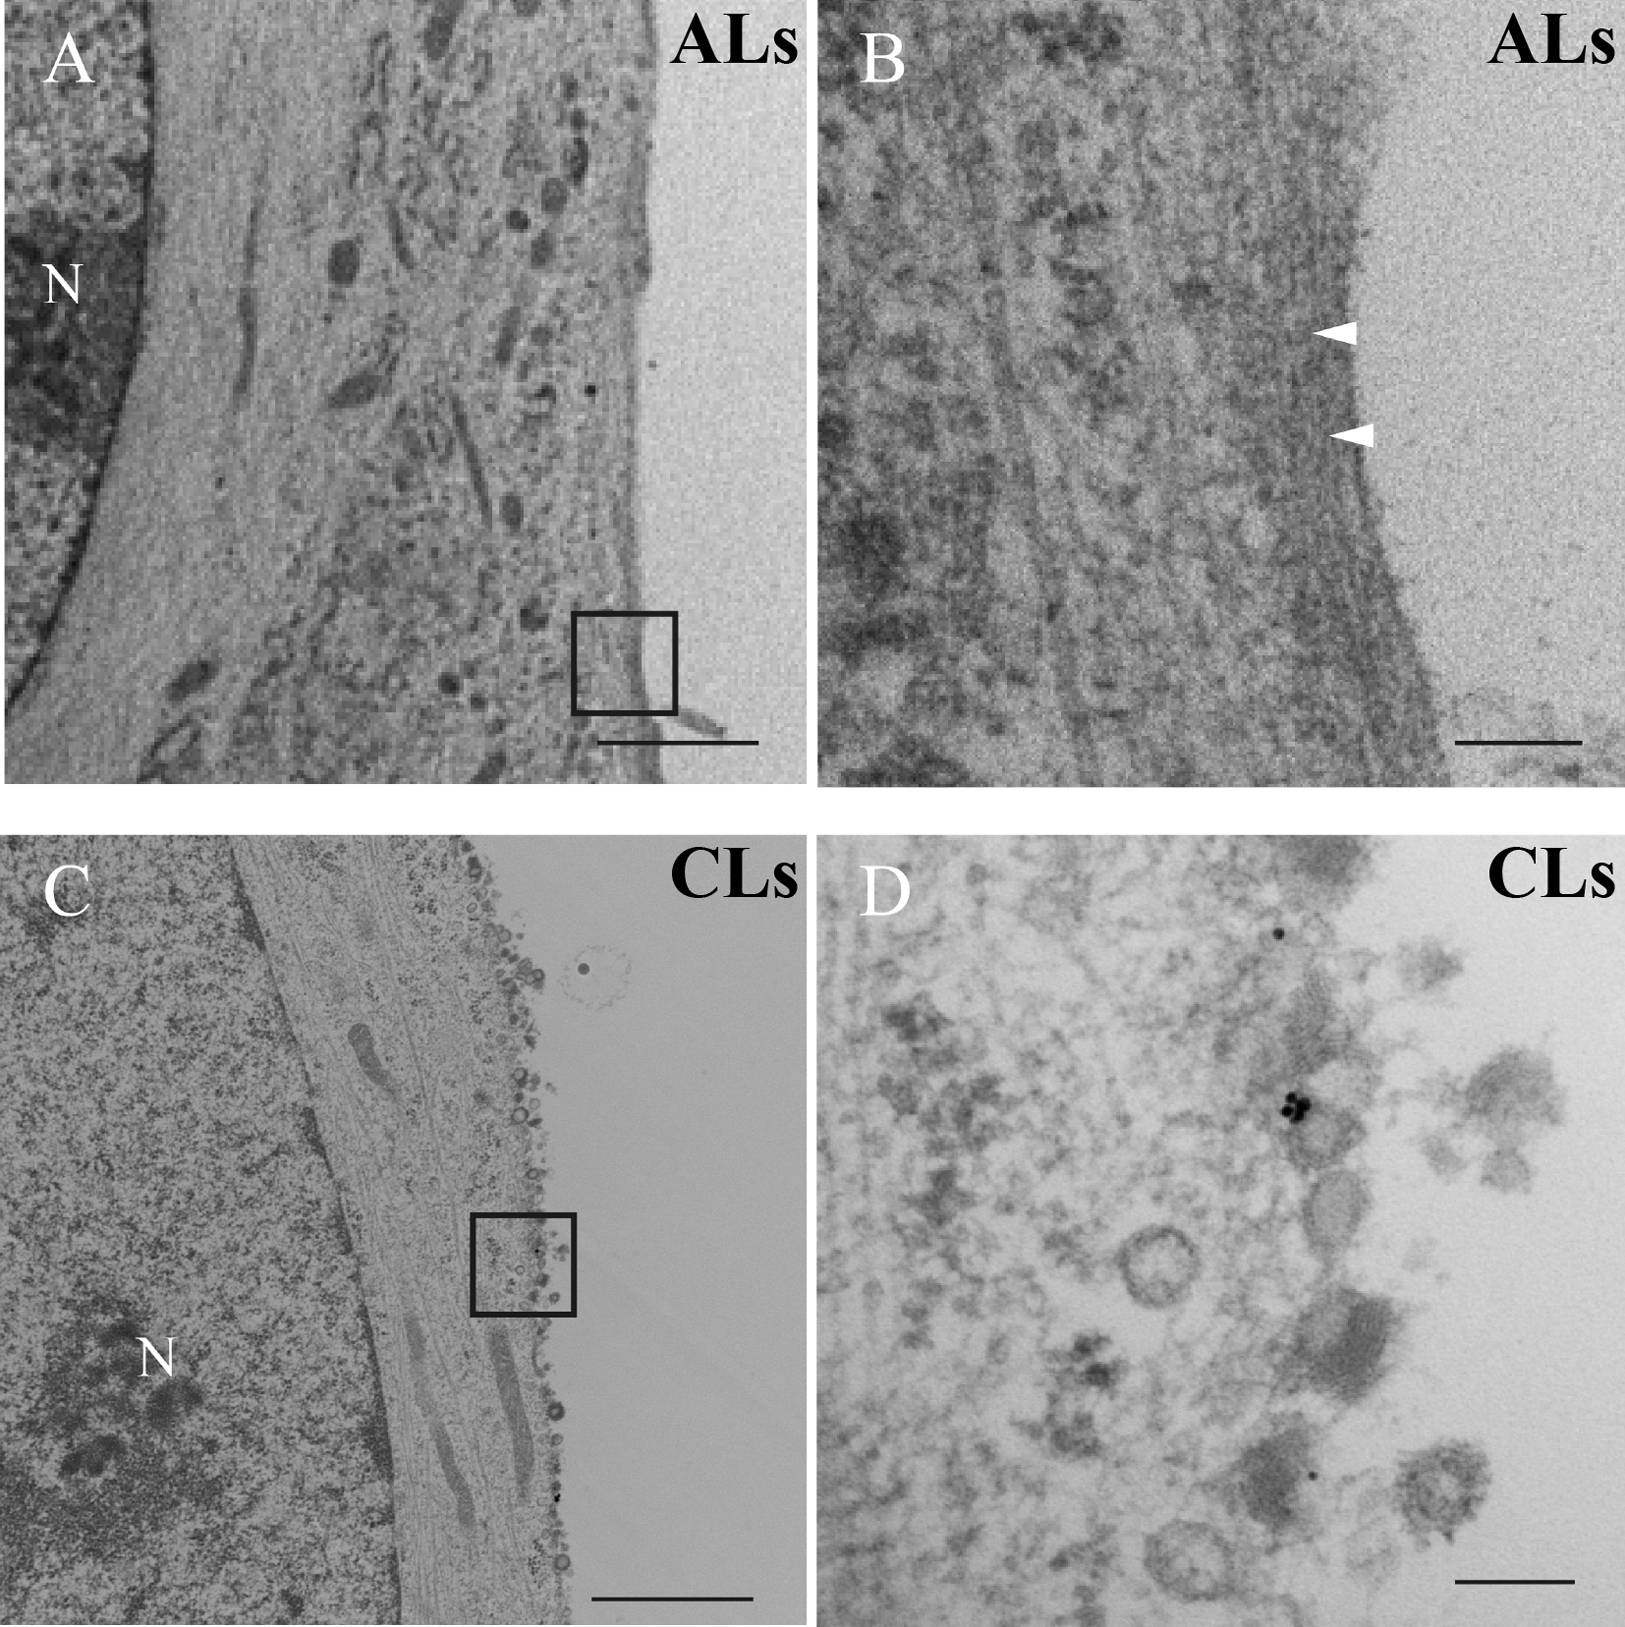
TEM analysis was performed after ALs or CLs treatment of RS182 cells for 30 min. After treatment with ALs, cell membranes of the treated cells were preserved and bundles of actin filaments were located just beneath the cell membrane (Fig. 5A, B). On the other hand, after treatment with CLs, cell membranes exhibited vague borderlines between intracellular and extracellular areas. In addition, many vesicles were found around the cell surface. There were no gold particles on most of the vesicles (Fig. 5C, D).
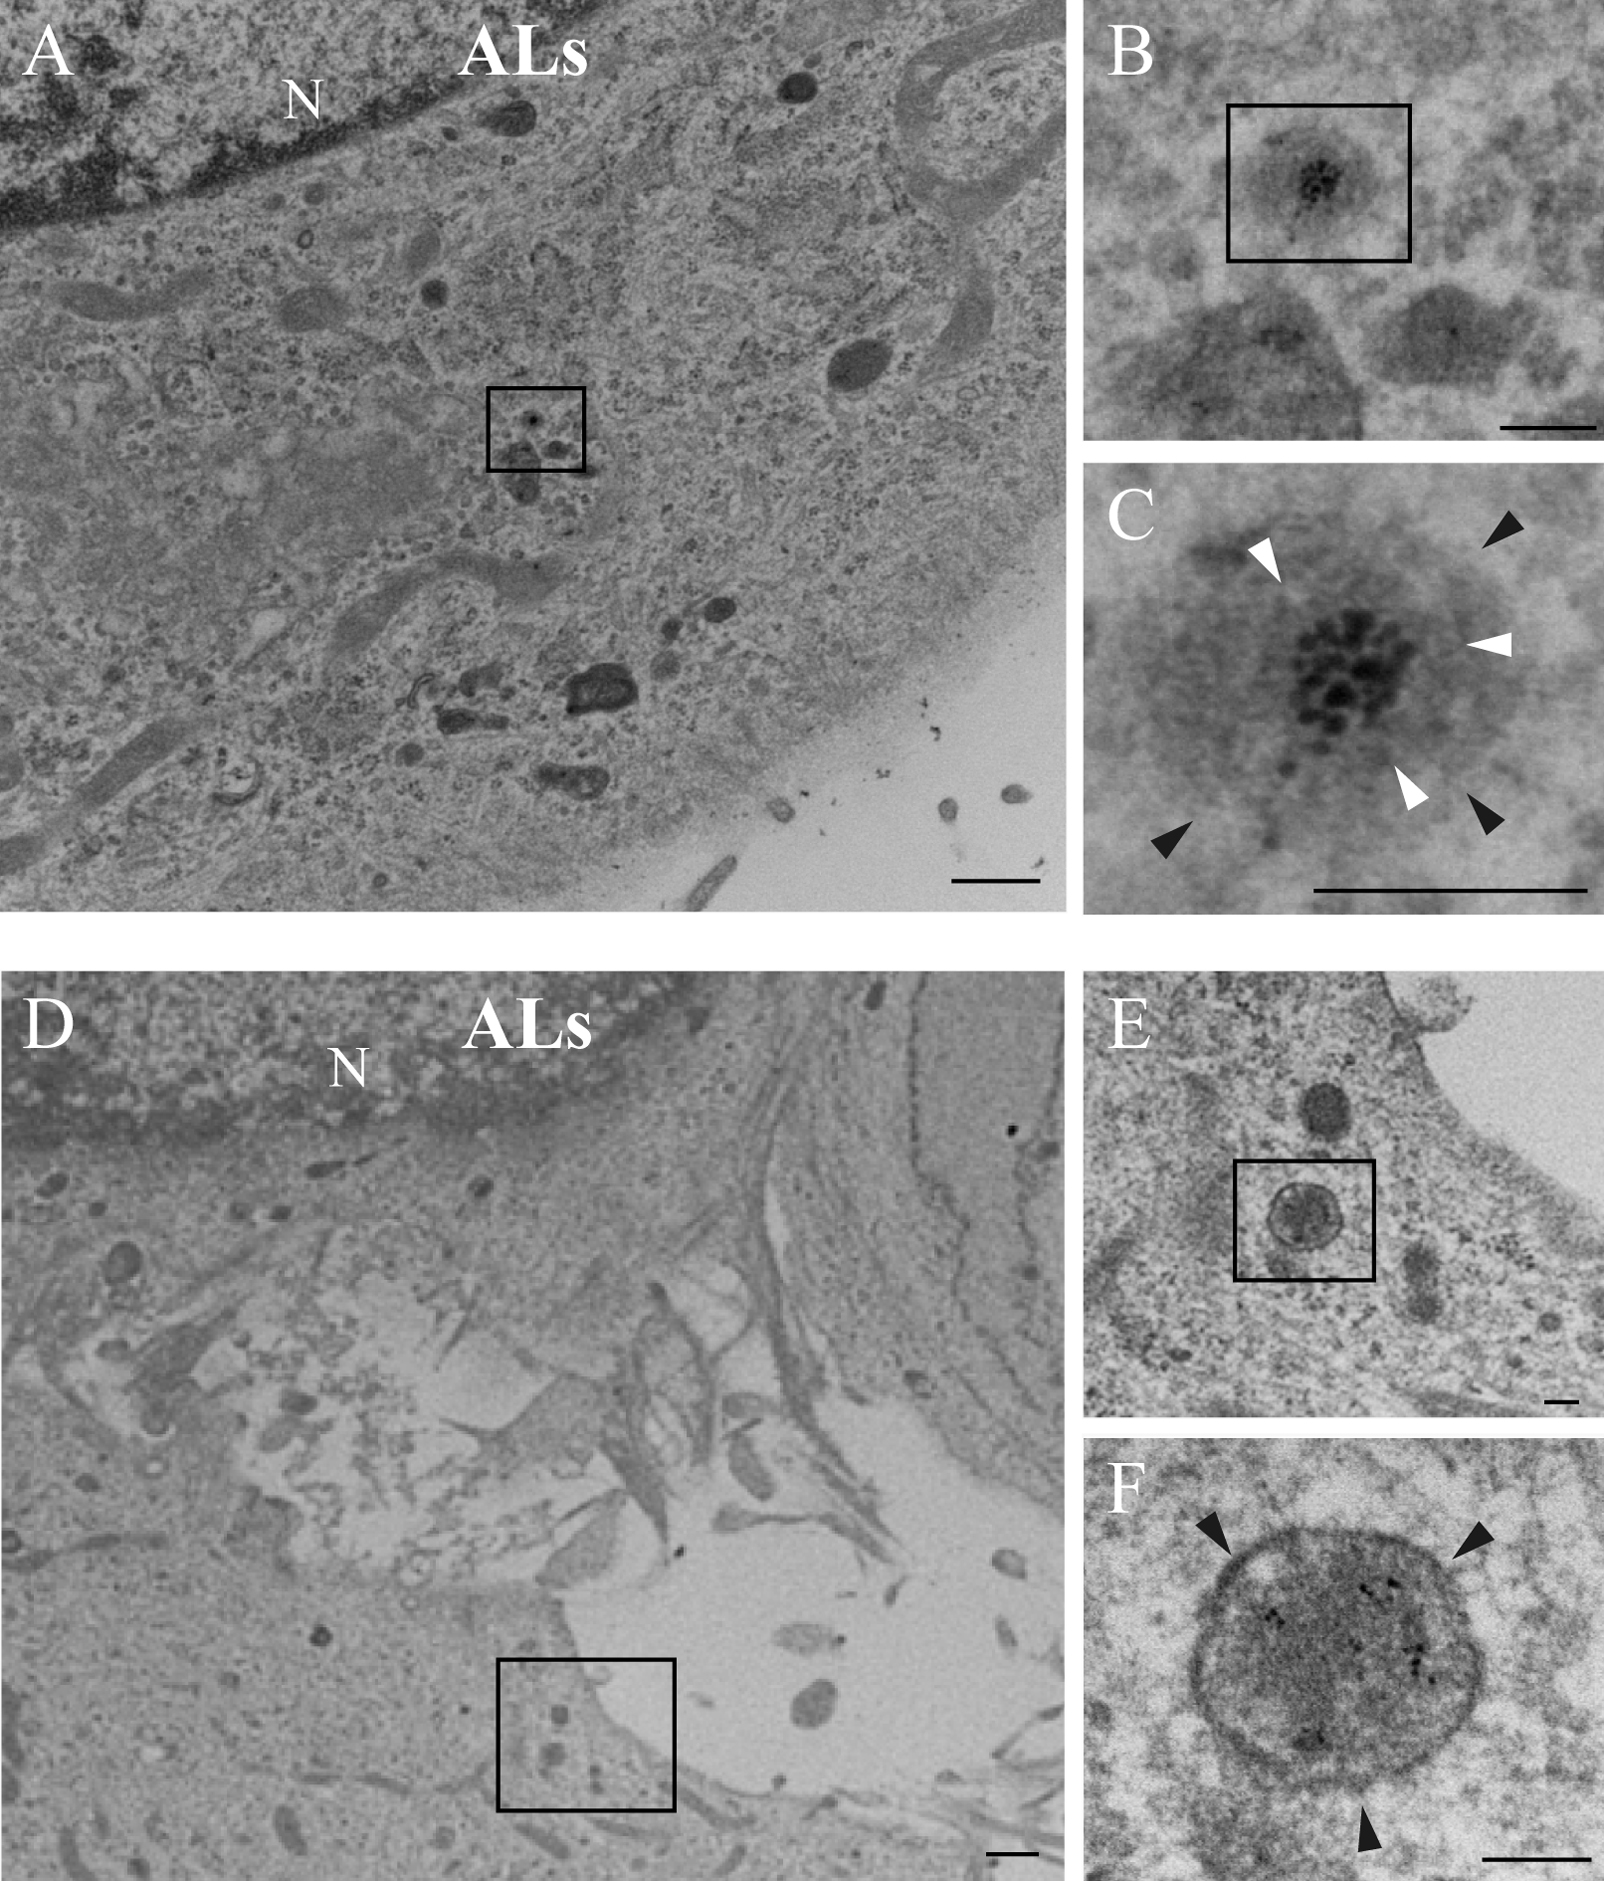
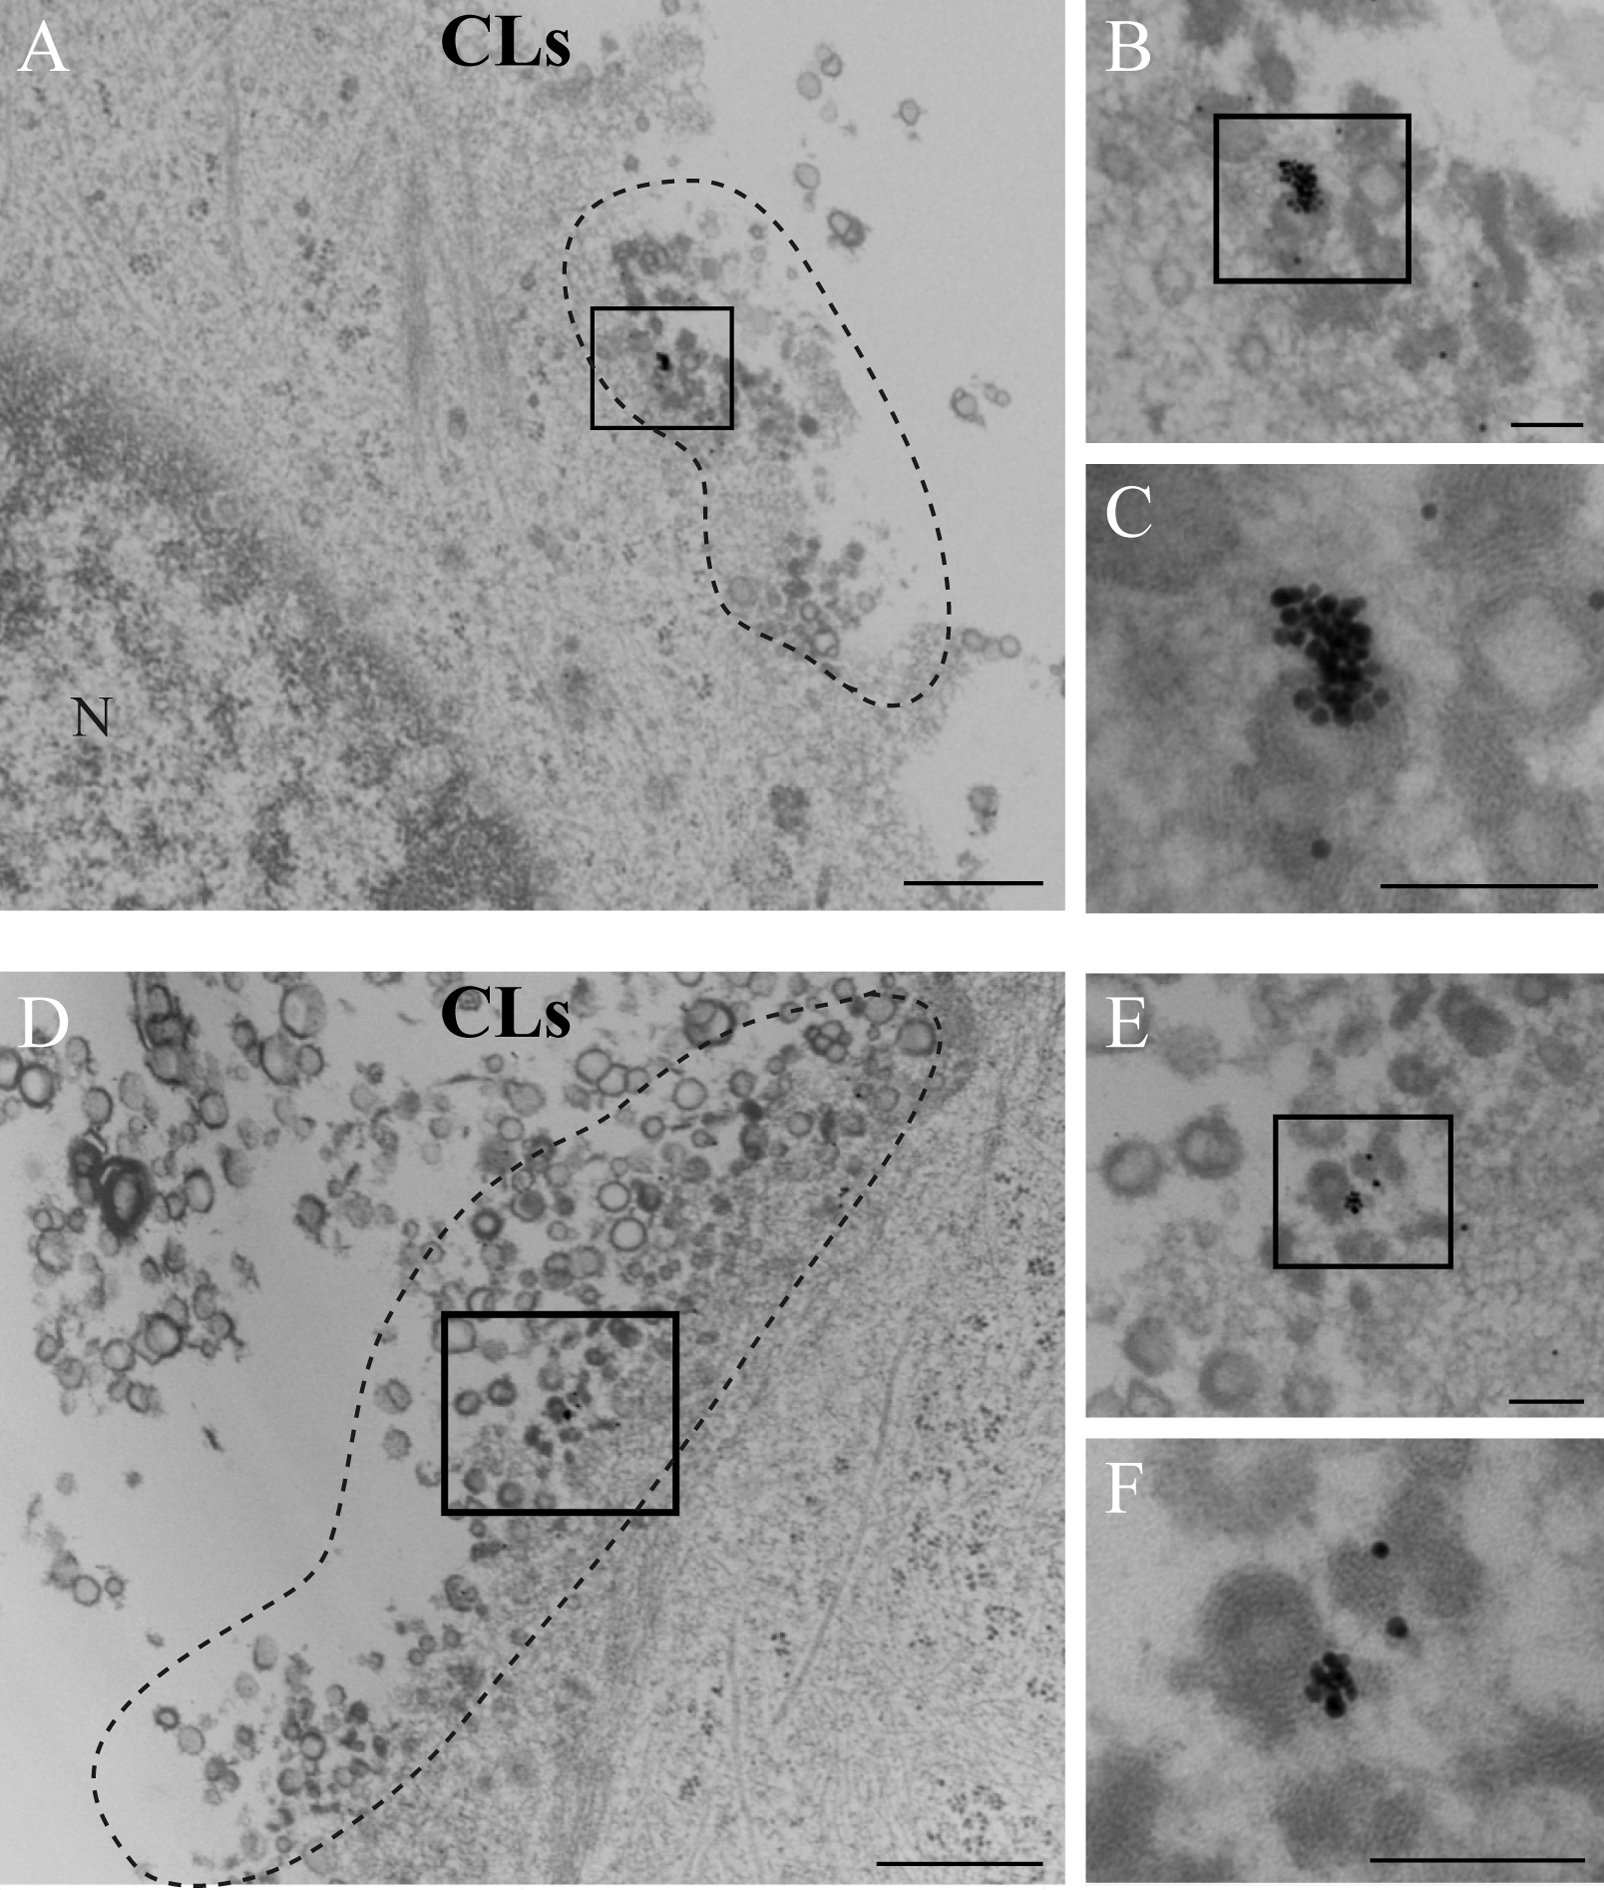
After treatment of cells with colloidal gold-containing ALs for 0 and 30 min, both gold particles and liposome-like vesicles were observed in lysosomes, but not in the cytosol (Fig. 6A–F). On the other hand, after administration of colloidal gold-containing CLs, gold particles were observed with liposome-like vesicles (Fig. 7A–F) or as individual gold particles (Fig. 8A–C) at peripheral cell regions, but not in lysosomes (Fig. 8D–F).
IV. Discussion
Transfection efficacy of CLs is substantially higher than that of ALs; however, the reason for this remains unclear [1, 20, 43]. To investigate this issue, we examined the trafficking and processing of ALs and CLs in cultured cells. The main findings of the study were: (1) uptake of CLs into RS182 cells was more rapid and efficient than that of ALs. This high level of CL-uptake could reflect high transfection efficacy of CLs. (2) ALs and CLs displayed different intracellular trafficking and processing patterns, which might reflect the difference in transfection efficacy.
CLSM analysis of the distribution of rhodamine-containing ALs showed that rhodamine signals were specifically localized in lysosomes 30 min after administration. Moreover, TEM analysis of the processing of colloidal gold-containing ALs showed that ALs and gold particles were localized in lysosomes, but not in the cytosol. These results indicate that ALs would be engulfed and promptly transferred to the endosome-lysosome system to be rapidly digested (Fig. 9).

On the other hand, CLSM analysis of the distribution of rhodamine-containing CLs, revealed that rhodamine signals were distributed in the cytosol. A few rhodamine spots were colocalized with lysosomes, which may result from accumulation of rhodamine released from CLs. TEM analysis of the processing of colloidal gold-containing CLs showed that the cell membrane was disturbed. Colloidal gold-containing CLs seemed to collapse and then release their gold particles into the cytosol at peripheral cell regions. Thus, gold particles were not in lysosomes. These results suggest that trafficking and processing occurs differently in CLs compared with ALs. The contents of CLs might enter into the cytosol directly, thereby avoiding the endosome-lysosome system. Such delivery of CL contents might result in efficient gene transfer because the process does not depend on endocytosis (Fig. 9).
Both ALs and CLs are believed to be taken up via endocytosis [12, 50, 60]; therefore, escape from the endosome-lysosome system has been considered to be a key step for high transfection efficiency [3, 9, 27, 54]. In this regard, our results suggest that ALs are promptly transferred to the endosome-lysosome system and that CLs cause cell membrane disturbance and directly transfer their contents into the cytosol. In the present study, we used dendron-bearing liposomes as CLs, which are designed to escape the endosome-lysosome system. However, we did not verify endosomal escape by CLs. Due to the positive surface charge, CLs may undergo electrostatic interaction with the negatively charged cell membrane [2, 16, 53, 60], which may induce disturbance of the cell membrane and result in CL collapse and the release of their contents.
Our findings indicate that ALs might be suitable as carriers for lysosome-resistant reagents and lysosome-targeted drugs in a drug delivery system. However, ALs are not suitable for nucleic acid transfer. On the other hand, CLs cause disturbance to the cell membrane and directly transfer their contents into the cytosol, indicating that CLs are suitable as vectors for nucleic acids, at least in vitro. However, when CLs are administered systemically, they interact with serum and cellular components leading to their elimination from the systemic circulation [10, 16, 30, 42, 49]. Further improvement is required for in vivo application of CLs for nucleic acid transfer.
There are some unsolved issues concerning the mechanism of cell membrane disturbance and the release of CL contents into the cytosol. To examine events at the cell membrane just after CL application, further analysis with a combination of morphological and pharmacological techniques is required.
We investigated the localization of ALs, CLs (dendron-bearing liposomes) and their contents in cultured cells using morphological techniques. Our results show greater uptake of CLs into cultured cells compared with ALs. Moreover, our morphological analyses indicate that ALs and CLs undergo different intracellular trafficking and processing. ALs would be engulfed and promptly transferred to the endosome-lysosome system to be rapidly digested. In contrast, CLs disrupt the cell membrane and release their contents into the cytosol, thereby escaping endosomal capture. Our findings are important for further development of drug delivery systems.
V. Chemical Compounds Studied in This Article
1-Butyl-3-methylimidazolium tetrafluoroborate (PubChem CID: 2734178); 4',6-diamidinophenylindole (PubChem CID: 2954); cholesterol (PubChem CID: 5997); Cy3 (PubChem CID: 91811029); dicetylphosphate (PubChem CID: 75143); dipalmitoyl-phosphatidyl-choline (PubChem CID: 3032282); dipalmitoyl-phosphatidyl-ethanolamine (PubChem CID: 9547031); ganglioside GM3 (PubChem CID: 86583360); phosphatidylethanolamine (PE) (PubChem CID: 9547031); polyamidoamine dendrimer (PubChem CID: 58720429); propidium iodide (PubChem CID: 104981).
VI. Conflicts of Interest
The authors declare that they have no conflicts of interest.
VII. Acknowledgments
This work was supported by Grants-in-Aid (KAKENHI) from the Japan Society for the Promotion of Science (JSPS) [Grant Nos, 26460323 (H.O.), 26670115 (N.I.), 15K20062 (S.H.), and 16K19010 (K.T.)]. We thank Prof. Hajime Tei (Graduate School of Natural Science and Technology, Kanazawa University, Ishikawa, Japan) for providing RS182 cells. We are grateful to the Japanese Collection of Research Bioresources Cell Bank for donating NIH3T3 and NY cells. We are grateful to Katayama Chemical Industries for donating A431 cells and providing Glycolipo-A0, and to Dr. Masahiko Hirai (Katayama Chemical Industries) for fruitful discussions.
VIII. References
- 1 Ackermann, B., Engel, B. C., Buttlies, B., Zibert, A. and Burdach, S. (2002) Transgenic IL-2 expression in Ewing tumor cell lines after transfection with Starburst dendrimers and cationic liposomes. Pediatr. Hematol. Oncol. 19; 509–520.
- 2 Behr, J. P., Demeneix, B., Loeffler, J. P. and Perez-Mutul, J. (1989) Efficient gene transfer into mammalian primary endocrine cells with lipopolyamine-coated DNA. Proc. Natl. Acad. Sci. U S A 86; 6982–6986.
- 3 Bell, P. C., Bergsma, M., Dolbnya, I. P., Bras, W., Stuart, M. C., Rowan, A. E., Feiters, M. C. and Engberts, J. B. (2003) Transfection mediated by gemini surfactants: engineered escape from the endosomal compartment. J. Am. Chem. Soc. 125; 1551–1558.
- 4 Chai, R., Zhang, G., Sun, Q., Zhang, M., Zhao, S. and Qiu, L. (2013) Liposome-mediated mycelial transformation of filamentous fungi. Fungal Biol. 117; 577–583.
- 5 Chapekar, M. S., Knode, M. C. and Glazer, R. I. (1988) The epidermal growth factor- and interferon-independent effects of double-stranded RNA in A431 cells. Mol. Pharmacol. 34; 461–466.
- 6 Doura, T., Yamada, M., Teranishi, R., Yamamoto, Y., Sugimoto, T., Yuba, E., Harada, A. and Kono, K. (2015) PAMAM dendron lipid assemblies that undergo structural transition in response to weakly acidic pH and their cytoplasmic delivery capability. Langmuir 31; 5105–5114.
- 7 Dow, S., Elmslie, R., Kurzman, I., MacEwen, G., Pericle, F. and Liggitt, D. (2005) Phase I study of liposome-DNA complexes encoding the interleukin-2 gene in dogs with osteosarcoma lung metastases. Hum. Gene. Ther. 16; 937–946.
- 8 Dutour, A., Monteil, J., Paraf, F., Charissoux, J. L., Kaletta, C., Sauer, B., Naujoks, K. and Rigaud, M. (2005) Endostatin cDNA/cationic liposome complexes as a promising therapy to prevent lung metastases in osteosarcoma: study in a human-like rat orthotopic tumor. Mol. Ther. 11; 311–319.
- 9 Endoh, T. and Ohtsuki, T. (2009) Cellular siRNA delivery using cell-penetrating peptides modified for endosomal escape. Adv. Drug Deliv. Rev. 61; 704–709.
- 10 Escriou, V., Ciolina, C., Lacroix, F., Byk, G., Scherman, D. and Wils, P. (1998) Cationic lipid-mediated gene transfer: effect of serum on cellular uptake and intracellular fate of lipopolyamine/DNA complexes. Biochim. Biophys. Acta 1368; 276–288.
- 11 Fridrik, M. A., Jaeger, U., Petzer, A., Willenbacher, W., Keil, F., Lang, A., Andel, J., Burgstaller, S., Krieger, O., Oberaigner, W., Sihorsch, K. and Greil, R. (2016) Cardiotoxicity with rituximab, cyclophosphamide, non-pegylated liposomal doxorubicin, vincristine and prednisolone compared to rituximab, cyclophosphamide, doxorubicin, vincristine, and prednisolone in frontline treatment of patients with diffuse large B-cell lymphoma: A randomised phase-III study from the Austrian Cancer Drug Therapy Working Group [Arbeitsgemeinschaft Medikamentöse Tumortherapie AGMT] (NHL-14). Eur. J. Cancer 58; 112–121.
- 12 Friend, D. S., Papahadjopoulos, D. and Debs, R. J. (1996) Endocytosis and intracellular processing accompanying transfection mediated by cationic liposomes. Biochim. Biophys. Acta 1278; 41–50.
- 13 Gill, P. S., Wernz, J., Scadden, D. T., Cohen, P., Mukwaya, G. M., von Roenn, J. H., Jacobs, M., Kempin, S., Silverberg, I., Gonzales, G., Rarick, M. U., Myers, A. M., Shepherd, F., Sawka, C., Pike, M. C. and Ross, M. E. (1996) Randomized phase III trial of liposomal daunorubicin versus doxorubicin, bleomycin, and vincristine in AIDS-related Kaposi’s sarcoma. J. Clin. Oncol. 14; 2353–2364.
- 14 Glantz, M. J., LaFollette, S., Jaeckle, K. A., Shapiro, W., Swinnen, L., Rozental, J. R., Phuphanich, S., Rogers, L. R., Gutheil, J. C., Batchelor, T., Lyter, D., Chamberlain, M., Maria, B. L., Schiffer, C., Bashir, R., Thomas, D., Cowens, W. and Howell, S. B. (1999) Randomized trial of a slow-release versus a standard formulation of cytarabine for the intrathecal treatment of lymphomatous meningitis. J. Clin. Oncol. 17; 3110–3116.
- 15 Iwashita, S., Hiramatsu, Y., Otani, T., Amano, C., Hirai, M., Oie, K., Yuba, E., Kono, K., Miyamoto, M. and Igarashi, K. (2012) Polyamidoamine dendron-bearing lipid assemblies: their morphologies and gene transfection ability. J. Biomater. Appl. 27; 445–456.
- 16 Jin, L., Zeng, X., Liu, M., Deng, Y. and He, N. (2014) Current progress in gene delivery technology based on chemical methods and nano-carriers. Theranostics 4; 240–255.
- 17 Jo, D. H., Kim, J. H. and Lee, T. G. (2015) Size, surface charge, and shape determine therapeutic effects of nanoparticles on brain and retinal diseases. Nanomedicine 11; 1603–1611.
- 18 Kawaguchi, S., Shinozaki, A., Obinata, M., Saigo, K., Sakaki, Y. and Tei, H. (2007) Establishment of cell lines derived from the rat suprachiasmatic nucleus. Biochem. Biophys. Res. Commun. 355; 555–561.
- 19 Keller, A. M., Mennel, R. G., Georgoulias, V. A., Nabholtz, J. M., Erazo, A., Lluch, A., Vogel, C. L., Kaufmann, M., von Minckwitz, G., Henderson, I. C., Mellars, L., Alland, L. and Tendler, C. (2004) Randomized phase III trial of pegylated liposomal doxorubicin versus vinorelbine or mitomycin C plus vinblastine in women with taxane-refractory advanced breast cancer. J. Clin. Oncol. 22; 3893–3901.
- 20 Keller, H., Yunxu, C., Marit, G., Pla, M., Reiffers, J., Thèze, J. and Froussard, P. (1999) Transgene expression, but not gene delivery, is improved by adhesion-assisted lipofection of hematopoietic cells. Gene Ther. 6; 931–938.
- 21 Kono, K., Ikeda, R., Tsukamoto, K., Yuba, E., Kojima, C. and Harada, A. (2012) Polyamidoamine dendron-bearing lipids as a nonviral vector: influence of dendron generation. Bioconjug. Chem. 23; 871–879.
- 22 Koynova, R., Tarahovsky, Y. S., Wang, L. and MacDonald, R. C. (2007) Lipoplex formulation of superior efficacy exhibits high surface activity and fusogenicity, and readily releases DNA. Biochim. Biophys. Acta 1768; 375–386.
- 23 Kroon, J., Metselaar, J. M., Storm, G. and van der Pluijm, G. (2014) Liposomal nanomedicines in the treatment of prostate cancer. Cancer Treat Rev. 40; 578–584.
- 24 Kuo, J. H., Liou, M. J. and Chiu, H. C. (2010) Evaluating the gene-expression profiles of HeLa cancer cells treated with activated and nonactivated poly(amidoamine) dendrimers, and their DNA complexes. Mol. Pharm. 7; 805–814.
- 25 Latagliata, R., Breccia, M., Fazi, P., Iacobelli, S., Martinelli, G., Di Raimondo, F., Sborgia, M., Fabbiano, F., Pirrotta, M. T., Zaccaria, A., Amadori, S., Caramatti, C., Falzetti, F., Candoni, A., Mattei, D., Morselli, M., Alimena, G., Vignetti, M., Baccarani, M. and Mandelli, F. (2008) Liposomal daunorubicin versus standard daunorubicin: long term follow-up of the GIMEMA GSI 103 AMLE randomized trial in patients older than 60 years with acute myelogenous leukaemia. Br. J. Haematol. 143; 681–689.
- 26 Lechardeur, D. and Lukacs, G. L. (2002) Intracellular barriers to non-viral gene transfer. Curr. Gene Ther. 2; 183–194.
- 27 Ma, D. (2014) Enhancing endosomal escape for nanoparticle mediated siRNA delivery. Nanoscale 6; 6415–6425.
- 28 Mahner, S., Meier, W., du Bois, A., Brown, C., Lorusso, D., Dell’Anna, T., Cretin, J., Havsteen, H., Bessette, P., Zeimet, A. G., Vergote, I., Vasey, P., Pujade-Lauraine, E., Gladieff, L. and Ferrero, A. (2015) Carboplatin and pegylated liposomal doxorubicin versus carboplatin and paclitaxel in very platinum-sensitive ovarian cancer patients: results from a subset analysis of the CALYPSO phase III trial. Eur. J. Cancer 51; 352–358.
- 29 Mayhew, E., Ito, M. and Lazo, R. (1987) Toxicity of non-drug-containing liposomes for cultured human cells. Exp. Cell Res. 171; 195–202.
- 30 Merdan, T., Kopecek, J. and Kissel, T. (2002) Prospects for cationic polymers in gene and oligonucleotide therapy against cancer. Adv. Drug Deliv. Rev. 54; 715–758.
- 31 Movassaghian, S., Moghimi, H. R., Shirazi, F. H. and Torchilin, V. P. (2011) Dendrosome-dendriplex inside liposomes: as a gene delivery system. J. Drug Target 19; 925–932.
- 32 Mozafari, M. R., Reed, C. J. and Rostron, C. (2007) Cytotoxicity evaluation of anionic nanoliposomes and nanolipoplexes prepared by the heating method without employing volatile solvents and detergents. Pharmazie 62; 205–209.
- 33 Mulcahy, L. S., Smith, M. R. and Stacey, D. W. (1985) Requirement for ras proto-oncogene function during serum-stimulated growth of NIH 3T3 cells. Nature 313; 241–243.
- 34 Nakase, M., Inui, M., Okumura, K., Kamei, T., Nakamura, S. and Tagawa, T. (2005) p53 gene therapy of human osteosarcoma using a transferrin-modified cationic liposome. Mol. Cancer Ther. 4; 625–631.
- 35 Nakase, M., Okumura, K., Kamei, T., Nakamura, S., Inui, M. and Tagawa, T. (2005) The influence of oral tumor cell proliferation activity and membrane potential on the transfection efficiency of a cationic liposome. Oncol. Rep. 14; 1487–1491.
- 36 Navarro, G. and Tros de Ilarduya, C. (2009) Activated and non-activated PAMAM dendrimers for gene delivery in vitro and in vivo. Nanomedicine 5; 287–297.
- 37 Okumura, K., Nakase, M., Nakamura, S., Inui, M., Hiramoto, K. and Tagawa, T. (2005) Antitumor activity of cationic liposome-mediated Bax gene transfer in osteosarcoma cells: induction of apoptosis and caspase-independent cell death. Int. J. Oncol. 27; 433–438.
- 38 Okumura, K., Nakase, M., Nakamura, S., Kamei, T., Inui, M. and Tagawa, T. (2007) Bax gene therapy for human osteosarcoma using cationic liposomes in vivo. Oncol. Rep. 17; 769–773.
- 39 Parnham, M. J. and Wetzig, H. (1993) Toxicity screening of liposomes. Chem. Phys. Lipids. 64; 263–274.
- 40 Patil, S. D., Rhodes, D. G. and Burgess, D. J. (2004) Anionic liposomal delivery system for DNA transfection. AAPS J. 6; e29.
- 41 Radchatawedchakoon, W., Krajarng, A., Niyomtham, N., Watanapokasin, R. and Yingyongnarongkul, B. E. (2011) High transfection efficiency of cationic lipids with asymmetric acyl-cholesteryl hydrophobic tails. Chemistry 17; 3287–3295.
- 42 Rao, N. M. (2010) Cationic lipid-mediated nucleic acid delivery: beyond being cationic. Chem. Phys. Lipids. 163; 245–252.
- 43 Reisinger, H., Sevcsik, E., Vorauer-Uhl, K., Lohner, K., Katinger, H. and Kunert, R. (2007) Serum-free transfection of CHO-cells with tailor-made unilamellar vesicles. Cytotechnology 54; 157–168.
- 44 Rivankar, S. (2014) An overview of doxorubicin formulations in cancer therapy. J. Cancer Res. Ther. 10; 853–858.
- 45 Rousseau, J., Escriou, V., Perrot, P., Picarda, G., Charrier, C., Scherman, D., Heymann, D., Rédini, F. and Trichet, V. (2010) Advantages of bioluminescence imaging to follow siRNA or chemotherapeutic treatments in osteosarcoma preclinical models. Cancer Gene Ther. 17; 387–397.
- 46 Santos, J. L., Pandita, D., Rodrigues, J., Pêgo, A. P., Granja, P. L., Balian, G. and Tomás, H. (2010) Receptor-mediated gene delivery using PAMAM dendrimers conjugated with peptides recognized by mesenchymal stem cells. Mol. Pharm. 7; 763–774.
- 47 Sekiguchi, M., Asanuma, K., Satomura, T., Fukushima, H., Fujji, G., Shimoda, T., Fukunaga, M. and Ishikawa, E. (1983) A cultured cell line established in vitro from human osteosarcoma. Jpn. J. Exp. Med. 53; 289–292.
- 48 Slingerland, M., Guchelaar, H. J. and Gelderblom, H. (2012) Liposomal drug formulations in cancer therapy: 15 years along the road. Drug Discov. Today 17; 160–166.
- 49 Srinivas, R., Samanta, S. and Chaudhuri, A. (2009) Cationic amphiphiles: promising carriers of genetic materials in gene therapy. Chem. Soc. Rev. 38; 3326–3338.
- 50 Straubinger, R. M., Hong, K., Friend, D. S. and Papahadjopoulos, D. (1983) Endocytosis of liposomes and intracellular fate of encapsulated molecules: encounter with a low pH compartment after internalization in coated vesicles. Cell 32; 1069–1079.
- 51 Takahashi, T., Kono, K., Itoh, T., Emi, N. and Takagishi, T. (2003) Synthesis of novel cationic lipids having polyamidoamine dendrons and their transfection activity. Bioconjug. Chem. 14; 764–773.
- 52 Tarahovsky, Y. S., Koynova, R. and MacDonald, R. C. (2004) DNA release from lipoplexes by anionic lipids: correlation with lipid mesomorphism, interfacial curvature, and membrane fusion. Biophys. J. 87; 1054–1064.
- 53 van der Woude, I., Visser, H. W., ter Beest, M. B., Wagenaar, A., Ruiters, M. H., Engberts, J. B. and Hoekstra, D. (1995) Parameters influencing the introduction of plasmid DNA into cells by the use of synthetic amphiphiles as a carrier system. Biochim. Biophys. Acta 1240; 34–40.
- 54 Varkouhi, A. K., Scholte, M., Storm, G. and Haisma, H. J. (2011) Endosomal escape pathways for delivery of biologicals. J. Control. Release 151; 220–228.
- 55 Wang, T., Upponi, J. R. and Torchilin, V. P. (2012) Design of multifunctional non-viral gene vectors to overcome physiological barriers: dilemmas and strategies. Int. J. Pharm. 427; 3–20.
- 56 Wang, W., Ajmani, P. S., Meyer, E. M., Simpkins, J. W. and Hughes, J. A. (1999) Pre-exposure of cells to cationic lipids enhances transgene delivery and expression in a tissue culture cell line. J. Drug Target. 7; 207–211.
- 57 Won, Y. W., Lim, K. S. and Kim, Y. H. (2011) Intracellular organelle-targeted non-viral gene delivery systems. J. Control. Release 152; 99–109.
- 58 Yuba, E., Nakajima, Y., Tsukamoto, K., Iwashita, S., Kojima, C., Harada, A. and Kono, K. (2012) Effect of unsaturated alkyl chains on transfection activity of poly(amidoamine) dendron-bearing lipids. J. Control. Release 160; 552–560.
- 59 Zellmer, S., Gaunitz, F., Salvetter, J., Surovoy, A., Reissig, D. and Gebhardt, R. (2001) Long-term expression of foreign genes in normal human epidermal keratinocytes after transfection with lipid/DNA complexes. Histochem. Cell Biol. 115; 41–47.
- 60 Zhou, X. and Huang, L. (1994) DNA transfection mediated by cationic liposomes containing lipopolylysine: characterization and mechanism of action. Biochim. Biophys. Acta 1189; 195–203.