Abstract
Diabetic nephropathy is a major source of end-stage renal failure, affecting about one-third cases of diabetes mellitus. It has long been accepted that diabetic nephropathy is mainly characterized by glomerular defects, while clinical observations have implied that renal tubular damage is closely linked to kidney dysfunction at the early stages of diabetic nephropathy. In this study, we conducted pathohistological analyses focusing on renal tubular lesions in the early-stage diabetic kidney with the use of a streptozotocin (STZ)-induced diabetes mellitus mouse model. The results revealed that histological alterations in renal tubules, shown by a vacuolar nucleic structure, accumulations of PAS-positive substance, and accelerated restoration stress, occur initially without the presence of glomerular lesions in the early-stage diabetic kidney, and that these tubular defects are localized mainly in proximal renal tubules. Moreover, enhanced expression of RAGE, suggesting an aberrant activation of AGEs-RAGE signaling pathway, and accumulation of oxidative modified mitochondria through the impaired autophagy/lysosome system, were also seen in the damaged diabetic proximal renal tubules. Our findings indicate that proximal tubular defects are the initial pathological events increasingly linked to the progression of diabetic nephropathy, and that controlling renal tubular damage could be an effective therapeutic strategy for the clinical treatment of diabetic nephropathy.
I. Introduction
Diabetic nephropathy is a major cause of end-stage renal disease [21, 25, 26]. The pathogenesis of renal disease with diabetes mellitus has traditionally been characterized by glomerular pathological changes such as mesangial hypertrophy, glomerular hyper-filtration and proteinuria [16]. Recent advances in studies on diabetic nephropathy, however, propose that glomerular-alterations are not a major causative factor in diabetic nephropathy, and cellular dysfunction or impairment of renal tubules (particularly, proximal tubules) rather than that of glomerulus may be a critical primary pathological event in the progression of diabetic renal failure. Cellular morphological alterations of proximal renal tubules are considered the early symptoms of diabetic nephropathy, and continuous tubulo-intertial fibrosis caused by ectopic loss or damage of functional renal tubules due to renal tubular atrophy, plays a critical role in the progression to end-stage renal failure [10, 11, 18]. Moreover, proximal renal tubules play a protective role against proteinuria in diabetes by maintaining glomerular and podocyte function [14, 23].
Anatomically, proximal renal tubules are recognized as part of the nephron that is directly connected to the parietal epithelial layer of Bowman’s capsule. Cells of proximal renal tubules are characterized by a brush border with sodium/proton exchanger activity, an extensive lysosomal apparatus for protein absorption/degradation and abundant mitochondria that funtion as the main cellular source of energy [41]. Most of glomerular-filtered substances in urine are reabsorbed into proximal renal tubules through an endocytic pathway, and proximal tubular endosomal-lysosomal activity is controled by an endocytic receptor, such as megalin, in proximal renal tubules [8, 28]. Proximal tubular autolysosomal dysfunction caused by excessive uptake of diabetic pathogenic substances, advanced glycation end products (AGEs), has been suggested as involved in the development of diabetic nephropathy. During long-term hyperglycemia in diabetes mellitus, AGEs are formed as carbonyl compounds comprising glucose and plasma protein through a nonenzymatic glycation reaction, that are then reabsorbed by proximal renal tubules after glomerular-filtration, causing glycotoxicity on the cells of renal tubules [19, 27, 35]. The paucity of histological evaluation of the diabetic kidney has, however, hindered further knowledge pertaining to any correlation between impaired renal tubules and the progression/development of renal failure in diabetes mellitus.
In the current study, we conducted pathohistological analyses focusing on renal tubular lesions of early-stage diabetic kidney with the use of a streptozotocin (STZ)-induced diabetes mellitus animal model. We also provide new insights into the pathological mechanism underlying renal tubular dysfunction leading to diabetic nephropathy.
II. Materials and Methods
Animals
C57BL/6J mice obtained from CLEA Japan, Inc., were used in all experiments. All animal experimental procedures and protocols were approved by the Committee on Animal Research of Ehime University. The mice were dispatched by cervical dislocation.
Streptozotocin-induced diabetes
To induce diabetes in 7-week-old male mice, the animals were intraperitoneally injected on five consecutive days with streptozotocin (STZ, 70 mg/kg body weight; cat. no. S0130, Sigma-Aldrich, St. Louis, MO, USA) dissolved in 10 mmol/L sodium citrate buffer, pH 4.5 [33]. Control mice received sodium citrate buffer only. Body weight and blood glucose level of each animal was measured and recorded immediately after STZ-injection and every week thereafter for a total 12 weeks of observation. Blood drawn from the tail vein was assessed for glucose concentration through the Glucose Pilot Blood Glucose Monitoring System (Aventir Biotech LLC, CA, USA) to ascertain that glucose levels had reached more than 300 mg/dl.
Histological analysis
Adult mouse kidneys were dissected, and the tissue fixed in 4% PFA/PBS for 2 days at 4°C was dehydrated through ethanol and embedded in paraffin; 4-μm serial sections were then prepared for histological analysis. Routine hematoxylin and eosin (HE) staining and immunohistochemical analyses were carried out [13] with the use of the following primary antibodies (Ab): anti-megalin (1:2000, cat. no. ab76969, Abcam Plc., Cambridge, UK), anti-RAGE (1:200, cat. no. ab216329, Abcam Plc.), anti-AGEs (1:300, cat. no. bs-1158R, Bioss antibody Inc., Woburn, MA, USA), anti-8-OHdG (1:500, cat. no. bs-1278R, Bioss antibody Inc.), anti-Ki-67 (1:30000, cat. no. 14-5698-82, Thermo Fisher Scientific Inc., Pittsburgh, PA, USA), anti-calbindin1 (1:500, cat. no. ab82812, Abcam Plc.) and anti-MT-CO1 (1:1000, cat. no. ab203912, Abcam Plc.). HRP-conjugated anti-rabbit IgG (cat. no. K4003, Dako North America Inc.) or anti-rat IgG (cat. no. MP-7404, Vector Laboratories Inc., Burlingame, CA, USA) was used for the detection of primary antibodies. Signal detection was carried out with 3,3'-diaminobenzidine (DAB, cat. no. K3468, Dako North America Inc.) and 3,3'-diaminobenzidine tetrahydrochloride dihydrate (HistoGreen, cat. no. E109, Eurobio-Abcys, Les Ulis, France). Periodic acid-Schiff (PAS) staining was carried out under standard procedures [32]. TdT-mediated dUTP nick-end labeling (TUNEL) was done with an in situ Apoptosis Detection Kit (cat. no. MK500, Takara Biomedicals, Tokyo, Japan) according to the manufacturer’s instructions.
RNA extraction and RT-qPCR
Total RNA was isolated from adult mouse kidneys with the use of an RNeasy Mini kit (Qiagen KK, Tokyo, Japan) according to the manufacturer’s instructions. To assess the mRNA expression of megalin, calbindin1, RAGE, MT-CO1, Letm1, Lamp1, cathepsin D (CTSD) and S18-RNA, 1 mg of total RNA was reverse-transcribed to synthesize cDNA that was then amplified and quantified by the ABI PRISM 7500 Real Time PCR system (Applied Biosystems, Foster City, CA) using THUNDERBIRD® SYBR® qPCR mix (Toyobo, Osaka, Japan) with the following gene-specific primer sets: 5'-ATGAGAGCATGGAGCGATGG-3' and 5'-TCATCTGGTCAACATGGCCC-3' for megalin, 5'-CTTGCTGCTCTTTCGATGCC-3' and 5'-GCCGCTGTGGTCAGTATCAT-3' for calbindin1, 5'-CGGATTGGAGAGCCACTTGT-3' and 5'-GAGGACCTTCCAAGCTTCAGT-3' for RAGE, 5'-TCAACATGAAACCCCCAGCCA-3' and 5'-GCGGCTAGCACTGGTAGTGA-3' for MT-CO1, 5'-AGCTGAGGCAGCTATAGAACG-3' and 5'-ACAGAACACTCTCACGGCTC-3' for Letm1, 5'-CCTACGAGACTGCGAATGGT-3' and 5'-CCACAAGAACTGCCATTTTTC-3' for Lamp1, 5'-CCCTCCATTCATTGCAAGATAC-3' and 5'-TGCTGGACTTGTCACTGTTGT-3' for CTSD, 5'-GCCGCTAGAGGTGAAATTCTT-3' and 5'-CGTCTTCGAACCTCCGACT-3' for 18S-RNA. mRNA expression was quantified relative to that of S18-RNA in each reaction, according to the manufacturer’s protocol.
Quantitative assessment of cell proliferation in renal tubules
Cell proliferation was analyzed by counting the number of Ki-67‐positive cells in the non-STZ and STZ-diabetes mellitus (DM) kidneys. Three mice were examined in each group. Cell proliferation ratio in the proximal and distal renal tubules was assessed by counting the number of segment marker (megalin and calbindin1) positive cells and Ki-67/segment marker double‐positive cells in six cortical fields randomly selected from each mouse, at ×30 magnification.
Statistical analysis
Statistical analyses of kidney were carried out by Student’s t-test to determine the significance between groups. P < 0.05 was considered statistically significant. All results are expressed as means ± SD.
III. Results
General aspects and histological results in STZ-induced diabetic mice
In mice diabetes can be efficiently induced by administering multiple low doses of streptozotocin (STZ) [33]. Seven-week-old male C57BL/6J mice were for 5 days intraperitoneally injected with a daily dose of STZ (70 mg/kg) to induce diabetes (upper left panel in Fig. 1a). Compared with blood glucose levels in control mice (non-DM), those in model mice (STZ-DM) were significantly elevated at week 2 after STZ injection and continued to increase (right panel in Fig. 1a); also, a marked decrease in the body weight of the STZ-injected mice was observed (left panel in Fig. 1a). STZ-injected diabetic mice demonstrated significant fluctuations in blood glucose levels and body weights throughout the 12 weeks of observation. Next, histological examination of the STZ-induced diabetic kidney at 10 weeks after the STZ injection revealed obvious cell morphologic change in renal tubules, but no change in glomeruli. Nuclei of several renal tubule cells in the STZ-induced diabetic kidney were enlarged and vacuolar with thin nuclear membranes (Fig. 1e). Renal histopathology showed extensive Periodic acid-Schiff (PAS) staining in the brush border, microvilli-covered intraluminal surface structure of proximal renal tubules. Compared with the control kidney, the diabetic kidney demonstrated highly discontinuous and reduced PAS-positive brush borders and basement membranes (Fig. 1f, g). PAS staining also showed numerous accumulations of PAS-positive substance within the cytoplasm of tubular epithelial cells (Fig. 1g). The structure of renal tubule cells in the diabetic kidney was severely impaired at twenty-five weeks after STZ injections compared with that at 10 weeks after the injections. Numerous proximal tubules were obstructed with necrotic-cell debris that showed strong PAS staining but lacked nuclei (Fig. 1m). Moreover, glomerular sclerosis and interstitial fibrosis were clearly observed in the diabetic kidney at 25 weeks after STZ treatment (Fig. 1k, m).

In the diabetic kidney, the structure of renal tubules was markedly disturbed at 10 weeks after STZ treatment (early stages of diabetes) and before the onset of glomerular injury (Fig. 1). Results of PAS staining, showing loss and structural disturbance in brush borders, suggested that the proximal tubules were mainly impaired in the early-stage diabetic kidney. Molecular characterization of damaged renal tubules at the early stages of diabetes with the use of tubule segment-specific marker antibodies against megalin (a marker of the proximal tubule) and calbindin1 (a marker of the distal tubule) [30], revealed megalin antibody immunostaining in the proximal tubules (Fig. 2a, b). Compared with the control kidney, the diabetic kidney showed clearly enhanced megalin immunoreactivity in the cytoplasm and the intraluminal region of the proximal renal tubules. On the other hand, several impaired renal tubules with vacuolar nuclei showed a highly discontinuous and distorted pattern of megalin protein localization (Fig. 2b). Calbindin1 immunoreactivity was clearly detected in the cytoplasm of the distal renal tubules (Fig. 2c). Compared with the control kidney, the diabetic kidney clearly showed increased calbindin1-positive renal tubules (Fig. 2d), many of which contained vacuolar nucleic structures. These immunohistological results, increase of megalin and calbindin1 protein expression, were confirmed by real-time PCR analysis (Fig. 2g). Double immunostaining showed reciprocal expression of megalin and calbindin1 in renal tubules (Fig. 2e, f). In the control kidney, almost no overlap of megalin immunostaining with calbindin1 immunostaining was in evidence; only a small number of megalin-positive cells exhibited calbindin1 immunoreactivity (Fig. 2e). In contrast, a large number of double immunoreactive renal tubules with vacuolar nucleic structure were observed in the diabetic kidney (Fig. 2f).

In the diabetic kidney, apoptosis of renal tubule cells was clearly observed 10 weeks after STZ treatment (early stages of diabetes), and injured renal tubules showed intensive proliferative response (Fig. 3a–d). To examine the origin of mitotic cells after the induction of diabetes by STZ, double immunostaining of Ki-67, which is strictly associated with cell proliferation, was carried out with segment-specific markers such as megalin and calbindin1 (Fig. 3e–h). Most of the cells immunostained with Ki-67 (except renal interstitial cells) in the diabetic kidney were localized within the megalin-immunoreactive renal tubules (Fig. 3f). In contrast to megalin staining, almost no overlap of calbindin1-immunostaining with Ki-67 was observed (Fig. 3h). Quantitative analysis of these immunostained sections demonstrated about 4-fold difference between megalin and calbindin1 labeled Ki-67 immunoreactive renal tubule cells (Fig. 3i).

AGEs, considered oxidative derivatives resulting from diabetic hyperglycemia, are increasingly seen as a potential risk for renal injury [3, 5, 27, 29, 35]. AGEs and the receptor for AGEs (RAGE) are linked to the development of renal disorders [3, 5, 29, 35]. To address the pathogenic implications of AGEs-RAGE signaling on tubular damage in diabetic nephropathy, we investigated the localization of 8-hydroxy-2'-deoxyguanosine (8-OHdG), a marker of oxidative DNA damage [15, 17, 40], AGEs and RAGE (Fig. 4). The expression of 8-OHdG found in the nucleus and in the cytoplasm with a granular pattern (Fig. 4a, b) suggested oxidative modification of mitochondrial DNA [15, 40]. Compared with the control kidney, the diabetic kidney clearly demonstrated increased immunoreactivity of 8-OHdG in the glomeruli and renal tubules (especially cytoplasmic immunoreactivity was highly intensive). AGEs accumulation was clearly observed in the glomeruli and renal tubules of the diabetic kidney (Fig. 4d). By contrast, AGEs immunoreactivity in the control kidney was notably weak (Fig. 4c). RAGE protein expression is shown in Figure 4e and 4f. In the control kidney, RAGE was slightly but widely immunostained in renal tubule cells (Fig. 4e); by comparison, strong immunoreactivity was clearly observed in the diabetic kidney. Very intense and scatter immunostaining of RAGE was observed in renal tubule cells (red arrowheads in Fig. 4f). This increase in RAGE protein expression was also confirmed by real-time PCR analysis (Fig. 4i). Furthermore, to define the segmental distribution of renal tubule cells showing an enhancement of RAGE immunoreactivity after the induction of diabetes by STZ, double immunostaining of RAGE with calbindin1 was carried out (Fig. 4g, h). Almost no overlap of RAGE-immunostaining with calbindin1, a marker of renal distal tubules, was observed (Fig. 4h), suggesting that enhanced induction of RAGE expression under the diabetic condition occurs mainly in proximal renal tubules.

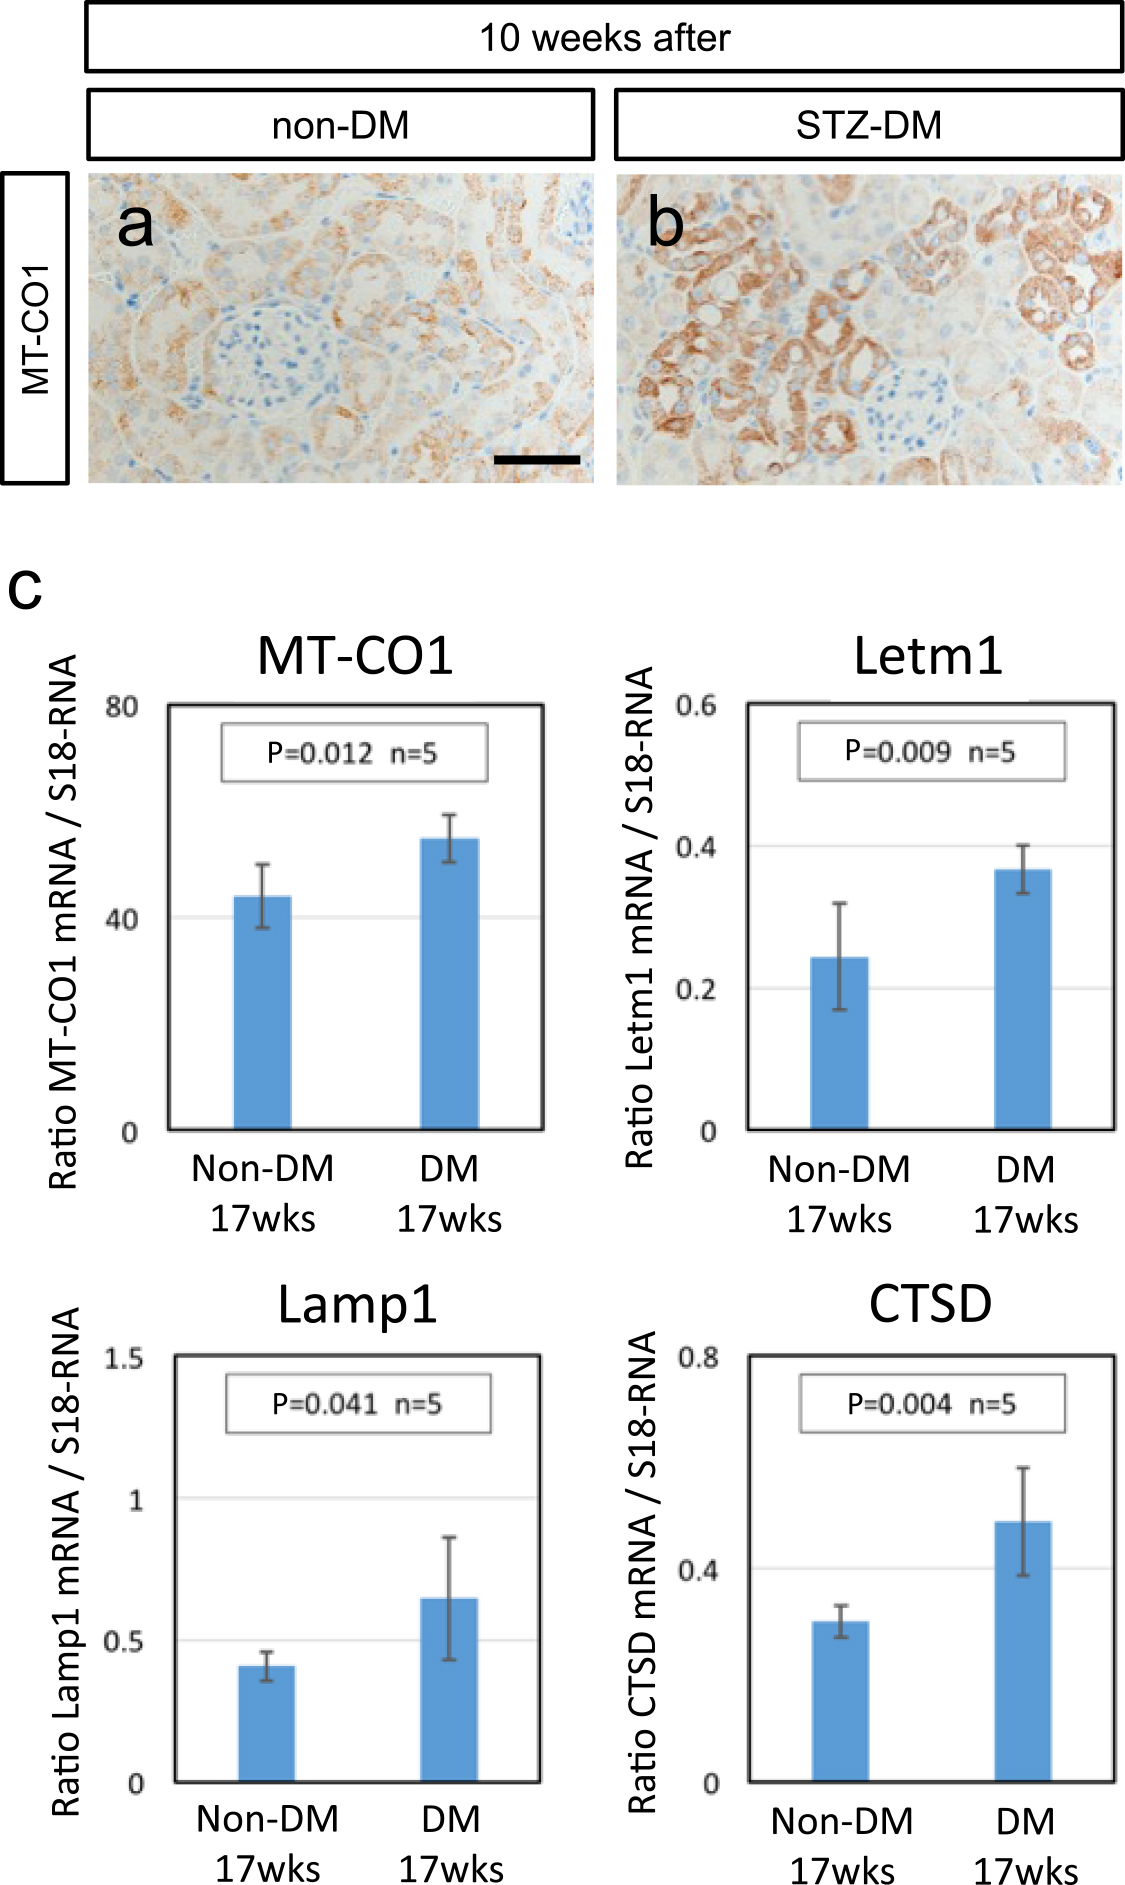
The STZ-induced diabetic kidney showed a high level of 8-OHdG immunoreactivity in the cytoplasmic content of proximal renal tubules, suggesting an increase in mitochondrial DNA oxidative modification (Fig. 4). Next, to examine the histological aspect of mitochondria in the diabetic kidney, immunohistological analysis was carried out with the use of a mitochondrial marker antibody against MT-CO1 (one of the mitochondrially encoded cytochrome c oxidases [12]). MT-CO1 immunoreactivity was clearly observed in the cytoplasm of renal tubules (Fig. 5a, b), and the diabetic kidney showed high level induction of MT-CO1 protein expression (Fig. 5b). This outcome was confirmed by quantitative real-time PCR analysis of MT-CO1 and Letm1, the mitochondrial homeostasis gene [9, 12] (upper panels in Fig. 5c). Furthermore, the implication between excess mitochondrial accumulation and the autophagy-lysosome system in the diabetic kidney was assessed, and because mitochondria damaged by various external stresses are degraded by the autophagy-lysosome system [4, 24], the gene expression of Lamp1, one of the lysosomal membrane proteins [6], and cathepsin D (CTSD), one of the endosomal proteases [31] was examined by quantitative real-time PCR in the control and diabetic kidneys; taken together, the results demonstrated enhanced expression of these genes, signifying dysfunction of the autophagy-lysosome system in the diabetic kidney (lower panels in Fig. 5c).
IV. Discussion
It has been generally accepted that the pathogenesis of the diabetic kidney is characterized by glomerular pathology, glomerular hyper-filtration and proteinuria, all resulting from continuous interaction between glomerular endothelial and mesangial cells under long-term hyperglycemia, and that these glomerular dysfunctions cause renal tubule injury through enhanced glucose reabsorption [21, 25, 26]. In the present study, we provide new evidence that damaged renal tubules are more prominently reflected in the progression of renal disorders than are glomerular lesions in the early-stage diabetic kidney. The experimental STZ-induced diabetes model subscribed to distinct renal tubule defects showing vacuolar nucleic structure, disturbance of brush borders, accumulations of PAS-positive substance, and restoration stress by excessive proliferation, in the absence of glomerular lesions. Previous studies support our results, indicating that the impairment of proximal renal tubular cells affects glomerulus function through crosstalk [11, 14, 23]. Sirt1 in proximal renal tubule cells confer protective effects against glomerular changes in the early diabetic kidney that shows podocyte defects with epigenetically regulated claudin-1 overexpression [14]. Our findings and previous studies suggest that proximal renal tubules are the primary pathological target of the initial-stage of diabetic nephropathy.
The present study showed segmental distribution of these renal tubular lesions in the diabetic kidney, indicating that damaged tubular cells were localized mainly in proximal tubule regions. Especially, strongly enhanced expression of RAGE, showing high sensitivity to AGEs, was observed in damaged proximal tubules. Aberrant activation of AGEs-RAGE signaling promotes cellular defects through the NF-kB signaling pathway, in particular in the setting of diabetes [7, 20, 34]. Since RAGE expression itself is directly regulated by the NF-kB pathway [20], we consider that continuous activation of the AGEs-RAGE pathway under severe hyperglycemia has the potential to result in a positive feedback loop that enhances proximal tubular damage in diabetic nephropathy. Also, in vivo studies with the use of genetically modified mice involving selectively regulated RAGE activation or inactivation, have suggested that AGEs-RAGE axis blockade might be a potential therapeutic target of diabetic nephropathy [22, 29, 37]. RAGE deficiency delays the progression of diabetic nephropathy [22, 29]; conversely, RAGE transgenic mice with diabetic conditions show progressive severe renal defects [37]. Previous studies have evaluated prevention or progression effects through the modulation of AGEs-RAGE signaling, mainly by altering glomerular phenotypes; nonetheless, implications of proximal renal tubular defects in the pathogenesis of diabetic nephropathy by the AGEs-RAGE pathway are largely unknown. The present study indicated that enhanced RAGE expression is initially induced in proximal renal tubules in the early stages of diabetic nephropathy. In future studies, detailed analyses focused on the role of proximal renal tubular injury in the progression of diabetic nephropathy are needed.
Proximal renal tubules are the most energy-consuming tissues for sodium/protein reabsorption in the kidney, and contain a great number of mitochondria to carry out ATP production [2, 38, 41]. It is well known that mitochondrial superoxide production mediated by long-term hyperglycemia leads to mitochondrial dysfunction in proximal renal tubules, and persistent mitochondrial failure plays a critical role in the progression of diabetic nephropathy [36, 39]. Under normal physiological conditions, damaged mitochondria are degraded by the autophagy-lysosome system, one of the cytoplasmic ingredients in intracellular protein catabolism [1, 4, 24]. The present study indicated that anomalous mitochondria with high level DNA oxidative modification, shown by 8-OHdG immunoreactivity in cytoplasm [15, 40], were accumulated in the diabetic renal tubular cells; moreover, the autophagy/lysosome pathway was also impaired in the STZ-induced diabetic kidney, in which the aberrant expression of marker genes for autophagy-lysosomal organelles, Lamp1 [6] and CTSD [31], were observed. These findings suggest that disturbance of the autophagy/lysosome system, leading to mitochondrial dysfunction, is also one of the potential risk factors for the progression of diabetic nephropathy.
In conclusion, the major finding in this study is that proximal renal tubular cells are initially impaired through the activated AGEs-RAGE pathway and before the appearance of glomerular diabetic phenotypes. Moreover, the accumulation of oxidative damaged mitochondria associated with the disturbed autophagy/lysosome system, is also seen in diabetic renal tubules. Our findings may provide new insight into the pathogenesis of early diabetic nephropathy. A better understanding of pathological mechanisms underlying proximal tubular injury/dysfunction under hyperglycemia may lead to specific and effective therapeutic strategies to prevent progression of diabetic nephropathy.
This study is in compliance with ethical standards.
V. Conflicts of Interest
The authors declare no conflicts of interest.
VI. Author Contributions
RH conceived and designed the experiments; RH MK and YK performed the experiments; RH MK YK RK and SK analyzed the data; RH YK RK and SK contributed reagents/materials/analysis tools; RH wrote the paper.
VII. Acknowledgments
This work was supported in part by a Grant-in-Aid for Scientific Research from the Ministry of Education, Culture, Sports, Science and Technology, Japan (18K06832 to R.H.). The funders had no role in the study design, data collection and analysis, decision to publish, or preparation of the manuscript. We express our appreciation to Mss. Yuki Takaoka, Chie Shiraishi, Yukimi Utsunomiya, Kyoko Shimazu, Miyako Nagao, and Mr. Hitoshi Iwata for their valuable assistance.
VIII. References
- 1 Bhargava, P. and Schnellmann, R. G. (2017) Mitochondrial energetics in the kidney. Nat. Rev. Nephrol. 13; 629–646.
- 2 Blantz, R. C. (2014) Phenotypic characteristics of diabetic kidney involvement. Kidney Int. 86; 7–9.
- 3 Bohlender, J. M., Franke, S., Stein, G. and Wolf, G. (2005) Advanced glycation end products and the kidney. Am. J. Physiol. Renal Physiol. 289; F645–659.
- 4 Brunk, U. T. and Terman, A. (2002) The mitochondrial-lysosomal axis theory of aging: accumulation of damaged mitochondria as a result of imperfect autophagocytosis. Eur. J. Biochem. 269; 1996–2002.
- 5 Chen, X., Ma, J., Kwan, T., Stribos, E. G. D., Messchendorp, A. L., Loh, Y. W., Wang, X., Paul, M., Cunningham, E. C., Habib, M., Alexander, I. E., Sharland, A. F., Chadban, S. J. and Wu, H. (2018) Blockade of HMGB1 Attenuates Diabetic Nephropathy in Mice. Sci. Rep. 8; 8319.
- 6 Cheng, X. T., Xie, Y. X., Zhou, B., Huang, N., Farfel-Becker, T. and Sheng, Z. H. (2018) Revisiting LAMP1 as a marker for degradative autophagy-lysosomal organelles in the nervous system. Autophagy 14; 1472–1474.
- 7 Cipollone, F., Iezzi, A., Fazia, M., Zucchelli, M., Pini, B., Cuccurullo, C., De Cesare, D., De Blasis, G., Muraro, R., Bei, R., Chiarelli, F., Schmidt, A. M., Cuccurullo, F. and Mezzetti, A. (2003) The receptor RAGE as a progression factor amplifying arachidonate-dependent inflammatory and proteolytic response in human atherosclerotic plaques: role of glycemic control. Circulation 108; 1070–1077.
- 8 De, S., Kuwahara, S. and Saito, A. (2014) The endocytic receptor megalin and its associated proteins in proximal tubule epithelial cells. Membranes (Basel) 4; 333–355.
- 9 Durigon, R., Mitchell, A. L., Jones, A. W., Manole, A., Mennuni, M., Hirst, E. M., Houlden, H., Maragni, G., Lattante, S., Doronzio, P. N., Dalla Rosa, I., Zollino, M., Holt, I. J. and Spinazzola, A. (2018) LETM1 couples mitochondrial DNA metabolism and nutrient preference. EMBO Mol. Med. 10; e8550.
- 10 Eddy, A. A. (2005) Progression in chronic kidney disease. Adv. Chronic Kidney Dis. 12; 353–365.
- 11 Gilbert, R. E. (2017) Proximal Tubulopathy: Prime Mover and Key Therapeutic Target in Diabetic Kidney Disease. Diabetes 66; 791–800.
- 12 Gopal, R. K., Calvo, S. E., Shih, A. R., Chaves, F. L., McGuone, D., Mick, E., Pierce, K. A., Li, Y., Garofalo, A., Van Allen, E. M., Clish, C. B., Oliva, E. and Mootha, V. K. (2018) Early loss of mitochondrial complex I and rewiring of glutathione metabolism in renal oncocytoma. Proc. Natl. Acad. Sci. U S A 115; E6283–E6290.
- 13 Haraguchi, R., Kitazawa, R., Murashima, A., Yamada, G. and Kitazawa, S. (2017) Developmental Contribution of Wnt-signal-responsive Cells to Mouse Reproductive Tract Formation. Acta Histochem. Cytochem. 50; 127–133.
- 14 Hasegawa, K., Wakino, S., Simic, P., Sakamaki, Y., Minakuchi, H., Fujimura, K., Hosoya, K., Komatsu, M., Kaneko, Y., Kanda, T., Kubota, E., Tokuyama, H., Hayashi, K., Guarente, L. and Itoh, H. (2013) Renal tubular Sirt1 attenuates diabetic albuminuria by epigenetically suppressing Claudin-1 overexpression in podocytes. Nat. Med. 19; 1496–1504.
- 15 Kakimoto, M., Inoguchi, T., Sonta, T., Yu, H. Y., Imamura, M., Etoh, T., Hashimoto, T. and Nawata, H. (2002) Accumulation of 8-hydroxy-2'-deoxyguanosine and mitochondrial DNA deletion in kidney of diabetic rats. Diabetes 51; 1588–1595.
- 16 Kimmelstiel, P. and Wilson, C. (1936) Intercapillary Lesions in the Glomeruli of the Kidney. Am. J. Pathol. 12; 83–98.7.
- 17 Kittikowit, W., Waiwijit, U., Boonla, C., Ruangvejvorachai, P., Pimratana, C., Predanon, C., Ratchanon, S. and Tosukhowong, P. (2014) Increased oxidative DNA damage seen in renal biopsies adjacent stones in patients with nephrolithiasis. Urolithiasis 42; 387–394.
- 18 Krolewski, A. S. (2015) Progressive renal decline: the new paradigm of diabetic nephropathy in type 1 diabetes. Diabetes Care 38; 954–962.
- 19 Kuwahara, S., Hosojima, M., Kaneko, R., Aoki, H., Nakano, D., Sasagawa, T., Kabasawa, H., Kaseda, R., Yasukawa, R., Ishikawa, T., Suzuki, A., Sato, H., Kageyama, S., Tanaka, T., Kitamura, N., Narita, I., Komatsu, M., Nishiyama, A. and Saito, A. (2016) Megalin-Mediated Tubuloglomerular Alterations in High-Fat Diet-Induced Kidney Disease. J. Am. Soc. Nephrol. 27; 1996–2008.
- 20 Liliensiek, B., Weigand, M. A., Bierhaus, A., Nicklas, W., Kasper, M., Hofer, S., Plachky, J., Grone, H. J., Kurschus, F. C., Schmidt, A. M., Yan, S. D., Martin, E., Schleicher, E., Stern, D. M., Hammerling, G. G., Nawroth, P. P. and Arnold, B. (2004) Receptor for advanced glycation end products (RAGE) regulates sepsis but not the adaptive immune response. J. Clin. Invest. 113; 1641–1650.
- 21 Mehdi, U. and Toto, R. D. (2009) Anemia, diabetes, and chronic kidney disease. Diabetes Care 32; 1320–1326.
- 22 Myint, K. M., Yamamoto, Y., Doi, T., Kato, I., Harashima, A., Yonekura, H., Watanabe, T., Shinohara, H., Takeuchi, M., Tsuneyama, K., Hashimoto, N., Asano, M., Takasawa, S., Okamoto, H. and Yamamoto, H. (2006) RAGE control of diabetic nephropathy in a mouse model: effects of RAGE gene disruption and administration of low-molecular weight heparin. Diabetes 55; 2510–2522.
- 23 Nihalani, D. and Susztak, K. (2013) Sirt1-Claudin-1 crosstalk regulates renal function. Nat. Med. 19; 1371–1372.
- 24 Oka, T., Hikoso, S., Yamaguchi, O., Taneike, M., Takeda, T., Tamai, T., Oyabu, J., Murakawa, T., Nakayama, H., Nishida, K., Akira, S., Yamamoto, A., Komuro, I. and Otsu, K. (2012) Mitochondrial DNA that escapes from autophagy causes inflammation and heart failure. Nature 485; 251–255.
- 25 Pugliese, G. (2014) Updating the natural history of diabetic nephropathy. Acta Diabetol. 51; 905–915.
- 26 Roxburgh, S. A., Kattla, J. J., Curran, S. P., O’Meara, Y. M., Pollock, C. A., Goldschmeding, R., Godson, C., Martin, F. and Brazil, D. P. (2009) Allelic depletion of grem1 attenuates diabetic kidney disease. Diabetes 58; 1641–1650.
- 27 Saito, A., Takeda, T., Sato, K., Hama, H., Tanuma, A., Kaseda, R., Suzuki, Y. and Gejyo, F. (2005) Significance of proximal tubular metabolism of advanced glycation end products in kidney diseases. Ann. N Y Acad. Sci. 1043; 637–643.
- 28 Saito, A., Sato, H., Iino, N. and Takeda, T. (2010) Molecular mechanisms of receptor-mediated endocytosis in the renal proximal tubular epithelium. J. Biomed. Biotechnol. 2010; 403272.
- 29 Sanajou, D., Ghorbani Haghjo, A., Argani, H. and Aslani, S. (2018) AGE-RAGE axis blockade in diabetic nephropathy: Current status and future directions. Eur. J. Pharmacol. 833; 158–164.
- 30 Schutgens, F., Rookmaaker, M. B., Blokzijl, F., van Boxtel, R., Vries, R., Cuppen, E., Verhaar, M. C. and Clevers, H. (2017) Troy/TNFRSF19 marks epithelial progenitor cells during mouse kidney development that continue to contribute to turnover in adult kidney. Proc. Natl. Acad. Sci. U S A 114; E11190–E11198.
- 31 Sevlever, D., Jiang, P. and Yen, S. H. (2008) Cathepsin D is the main lysosomal enzyme involved in the degradation of alpha-synuclein and generation of its carboxy-terminally truncated species. Biochemistry 47; 9678–9687.
- 32 Shiogama, K., Kitazawa, K., Mizutani, Y., Onouchi, T., Inada, K. and Tsutsumi, Y. (2015) New Grocott Stain without Using Chromic Acid. Acta Histochem. Cytochem. 48; 9–14.
- 33 Takamura, T., Ando, H., Nagai, Y., Yamashita, H., Nohara, E. and Kobayashi, K. (1999) Pioglitazone prevents mice from multiple low-dose streptozotocin-induced insulitis and diabetes. Diabetes Res. Clin. Pract. 44; 107–114.
- 34 Tomino, Y., Hagiwara, S. and Gohda, T. (2011) AGE-RAGE interaction and oxidative stress in obesity-related renal dysfunction. Kidney Int. 80; 133–135.
- 35 Vlassara, H. (2001) The AGE-receptor in the pathogenesis of diabetic complications. Diabetes Metab. Res. Rev. 17; 436–443.
- 36 Wei, P. Z. and Szeto, C. C. (2019) Mitochondrial dysfunction in diabetic kidney disease. Clin. Chim. Acta 496; 108–116.
- 37 Yamamoto, Y., Kato, I., Doi, T., Yonekura, H., Ohashi, S., Takeuchi, M., Watanabe, T., Yamagishi, S., Sakurai, S., Takasawa, S., Okamoto, H. and Yamamoto, H. (2001) Development and prevention of advanced diabetic nephropathy in RAGE-overexpressing mice. J. Clin. Invest. 108; 261–268.
- 38 Zhan, M., Brooks, C., Liu, F., Sun, L. and Dong, Z. (2013) Mitochondrial dynamics: regulatory mechanisms and emerging role in renal pathophysiology. Kidney Int. 83; 568–581.
- 39 Zhan, M., Usman, I. M., Sun, L. and Kanwar, Y. S. (2015) Disruption of renal tubular mitochondrial quality control by Myo-inositol oxygenase in diabetic kidney disease. J. Am. Soc. Nephrol. 26; 1304–1321.
- 40 Zhang, Y., Zhang, L., Zhang, L., Bai, J., Ge, H. and Liu, P. (2010) Expression changes in DNA repair enzymes and mitochondrial DNA damage in aging rat lens. Mol. Vis. 16; 1754–1763.
- 41 Zhuo, J. L. and Li, X. C. (2013) Proximal nephron. Compr. Physiol. 3; 1079–1123.
