Abstract
Polycystic ovary syndrome (PCOS) is a common endocrine disorder of fertile females. It has been reported that stevia leaf extract (SLE) has antidiabetic and antihyperlipidemic properties. Therefore, the current study hypothesized and investigated the role and mechanistic aspects of a natural sweetener; SLE in treating a rat model of letrozole-induced PCOS and to compare it with metformin. Thirty-five female Wistar albino rats were divided into 5 groups: control, PCOS-induced group (letrozole, 1 mg/kg/d, for 21 days), SLE, metformin, and combination-treated groups (300 mg/kg/d, for the next 28 days in SLE and metformin-treated groups). Vaginal smears were done. The levels of glucose, lipid, and hormonal profiles were measured in the serum meanwhile, malonyl dialdehyde (MDA), superoxide dismutase (SOD), and tumour necrosis factor (TNF-α) were measured in the ovary. Ovarian sections were subjected to hematoxylin and eosin, Masson, and immunohistochemical identification of VEGF and TGF-β followed by morphometric analysis. PCOS rats showed altered hormonal and lipid profiles, in addition to hyperglycemia. Also, the ovarian tissue levels of MDA and TNF-α were elevated, and SOD was decreased. Numerous cystic follicles, decrease/absence of corpora lutea, interstitial fibrosis with positive VEGF and TGF-β immunoreactivity were evident. SLE improved all altered parameters. SLE showed potential therapeutic merits in letrozole-induced PCOS via anti-inflammatory, antioxidant, anti-fibrotic, and angiogenesis regulating mechanisms. Its effects were almost comparable to metformin, and the combination of both has no further synergistic effect.
I. Introduction
Polycystic ovary syndrome (PCOS) is a common reproductive disorder associated with systemic metabolic manifestations. It is the most common cause of androgen excess in fertile females constituting about 80–85% of women with hyperandrogenism [10].
The exact mechanism of PCOS remains unclear however, the interaction between environmental and genetic factors is essential for its existence, explaining its multifactorial nature [9]. Ovarian angiogenesis, orchestrated by vascular endothelial growth factor (VEGF), is crucial for proper follicular development and corpus luteum formation. Various angiogenic disturbances and abnormal ovarian blood flow were recorded in PCOS women that possibly affect the irrigation of follicles leading to disrupted oxygen, nutrient, and hormonal balances [12]. On the other side, a correlation between chronic inflammation and immune dysfunction was also reported [38]. Furthermore, transforming growth factor (TGF)-β is a multifunctional mediator that acts in harmony with VEGF to regulate angiogenesis and is found to be dysregulated in PCOS, which might play a role in its pathogenesis [27]. Moreover, it shares in the development of ovarian fibrosis, a key element in PCOS. Many cytokines and fibrotic factors, such as TGF-β, MMPs and TIMPs have a regulatory action on the balance of extracellular matrix (ECM) in patients with PCOS. Abnormal expression of TGF-β stimulates interstitial cells with excessive ECM production facilitating ovarian fibrosis by disrupting the MMPs/TIMPs balance [40].
Metformin is an oral hypoglycemic drug that is recommended to be used in PCOS as it enhances insulin sensitivity, reduces body weight, and maintains menstrual cyclicity with the restoration of ovulation [2]. However, some individuals have experienced annoying gastrointestinal upsets, which make them unable to tolerate the drug [5]. Therefore, searching for alternatives better than or even equal to metformin’s efficacy, for the treatment of PCOS is a great demand.
Stevia sweeteners are natural products that have gained rising attention, in recent years in industrial and scientific communities [15]. The different constituents present in stevia leaf extract (SLE) conferred various biological properties such as anti-inflammatory, antidiabetic, anticancer [41], anti-obesity, antioxidant, anti-hyperlipidemic, and anti-hypertensive effects [7]. For example, steviosides, the main sweetener glycoside found in the leaves of Stevia Rebaudiana Bertoni plant have therapeutic applications in Diabetes Mellitus, obesity and possess anti-inflammatory and antitumor activities [37].
Due to such diversified biological activities of SLE, the current study hypothesized and investigated its curative potential on the polycystic ovarian changes induced by letrozole in rats, in comparison to metformin. Moreover, the study explored the biomechanistic insights entangled in such therapeutic effects using biochemical, histological, and immunohistochemical studies.
II. Material and Methods
Drugs and supplies
• Letrozole: it was supplied as Femara 2.5 mg tab (Novartis, Cairo, Egypt). It was dissolved in 2.5 ml 0.5% carboxymethylcellulose (CMC) to reach a final volume of 1 mg/ml.
• Metformin: it was supplied as Glucophage 1000 mg tab; equivalent to metformin 780 mg (Minapharm Company for Pharmaceuticals and Chemical Industries, Cairo, Egypt). It was dissolved in 2.6 ml 0.5% CMC to obtain a final volume of 300 mg/ml.
• Stevia leaf extract: it is provided in a liquid form supplying steviosides (500 mg/1.5 ml). It was manufactured by Nutraceutical Corporation and online purchased from iHerb for supplements and natural products (https://sa.iherb.com/pr/p/18986). The solution was diluted by adding distilled water to reach a final volume of 300 mg/ml.
Animals
Thirty-five Wistar female albino rats (6 week-age, weighing 150–165 g) were obtained from the breeding unit of the Holding Company for Biological Products and Vaccines (VACSERA), Giza, Egypt. The animals were housed in groups in the animal experimental laboratory at the National Research Centre, Cairo, Egypt, with a light-controlled 12-hr light/dark cycle, at an ambient temperature of 25 ± 1°C. The rats had free access to food and water ad libitum. For adaptation to the new environment, the rats were handled manually for a one-week acclimatization period before the experiment.
Ethics statements
The study protocol was granted a final approval (Approval #: 5413042021) after satisfying and fulfilling the recommendations and guidelines adopted by the medical research ethics committee at the National Research Centre, Cairo, Egypt which were in accordance with the Guide for the Care and Use of Laboratory Animals adopted by National Institutes of Health [22].
Induction of PCO
After laboratory adaptation, all animals had undergone daily vaginal smears for 7 consecutive days to evaluate ovarian cyclicity. Animals with regular oestrous cycles were selected to be included in the study. The experimental rats were given letrozole 1 mg/kg via oral gavage for 21 consecutive days every morning at 10 AM according to Reddy et al. [28]. Vaginal smears were performed every morning from day 14 and during treatment, using cotton buds immersed in saline. Never introduce deeply into the vagina to avoid cervical stimulation with subsequent pseudo-pregnancy state and persistence of the diestrus phase up to 14 days. Afterwards, the collected vaginal smears were placed on glass slides, dried, and stained with Giemsa [8].
Study design
The selected female rats were initially divided into control (n = 7), and experimental animals (n = 28):
• Control rats: received 1 ml CMC orally.
• PCOS-induced group: 7 rats received 1 mg/kg letrozole via oral gavage once daily for 21 days.
• PCO/SLE-treated group: 7 rats received SLE.
• PCO/metformin-treated group: 7 rats received metformin.
• PCO/SLE/metformin-treated group: 7 rats received both SLE and metformin.
All treatment options were given via oral gavage at a dose of 300 mg/kg/d for both metformin [29] and stevia [3], started on day 22 and continued for another 28 consecutive days. The PCOS group was given CMC only for another 28 days.
Biochemical assays
At the end of the experiment, all animals were weighed then anaesthetized using ketamine/xylazine (80/10 mg/kg) and blood samples were obtained terminally via cardiac puncture. All blood samples were centrifuged, sera were separated and stored at −20°C for later laboratory analysis of blood testosterone, progesterone, estrogen, triglycerides (TGs), total cholesterol, fasting blood glucose, insulin. The insulin resistance (IR) was estimated by calculating the homeostasis model of assessment (HOMA-IR): HOMA-IR = FBG (mmol/L) × FBI (μU/mL)/22.5 [30].
After that, the anaesthetized rats were euthanized by cervical decapitation. Both ovaries were dissected, undergone gross inspection. The right ovary was stored at −20°C for later processing of tissue homogenates. The ovarian tissues were homogenized in 10 ml cold buffer (50 mM potassium phosphate, pH 7.5) using a tissue homogenizer (Ultra-Turrax homogenizer, IKA, Germany). The homogenates had undergone centrifugation (4000 rpm, for 15 min, at 4°C) and the supernatant was removed for estimation of the tissue levels of MDA, SOD (bio-diagnostic, Giza, Egypt, Catalog #: MD 2528, SD 2520 respectively) and TNF-α (Cusabio Technology LLC, Houston, USA, Catalog #: CSB-E11987r). For MDA measurement (nmol/mg protein), thiobarbituric acid reactive substances (TBARS) assay has been done [17]. SOD was measured as U/mg protein according to the technique described by Sun et al. [33]. TNF-α was measured as pg/mg protein according to the Lowry method [19]. All assays were done using the available kits following the manufacturer’s directions.
Ovarian histology and immunohistochemistry
The left ovary was fixed in 10% formal saline for later processing of paraffin sections. Approximately five micrometer sections were cut. One section per ten serial sections was serially selected. The selected sections were subjected to Hematoxylin and Eosin, Masson’s trichrome stain for detection of fibrosis [4], and immunohistochemical staining for detection of VEGF and TGF-β using the peroxidase-labelled streptavidin-biotin method [18]. The primary antibodies used were rabbit polyclonal antibodies. The anti-TGF-β antibody (Catalog #: A16640, ABclonal Inc., Woburn, MA, USA) was used at a dilution of 1:200. The anti-VEGF antibody (Catalog #: GB-14400, Servicebio Technology Co., Ltd, Wuhan, China) was used at a dilution of 1:500. Endogenous peroxidase was blocked by 0.006% hydrogen peroxide for 60 minutes. The sections in citrate buffer solution (10 mM, pH 6) were boiled for 10 min for antigen retrieval. After cooling at room temperature for 20 min, the slides were incubated with the primary antibody for one hour at room temperature. Immunostaining was completed using Diaminobenzidine (DAB) as a chromogen and nuclear counterstaining was done by Mayer’s hematoxylin. All slides were visualized by a light microscope (Leica DM3000, Leica Microsystems, Wetzlar, Germany). Negative control was done by omitting the step of the primary antibody. The positive control for VEGF and TGF-β immunostaining was kidney and human breast cancer respectively. Both antibody reactions were considered positive if they gave brown cytoplasmic colouration.
Morphometric study
Histomorphometric analysis of the ovarian parameters was performed using LAS image analysis software installed in a computer connected to a camera (Leica MC 190 HD, Leica Microsystems, Wetzlar, Germany)-provided light microscope (Leica DM3000, Leica Microsystems, Wetzlar, Germany), at the Central Laboratories Network—Microscope Laboratory, National Research Centre, Cairo, Egypt. The number of the corpus luteum, Graafian follicles, and cystic follicles per ovary at ×40 magnification was counted. The thickness of the granulosa cell and theca layers was estimated at ×200 magnification. Also, the area percent of Masson-stained collagen fibres and VEGF, TGF-β immunostaining at ×200 magnification was measured. Ten non-overlapping fields in 3 non-serial ovarian sections from each left ovary (7 rats per group) was evaluated during the analysis.
Statistical analysis
GraphPad Prism (GraphPad Software, Version 8 for windows, San Diego, California, USA) was used to analyze all data generated. Initial check of normal distribution was performed prior to analysis using Shapiro’s test. The used statistical test was the One-way Analysis of variance (ANOVA) with multiple comparisons post hoc Tukey’s test to compare between groups. Values were expressed as mean ± standard deviation. Statistical significance was considered at P value less than 0.05.
III. Result
General appearance and weight of animals
Both ovaries looked paler in colour and showed cystic expanding follicles more than their control. Regarding the body weight, Table 1 showed a significant increase (P < 0.05) in the body weight in experimental rats on day 22 when compared to the control weight, whereas it did not differ significantly among the 4 studied animal groups (PCO, SLE, met, SLE/met). At the end of the study, all treatment options significantly maintained (P < 0.05) the body weight when compared to the PCOS group. Moreover, the SLE/metformin group showed better control of the body weight.
Table 1.
Changes in the rats’ body weight before (Day 1), after induction of PCOS (day 22), and after treatment by SLE, metformin and both combined (day 50)
| Time |
Start of study (Day 1) |
After 21 days (Day 22) |
At the end of treatment and end of study (day 50) |
| Group |
| Control |
153.6 ± 9.3 |
191.1 ± 6.3 |
247.1 ± 9.02 |
| PCOS |
157.6 ± 8.4 |
208 ± 8.9a |
290.5 ± 10.95a |
| SLE |
162 ± 10.1 |
209.4 ± 10.5a |
271.8 ± 9.7ab |
| Metformin |
161 ± 10.4 |
211.9 ± 11.2a |
263.6 ± 7.01ab |
| SLE/metformin |
159.8 ± 10.5 |
209.3 ± 11.95a |
255 ± 13.9bc |
The data were expressed as a mean of 7 rats ± SD. a: significantly different when compared to the control group, b: significant versus the PCOS group, c: significant versus the SLE group, using post hoc ANOVA (Tukey), P < 0.05.
PCOS induction was evaluated based on the assessment of the results of eight-day vaginal smears starting from day 14 to day 21 [34]. Persistent phase and or irregular cycle were considered as successful indicators of PCOS induction [25]. All the control female rats exhibited a normal cycle of 4–5 days, including proestrus, oestrous, metastrous, and diestrous phases as determined by the vaginal cytology (Fig. 1), whereas the PCOS animal group showed persistence of diestrous phase with interruption of cyclicity in all rats, at the end of induction period (day 21). The determination of each phase was based on the predominance of 3 types of cells; nucleated epithelial cells, anucleated cornified cells, or leucocytes [34]. Stevia, metformin, and stevia/metformin-treated groups showed restoration of the normal vaginal cyclicity in most of the treated animals (71.4%, 85.7%, 85.7% respectively).
Biochemical results
Effect of Stevia leaf extract on serum hormonal profile
Regarding the female hormones (Fig. 2a–c), letrozole treatment in PCOS group showed a significant increase (P < 0.05) in the serum testosterone level meanwhile, a significant depression (P < 0.05) in the estrogen and progesterone levels was noted, in comparison to the control animals. On the other hand, SLE, metformin and SLE/metformin-treated animals showed a significant decrease (P < 0.05) in testosterone level and a significant increase (P < 0.05) in both estrogen and progesterone levels, when compared to the PCOS-induced group. As regards the serum insulin (Fig. 2d), there was a significant increase in PCOS group when compared to control however, the treated groups showed a remarkable decrease but it was statistically significant in metformin-treated only group when compared to PCOS group. Overall, SLE improved hormonal profile but metformin showed the best restoration.
Effect of Stevia leaf extract on metabolic profile and insulin resistance
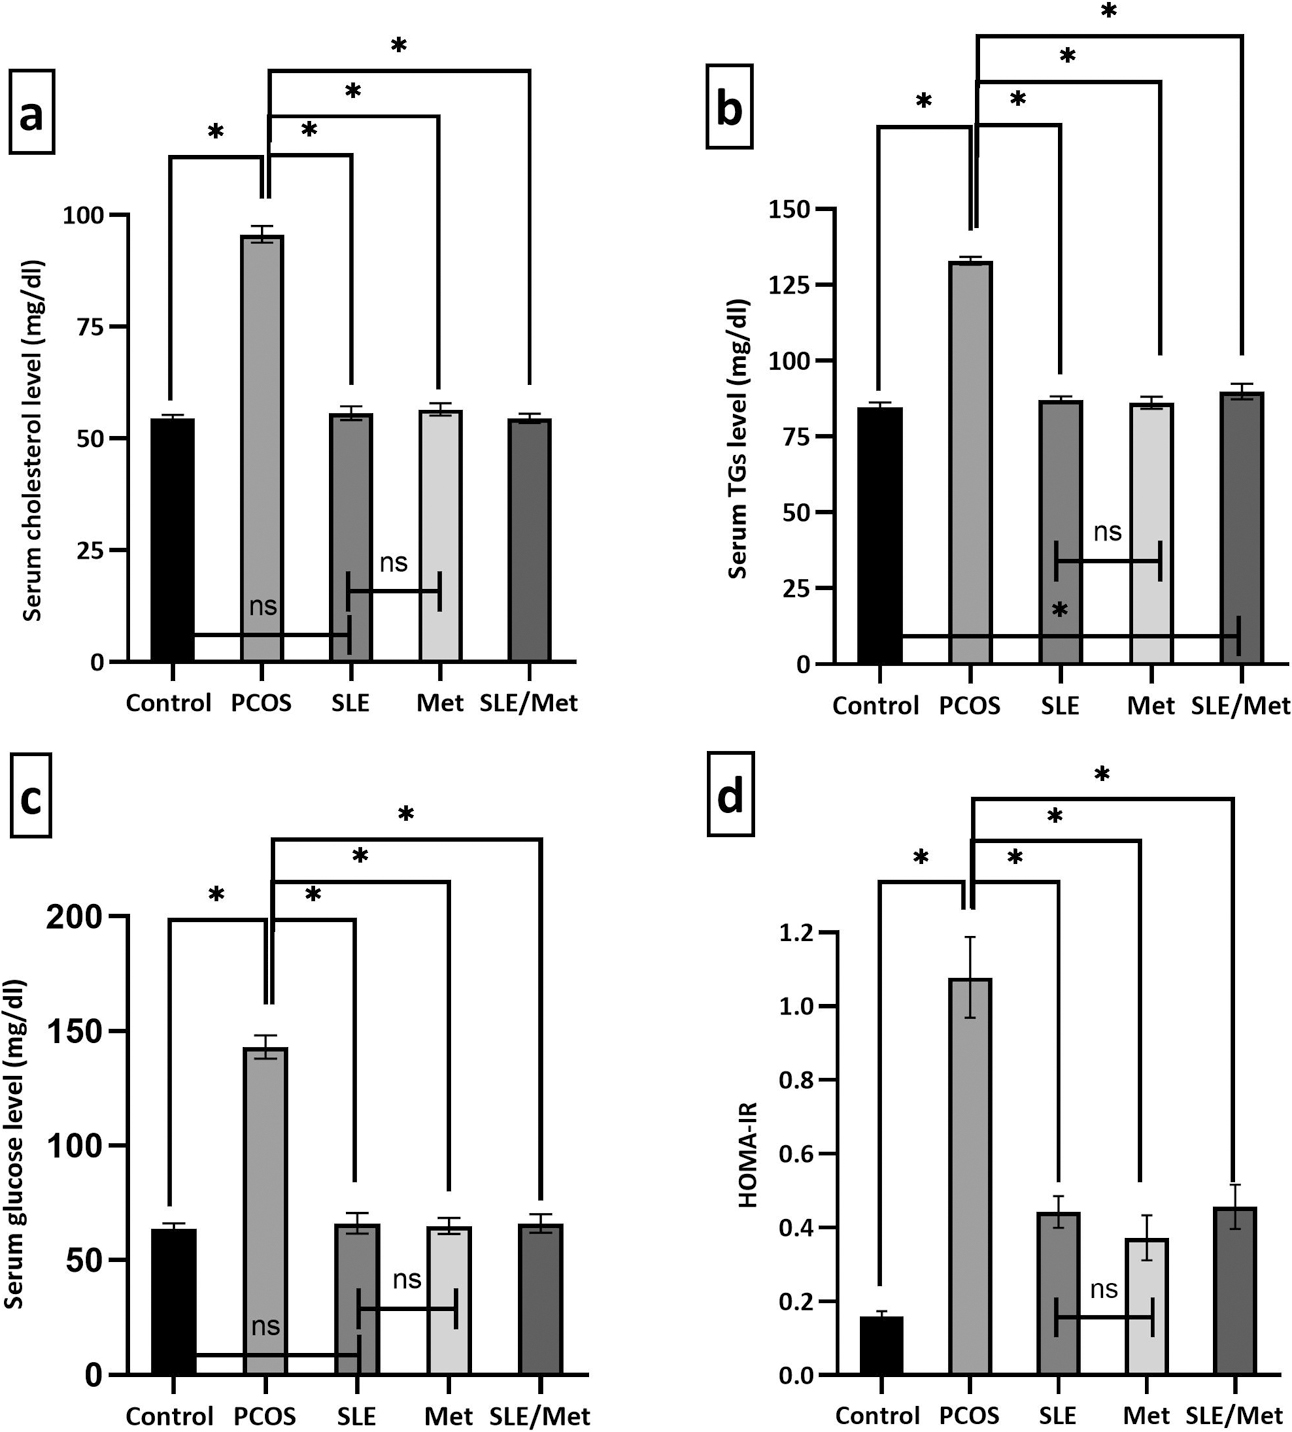
The metabolic profile assay was displayed in Fig. 3a–d. It showed a significant increase (P < 0.001) in the serum total cholesterol, TGs and glucose as well as insulin resistance (indicated by HOMA-IR) in PCOS group when compared to the control rats. All the treated groups (SLE, metformin, SLE/metformin) showed a significant decrease (P < 0.001) in the measured parameters as compared to the PCOS-induced group with almost equal efficacy.
Effect of stevia leaf extract on ovarian tissue oxidant/antioxidant/inflammatory status
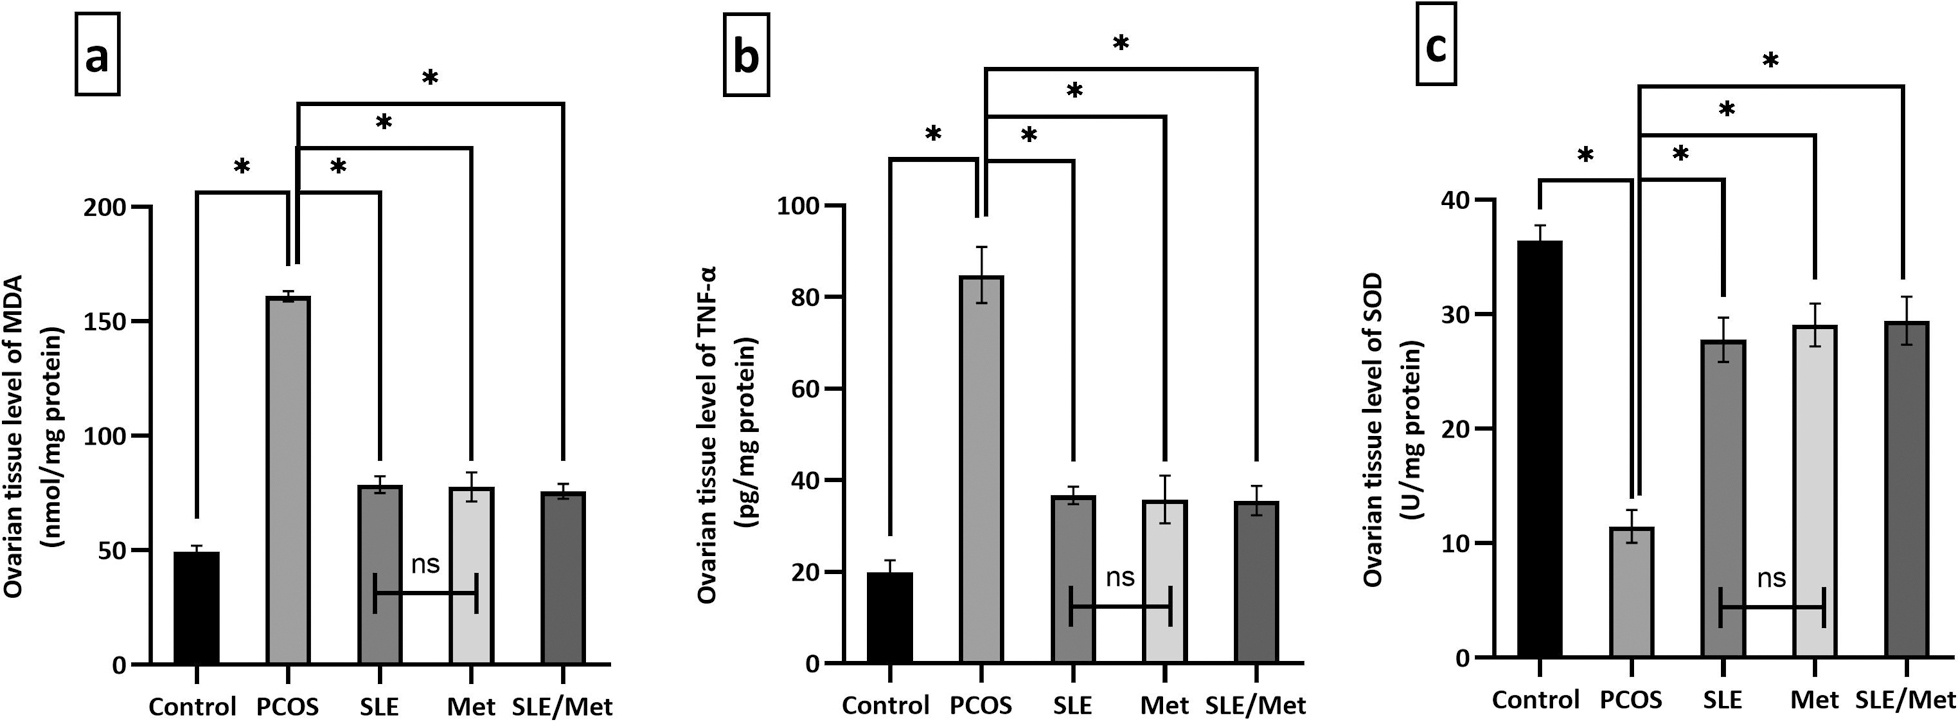
The ovarian tissue concentrations of MDA and TNF-α (Fig. 4a, b) showed a significant increase (P < 0.001) in the PCOS group meanwhile, a significant decrease (P < 0.001) was noted in the SOD levels (Fig. 4c), in comparison to the control animals. A significant decrease (P < 0.001) in MDA and TNF-α levels was significantly notable (P < 0.001) in SLE, metformin, and SLE/metformin-treated animals. However, the SOD levels were significantly increased (P < 0.001) in all the treatment groups, when compared to the PCOS-induced group.
Effect of SLE on the histological structure of the ovary of treated rats
Hematoxylin & Eosin-stained ovarian sections from the control rats showed different ovarian follicles in various stages of follicular maturation with clearly observed multiple corpora lutea. No structural abnormalities were observed in germinal epithelium, tunica albuginea or cortical stroma. The ovarian medulla seems with normal vascularity (Fig. 5a). Oocytes appeared intact with normal arrangement and thickness of granulosa and theca cell layers (Fig. 6a).

In the PCOS-induced group, letrozole treatment resulted in an arrest of the follicular growth. All sections showed ovarian follicles in early developmental stages with few numbers or even absent corpus luteum. In addition, many large subcapsular cystic follicles were observed. Furthermore, dilated and congested blood capillaries were observed (Fig. 5b, c). The lining granulosa cell layers were few and loosely attached with thickening of the outer theca (Fig. 6b).
On the other hand, animals receiving stevia, metformin, or both combined showed restoration of the follicular development comparable with the control group. All treated groups (Figs. 5d–f, respectively) showed an increasing number of the mature follicles and corpora lutea embedded within the cortical stroma. Also, the mentioned groups showed an improvement in the thickness of both granulosa and theca cell layers (Figs. 6c–e, respectively).
Regarding the trichrome stained sections, the control group showed a minimal amount of interstitial collagen fibre deposition (Fig. 7a). However, the PCOS group showed excess interstitial fibrosis (Fig. 7b) which was reduced in SLE, metformin, and both-treated groups (Figs. 7c–e, respectively).
Immunohistochemical findings
VEGF immunostained ovarian sections (Fig. 8) showed weak VEGF expression in the control group (Fig. 8a), observed in the germinal epithelium, oocyte, liquor fluid, and vascular walls in addition to minimal granulosa cell expression. However, the PCOS group (Fig. 8b) showed marked VEGF expression in granulosa cells (GC) of cystic follicles, liquor fluid with negative reaction of theca cells. SLE-treated group (Fig. 8c) showed moderate VEGF expression in granulosa cells, oocyte and vascular walls. Metformin and SLE/metformin-treated groups (Fig. 8d, e respectively) showed the vascular walls, granulosa cells of the ovarian follicles and corpora lutea with weak VEGF reaction. Similarly, the anti-TGF β immunoreaction (Fig. 9) showed negative expression with few weakly positive granulosa cells in the control group (Fig. 9a). Meanwhile, the PCOS group (Fig. 9b) showed marked TGF-β immunoexpression which was prominent in granulosa and theca cells. Stevia treatment (Fig. 9c) showed minimal TGF-β reaction in granulosa cells and theca layer. On the other hand, the metformin-treated group (Fig. 9d) showed moderate reaction limited to granulosa cells. Both combined (Fig. 9e) showed a more TGF-β expression in the granulosa cells of the ovarian follicles and corpora lutea.


The mean number of the mature follicles and corpora lutea was significantly decreased (P < 0.001) in PCOS group when compared to the control (Table 2). Meanwhile, treatment with SLE, metformin, and both combined showed a significant increase (P < 0.001) when compared to the PCOS group. Regarding the mean number of cystic follicles, there was a significant increase (P < 0.001) in the PCOS group comparing to the control, while the 3 treatment options resulted in a significant decrease (P < 0.001). No statistically significant difference was noted when comparing between the SLE and metformin-treated groups regarding the measured follicular parameters. In figure 6f, the PCOS group showed a significant decrease (P < 0.001) meanwhile a significant increase (P < 0.001) in the mean thickness of the granulosa cell and theca cell layers respectively when compared to the control. SLE, metformin and combination group showed a significant reversal (P < 0.001) of the mean thickness of the measured cell layers.
Table 2.
Changes in the mean number of the ovarian follicles and follicular cysts per ovary in the treated and non-treated PCOS groups
|
Control |
PCOS |
SLE |
Met |
SLE/Met |
| NO of mature follicles/ovary |
5.24 ± 1.2 |
1.1 ± 0.94a |
4.1 ± 1.04ab |
4.6 ± 1.6b |
4.7 ± 1.7b |
| NO of corpora lutea/ovary |
7.24 ± 1.22 |
1.04 ± 0.8a |
5.9 ± 1.47ab |
5.43 ± 1.43ab |
6.19 ± 1.6b |
| NO of cystic follicles/ovary |
0.52 ± 0.6 |
6.76 ± 2.3a |
2.62 ± 1.72ab |
1.91 ± 1.34ab |
1.91 ± 1.55ab |
Values were presented as a mean of 7 rats ± SD, using one way ANOVA post hoc Tukey test, P value < 0.001. a: signifcant versus control. b: significant versus PCOS group.
The mean area percents of collagen fibres deposition, VEGF, and TGF-β immunoreactivities were displayed in Figs. 7f, 8f, and 9f respectively. PCOS group showed a significant increase (P < 0.001) in the 3 measured parameters when compared to control. All treated groups showed a significant decrease (P < 0.001) in the measured parameters, in relation to PCOS group. SLE was superior to metformin in reducing ovarian fibrosis and TGF immunoreaction, whereas metformin was superior in modulating VEGF expression.
IV. Discussion
PCOS has been recognized as the most common endocrine disorder in premenopausal females [10]. Metformin has been identified as a therapeutic strategy for PCOS with common gastrointestinal tract (GIT) side effects [2]. As an alternative, the present study was attempted to investigate the therapeutic potential of SLE, versus metformin, in the current rat model of letrozole-induced PCOS. In addition, the mechanistic aspect of such protection was evaluated using histological, immunohistochemical, and biochemical methods.
In the current study, the control female rats exhibited a regular oestrous cycle however, a 21-day letrozole administration led to disturbance of the oestrous cyclicity and persistence of the diestrous phase as confirmed by the Giemsa-stained vaginal smears. Noteworthy, letrozole is an aromatase inhibitor that blocks the conversion of androgens into estrogen [24]. This explained the hyperandrogenism and the decreased estrogen and progesterone levels as well as the disturbed oestrous cycle with subsequent increase in the body weight as demonstrated by Walters et al. [36]. SLE treatment resulted in the restoration of the regular pattern of the oestrous cycle in 71.4% of rats. Also, metformin either alone or combined with SLE restored the oestrous cycle (85.7% of the rats in each group). Such improvement in the rat oestrous cyclicity may be correlated with an alteration in the circulating sex hormones, due to modulation of the aromatization of androgens into estrogen that regulates the ovarian histoarchitecture and function. Indeed, the estrogen and progesterone levels were significantly increased while the testosterone was significantly decreased in SLE, metformin, and SLE/metformin-treated groups when compared to the PCOS group with the excellence of metformin alone in restoring the hormonal profile. Parallel to our finding, Shpakov [31] has reported a suppressive effect of metformin on ovarian steroidogenesis.
Hyperglycemia was remarkable in the animals of PCOS group which showed a significant increase in the blood glucose and insulin levels as well as insulin resistance (indicated by HOMA-IR) when compared to control rats. The current disturbance in insulin/glucose metabolism exerted by letrozole is mainly due to androgen excess as reported by Diamanti-Kandarakis et al. [13]. Either SLE, metformin or both combined significantly restored blood glucose levels, meanwhile the insulin level was significantly improved in metformin-treated group only although both SLE and metformin have equal efficacy in decreasing insulin resistance. Inconsistent with the current finding, Assi et al. [3] reported more effectiveness of SLE than metformin, in decreasing the insulin resistance in a rat model of type 2 DM due to its major role in increasing the adiponectin level. Such discrepancy might be attributed to the different gender of the rats, experimental design and different animal modelling.
Consistent with our findings, the disturbed hormonal profile in PCOS group could lead to hypercholesterolemia and hypertriglyceridemia as proposed by Pan et al. [23] and Spałkowska et al. [32] who suggested that hyperandrogenism is a leading cause of abnormal lipid profile. SLE-treated animals showed a significant reduction in total cholesterol and TGs with equal efficacy compared to metformin treatment. In accordance, Ahmad et al. [1] reported an anti-hyperlipidemic efficacy of SLE that was attributed to stevioside constituents (was supplied in the given formula) that can reduce blood cholesterol and triglycerides (TGs) levels by stimulating lipase activity produced by the liver as well as increase their faecal excretion.
H & E stained sections of letrozole-induced PCOS group showed a significant increase in the number of cystic follicles as well as a significant decrease in the number of the corpora lutea as proven by the histomorphometric study. Also, there was a significant reduction in the granulosa cell layer thickness which might be hormonal dependent. This notion was supported by Matsuda et al. [20] who demonstrated that the survival of granulosa cells depends on estrogen, so letrozole-induced inhibition of aromatase leads to granulosa cells degeneration. Similarly, Rajan and Balaji [26] reported a parallel detrimental effect of letrozole on the ovarian histological structure. Both SLE and metformin either alone or combined produced a remarkable improvement of the ovarian histological structure in PCOS and was confirmed by the significant increase in the mean number of corpora lutea and significant decrease of the cystic follicles. The improved ovarian histoarchetcture could be related to the anti-androgenic property of the treatment options.
Moreover, the study investigated the contribution of inflammation, oxidative stress, angiogenesis, and ovarian fibrosis to the pathophysiology of PCOS and evaluated the role of SLE in counteracting such alterations. The PCOS group showed a significant increase in the ovarian tissue levels of MDA and TNF-α meanwhile, a significant decrease in SOD was noted when compared to the control. Parallel to such findings, Zuo et al. [42] explained a significant role of chronic inflammation and oxidative stress in the pathogenesis of PCOS. All treated groups including SLE showed a significant improvement in the altered parameters with almost equal efficacy. SLE, in particular, stevioside constituents have anti-inflammatory and anti-oxidative damage properties [41], thereby explaining the reduced TNF-α and increased SOD levels in the current research compared to the PCOS group. Furthermore, the antidiabetic effect of SLE facilitated the reduction in MDA due to the amelioration of hyperglycemia, the cornerstone of lipid peroxidation and ROS release [35]. Noteworthy, the binding sites of androgen receptors are present on the VEGF promoter region, hence androgen binding could lead to VEGF gene expression activation [14], therefore the hyperandrogenism demonstrated the reason behind the increase in the area percent of VEGF immunoexpression in PCOS group and was consistent with the increased ovarian vasculature in H&E stained sections. Furthermore, it has been reported that insulin has a pleiotropic effect on VEGF expression and angiogenesis in different organs [16] which also explained the increased VEGF immunoexpression in PCOS group. Accordingly, the suppressor effect of SLE on androgen could explain the reduced VEGF immunoexpression in the SLE-treated group. On the other hand, metformin significantly decreased the area percent of VEGF expression more than SLE which could be attributed to its significant dual effect on both insulin and androgen secretion. This explanation was supported by Di Pietro et al. [11] who reported a regulatory effect of metformin on ovarian angiogenesis in a rat model of PCOS.
In addition, the PCOS animal group showed a marked increase in the TGF-β immunoexpression and was confirmed by the significant increase in the mean area percent of TGF-β immunoreactivity. TGF-β has been encountered in different biological processes such as angiogenesis and tissue fibrosis [12] which was consistent with our findings. Masson staining showed a significant increase in the area percent of collagen fibres in PCOS group indicating a more fibrous tissue deposition. In the same context, the abnormal high TGF-β expression stimulates the proliferation of theca-interstitial cells, the main sources of androgen in normal ovary resulting in androgen excess [40]. The histomorphometric findings reported an increase in the mean theca cell thickness which confirmed the previous notion of Zhou and his colleagues [40]. The excess androgen combined with the high TGF-β expression could disrupt the balance of fibrotic factors (such as MMPs and TIMPs) on the ECM resulting in interstitial fibrosis which was supported by Cabral-Pacheco et al. [6]. SLE treatment caused a marked improvement in the amount of Masson-stained collagen fibres and TGF immunoexpression which was confirmed by a significant decrease in the mean area percent of fibrous tissue deposition and TGF-β immunoreactivity when compared to PCOS group with no statistical significance in comparison to metformin treatment. The anti-fibrotic effect of metformin in various organs has been proposed in literature including the dehydroepiandrosterone-induced ovarian fibrosis [39]. Interestingly, the study might reveal a potential anti-fibrotic effect for SLE against the ECM and ovarian fibrogenesis via suppressing TGF-β expression as suggested by Mehmood et al. [21] who found a potential renoprotective effect of stevia residue extract on the adenine-induced kidney injury in mice through inhibiting TGF-β1/Smad signalling pathway.
In conclusion, the current study is the first such attempt to combine both stevia leaf extract and metformin in a rat model of letrozole-induced PCOS. The majority of findings indicated almost equal efficacy with no statistical significance between SLE and metformin with superiority of the latter in reversing the hormonal changes and regulating angiogenesis. Both choices restored the oestrous cycle and improved the altered metabolic and histological changes elicited in the ovary and the combination of both had no additive or synergistic effects. The study suggested anti-inflammatory, antioxidant, antidiabetic, antihyperlipidemic, anti-fibrotic, and angiogenesis regulating effects as mechanistic aspects for SLE in improving PCOS. Together, the diverse biological impacts of a natural product; SLE make it an alternative for metformin and recommend it as a promising remedy for treating clinical and pathological effects in PCOS patients. Future studies are warranted attempting higher doses of SLE that might confirm the superiority of SLE over metformin in ameliorating PCOS.
V. Conflicts of Interest
All authors have no conflict of interest to declare.
VI. Funding
This research did not receive any specific grant from funding agencies in the public, commercial, or not-for-profit sectors.
VII. References
- 1 Ahmad, U., Ahmad, R. S., Arshad, M. S., Mushtaq, Z., Hussain, S. M. and Hameed, A. (2018) Antihyperlipidemic efficacy of aqueous extract of Stevia rebaudiana Bertoni in albino rats. Lipids Health Dis. 17; 1–8.
- 2 Aljofan, M. and Gaipov, A. (2019) Metformin: a stroke of luck. Electron. J. Gen. Med. 16; em143.
- 3 Assi, A.-A., Abdel-Rahman, M. S., Ashry, E. E. and Abd-Elhamid, D. H. (2019) The Potential Utility of Aqueous Extract of Stevia Rebaudiana Bertoni in Adjunct with Metformin in Treating Diabetes Mellitus. Am. J. Biomed. Sci. Res. 17; 13134–13146.
- 4 Bancroft, J. D. and Layton, C. (2019) The Hematoxylins and Eosin/Connective and other mesenchymal tissues with their stains. In “Bancroft’s Theory and Practice of Histological Techniques E-Book, 8th ed.”, ed. by K. S. Suvarna, C. Layton and J. D. Bancroft, Elsevier Health Sciences.
- 5 Bonnet, F. and Scheen, A. (2017) Understanding and overcoming metformin gastrointestinal intolerance. Diabetes Obes. Metab. 19; 473–481.
- 6 Cabral-Pacheco, G. A., Garza-Veloz, I., Ramirez-Acuña, J. M., Perez-Romero, B. A., Guerrero-Rodriguez, J. F., Martinez-Avila, N., et al. (2020) The roles of matrix metalloproteinases and their inhibitors in human diseases. Int. J. Mol. Sci. 21; 9739.
- 7 Carrera-Lanestosa, A., Moguel-Ordóñez, Y. and Segura-Campos, M. (2017) Stevia rebaudiana Bertoni: a natural alternative for treating diseases associated with metabolic syndrome. J. Med. Food 20; 933–943.
- 8 Cora, M. C., Kooistra, L. and Travlos, G. (2015) Vaginal cytology of the laboratory rat and mouse: review and criteria for the staging of the estrous cycle using stained vaginal smears. Toxicol. Pathol. 43; 776–793.
- 9 de Melo, A. S., Dias, S. V., de Carvalho Cavalli, R., Cardoso, V. C., Bettiol, H., Barbieri, M. A., et al. (2015) Pathogenesis of polycystic ovary syndrome: multifactorial assessment from the foetal stage to menopause. Reproduction 150; R11–R24.
- 10 Delitala, A. P., Capobianco, G., Delitala, G., Cherchi, P. L. and Dessole, S. (2017) Polycystic ovary syndrome, adipose tissue and metabolic syndrome. Arch. Gynecol. Obstet. 296; 405–419.
- 11 Di Pietro, M., Parborell, F., Irusta, G., Pascuali, N., Bas, D., Bianchi, M. S., et al. (2015) Metformin regulates ovarian angiogenesis and follicular development in a female polycystic ovary syndrome rat model. Endocrinology 156; 1453–1463.
- 12 Di Pietro, M., Pascuali, N., Parborell, F. and Abramovich, D. (2018) Ovarian angiogenesis in polycystic ovary syndrome. Reproduction 155; R199–R209.
- 13 Diamanti-Kandarakis, E., Papalou, O. and Kandaraki, E. A. (2019) The Role of Androgen Excess on Insulin Sensitivity in Women. Front. Horm. Res., 53; 50–64.
- 14 Eisermann, K. and Fraizer, G. (2017) The androgen receptor and VEGF: mechanisms of androgen-regulated angiogenesis in prostate cancer. Cancers 9; 32.
- 15 Elnaga, N. I. E. A., Massoud, M. I., Yousef, M. I. and Mohamed, H. H. A. (2016) Effect of stevia sweetener consumption as non-caloric sweetening on body weight gain and biochemical’s parameters in overweight female rats. Ann. Agric. Sci. 61; 155–163.
- 16 Escudero, C. A., Herlitz, K., Troncoso, F., Guevara, K., Acurio, J., Aguayo, C., et al. (2017) Pro-angiogenic role of insulin: from physiology to pathology. Front. Physiol. 8; 204.
- 17 Grotto, D., Maria, L. S., Valentini, J., Paniz, C., Schmitt, G., Garcia, S. C., et al. (2009) Importance of the lipid peroxidation biomarkers and methodological aspects for malondialdehyde quantification. Quim. Nova 32; 169–174.
- 18 Kiernan, J. A. (2015) Immunohistochemistry. In “Histological and Histochemical Methods. Theory and Practice, 4th ed.”, ed. by J. Kiernan, Scion Publishing Ltd., pp. 454–490.
- 19 Lowry, O. H., Rosebrough, N. J., Farr, A. L. and Randall, R. J. (1951) Protein measurement with the Folin phenol reagent. J. Biol. Chem. 193; 265–275.
- 20 Matsuda, F., Inoue, N., Manabe, N. and Ohkura, S. (2012) Follicular growth and atresia in mammalian ovaries: regulation by survival and death of granulosa cells. J. Reprod. Dev. 58; 44–50.
- 21 Mehmood, A., Zhao, L., Ishaq, M., Zad, O. D., Zhao, L., Wang, C., et al. (2020) Renoprotective effect of stevia residue extract on adenine-induced chronic kidney disease in mice. J. Funct. Foods 72; 103983.
- 22 NIH (2011) Guide for the Care and Use of Laboratory Animals, 8th ed., National Academies Press (US). https://doi.org/10.17226/12910
- 23 Pan, J.-X., Tan, Y.-J., Wang, F.-F., Hou, N.-N., Xiang, Y.-Q., Zhang, J.-Y., et al. (2018) Aberrant expression and DNA methylation of lipid metabolism genes in PCOS: a new insight into its pathogenesis. Clin. Epigenetics 10; 1–12.
- 24 Patel, S. (2017) Disruption of aromatase homeostasis as the cause of a multiplicity of ailments: A comprehensive review. J. Steroid Biochem. Mol. Biol. 168; 19–25.
- 25 Rababa’h, A. M., Matani, B. R. and Ababneh, M. A. (2020) The ameliorative effects of marjoram in dehydroepiandrosterone induced polycystic ovary syndrome in rats. Life Sci. 261; 118353.
- 26 Rajan, R. K. and Balaji, B. (2017) Soy isoflavones exert beneficial effects on letrozole-induced rat polycystic ovary syndrome (PCOS) model through anti-androgenic mechanism. Pharm. Biol. 55; 242–251.
- 27 Rashad, N. M., Amin, A. I., Ali, A. E. and Soliman, M. H. (2018) Influence of obesity on soluble endoglin and transforming growth factor β1 in women with polycystic ovary syndrome. Middle East Fertil. Soc. J. 23; 418–424.
- 28 Reddy, P. S., Begum, N., Mutha, S. and Bakshi, V. (2016) Beneficial effect of Curcumin in Letrozole induced polycystic ovary syndrome. Asian Pac. J. Reprod. 5; 116–122.
- 29 Rencber, S. F., Ozbek, S. K., Eraldemır, C., Sezer, Z., Kum, T., Ceylan, S. and Guzel, E. (2018) Effect of resveratrol and metformin on ovarian reserve and ultrastructure in PCOS: an experimental study. J. Ovarian Res. 11; 55.
- 30 Shawky, L. M., Morsi, A. A., El Bana, E. and Hanafy, S. M. (2020) The Biological Impacts of Sitagliptin on the Pancreas of a Rat Model of Type 2 Diabetes Mellitus: Drug Interactions with Metformin. Biology 9; 1–27.
- 31 Shpakov, A. O. (2021) Improvement Effect of Metformin on Female and Male Reproduction in Endocrine Pathologies and Its Mechanisms. Pharmaceuticals 14; 42.
- 32 Spałkowska, M., Mrozińska, S., Gałuszka-Bednarczyk, A., Gosztyła, K., Przywara, A., Guzik, J., et al. (2018) The PCOS patients differ in lipid profile according to their phenotypes. Exp. Clin. Endocrinol. Diabetes 126; 437–444.
- 33 Sun, Y. I., Oberley, L. W. and Li, Y. (1988) A simple method for clinical assay of superoxide dismutase. Clin. Chem. 34; 497–500.
- 34 Tohma, Y. A., Onalan, G., Tepeoglu, M., Bayraktar, N., Colak, E., Ozcimen, E. E., et al. (2019) Phosphodiesterase 4 inhibitor plus metformin is superior to metformin alone for the treatment of polycystic ovary syndrome: A rat model study. Exp. Ther. Med. 17; 4013–4022.
- 35 Van Steenbergen, A., Balteau, M., Ginion, A., Ferté, L., Battault, S., de Ravenstein, C. de M., et al. (2017) Sodium-myoinositol cotransporter-1, SMIT1, mediates the production of reactive oxygen species induced by hyperglycemia in the heart. Sci. Rep. 7; 1–14.
- 36 Walters, K. A., Bertoldo, M. J. and Handelsman, D. J. (2018) Evidence from animal models on the pathogenesis of PCOS. Best Pract. Res. Clin. Endocrinol. Metab. 32; 271–281.
- 37 Wang, M., Li, H., Xu, F., Gao, X., Li, J., Xu, S., et al. (2018) Diterpenoid lead stevioside and its hydrolysis products steviol and isosteviol: Biological activity and structural modification. Eur. J. Med. Chem. 156; 885–906.
- 38 Xie, Q., Xiong, X., Xiao, N., He, K., Chen, M., Peng, J., et al. (2019) Mesenchymal stem cells alleviate DHEA-Induced polycystic ovary syndrome (PCOS) by inhibiting inflammation in mice. Stem Cells Int. 2019.
- 39 Zhang, X., Zhang, C., Shen, S., Xia, Y. J., Yi, L., Gao, Q., et al. (2013) Dehydroepiandrosterone induces ovarian and uterine hyperfibrosis in female rats. Hum. Reprod. 28; 3074–3085.
- 40 Zhou, F., Shi, L.-B. and Zhang, S.-Y. (2017) Ovarian fibrosis: a phenomenon of concern. Chin. Med. J. 130; 365.
- 41 Zou, X., Tan, Q., Goh, B.-H., Lee, L.-H., Tan, K.-L., Ser, H.-L. (2020) ‘Sweeter’ than its name: anti-inflammatory activities of Stevia rebaudiana. All Life 13; 286–309.
- 42 Zuo, T., Zhu, M. and Xu, W. (2016) Roles of oxidative stress in polycystic ovary syndrome and cancers. Oxid. Med. Cell. Longev. 2016.