Abstract
Background: Resting myocardial blood flow (rMBF) within regions of myocardial scar as measured by positron emission tomography (PET) has not yet been assessed with the radiotracer Rubidium82 (Rb82) or correlated with scar thickness. Cardiac magnetic resonance imaging (cMRI) offers high spatial resolution and identifies myocardial scar with late gadolinium enhancement (LGE). Using Rb82 PET, we sought to characterize rMBF in regions of myocardial scar of varying thicknesses determined by cMRI.
Methods/Results: Patients with a history of myocardial infarction, a resting Rb82 PET study and a cMRI were identified. On cMRI, regions of infarction, defined as >50% LGE with akinesis, were sub-categorized as 50–75% LGE or >75% LGE, corresponding with increasing transmural scar thickness. PET zones of infarct based on size and %LGE by cMRI were quantified for mean and minimum rMBF. Mean rMBF (cc/min/g) in infarct zones with >75% LGE was 0.32±0.07 with a minimum rMBF of 0.19±0.03. In infarct zones with 50–75% LGE, rMBF was 0.45±0.14 (50–75% vs. >75%, p=0.002).
Conclusions: We identified rMBF within cMRI confirmed regions of myocardial scar of varying thicknesses. rMBF has an inverse relationship with the extent of LGE on cMRI, with the most severe regions (>75% LGE) having mean and minimal rMBF (cc/min/g) of 0.32±0.07 and 0.19±0.03, respectively.
Absolute quantitative resting myocardial blood flow (rMBF) in regions of myocardial scar has been described with positron emission tomography (PET) utilizing nitrogen13 (N13) in human studies (1–4) and radiolabeled microspheres in canine studies (5, 6). However, analysis with the most common and available PET perfusion radiotracer, rubidium82 (Rb82), has not been described. Furthermore, rMBF by PET within infarct zones of varying myocardial thickness has not been reported in humans. Cardiac magnetic resonance imaging (cMRI) has high spatial resolution and with late gadolinium enhancement (LGE) can distinguish intact myocardial tissue from scar, as well as assess scar thickness (7). As the percentage of LGE increases within a segment, so does the transmurality of infarct, which also correlates with scar thickness on an anatomic and segmental level (8, 9).
In the current study, we sought to determine rMBF within regions of cMRI-defined scar of varying thicknesses, using PET with Rb82.
Methods
The study was approved by the Ochsner Medical Center Institutional Review Board. Patients with a history of a myocardial infarction (MI), a resting cardiac PET scan and a cMRI with gadolinium were identified through a hospital database query. Patients were “recruited” by reviewing all PET scans performed at our institution and between January 1st, 2012 and December 31st, 2017, the enrollment period, and cross referenced with our cMRI database to find patients who had cMRI performed <90 days before or any period after PET. From the initial query we identified 19 patients, 1 was subsequently excluded for not meeting the minimum definition of scar as detailed below, and 2 were excluded for insufficient LGE imaging for post processing analysis. The clinical terms “infarct”, “scar”, and “viability”, as they pertain to this manuscript could cause confusion. As such, the term “scar” will predominantly be used in the context of image analysis and figures/tables. The intent of this study was to identify rMBF within scarred/nonviable/dead myocardium and not to assess tissue viability or draw conclusions regarding rMBF within viable tissue or surrounding the infarct.
Definitions/Inclusion criteria
Myocardial scar by cMRI was defined as a contiguous area of myocardium with ≥50% LGE with akinesis on gated imaging, comprising ≥5% of the left ventricular (LV) myocardium (8). The cMRI analysis of scar was further stratified into those segments with 50–75% LGE (non-transmural myocardial infarct) and >75% LGE (transmural myocardial infarct) (10). Scar on PET was defined as a relative radiotracer uptake <60% of maximum in a contiguous area ≥5% of the total myocardium on resting images. These regions appear as the green and/or blue defects on relative perfusion images seen in Figure 1. This threshold (size and severity) has been published previously and was consistent with a visually obvious defect in all studies (11, 12). Patients were selected for analysis if the perfusion defect on resting PET images and scar on cMRI were visually obvious to be of similar size and located in the same territory of the LV myocardium, and:
1) the cMRI was obtained prior to the PET scan; or
2) the cMRI was obtained <90 days after the PET scan, provided:
a) there was evidence of a prior scar at the time of the PET scan (echocardiographic wall motion abnormalities, Q-waves on electrocardiography and/or a clinical history of an MI).
No revascularization procedure was performed between the dates of the cMRI and PET scan, for any patient.
Image acquisition
Cardiac MRIs were performed on a Philips Intera 1.5-T CV system (Philips Medical Systems, the Netherlands) equipped with master gradients with peak strength of 30 mT/m and slew rate of 150 T/m per second. Images were obtained with 10–15 second breath-hold and prospective gating using a 4-element vectorcardiogram. Standard SSFP images were obtained in the vertical, horizontal, left ventricular outflow tract long axis, and short axis stack. Gadolinium (gadobente dimeglumine) was administered, and at 10 minutes after injection, scans for delayed hyperenhancement were obtained in the same aforementioned orientations after the appropriate inversion time (TI) was determined.
As previously described (12, 13), cardiac PET imaging was performed using list-mode 2D acquisition on an Attrius PET scanner (Positron, Westmont, IL) with Ge-68 rod source attenuation correction using 1295 to 1850 MBq (35 to 50 mCi) of generator-produced Rb82 (Bracco Diagnostics, Monroe Township, NJ). The optimal region of interest for the arterial input function was determined using integrated images acquired during the first 2 min after each radiotracer injection. The integrated arterial input and myocardial uptake were used to compute rMBF using a simple retention model which closely correlates with invasively derived myocardial flow (14). For the whole heart and infarct zones, rMBF, percent relative uptake (%RU) and percent of myocardium were automatically calculated using a research version of FDA-approved software (HeartSeeTM V2.3.3, University of Texas, Houston, TX).
Image analysis
All cMRI images were evaluated on a segmental level for wall motion abnormalities by 2 independent interpreters. LGE was evaluated in short axis, with each 5-mm slice being divided into 12 equal segments. Within each slice a region of interest was selected as normal myocardium and a semi-automated analysis defined LGE as tissue >5 standard deviations (SD) above normal myocardial uptake. For all studies myocardial scar was defined as those segments with ≥50% LGE within the volume of the segment and akinesis on cine gated images (8, 9). The scar was further subdivided into those segments with 50–75% LGE (non-transmural infarction) and >75% LGE (transmural infarction), for sub-analysis. For each analysis the number of segments with a pre-specified LGE amount were summed and then divided by the total number of segments to calculate size as a percentage of the total myocardium. All studies were processed using CVI42 software (Circle Cardiovascular Imaging Inc., Calgary, AB, Canada).
Once the infarct size by cMRI was obtained for each study, the corresponding PET was visually registered with the MRI and a region of interest (ROI) was drawn around the perfusion abnormality. Within the total infarct, percentages of myocardium with 50–75% LGE and >75% LGE by cMRI were used to visually registered the location on PET. These regions were analyzed for percent relative uptake (%RU) as well as mean and minimum rMBF. A representative example is found in Figure 1. RMBF and size were also calculated in a “normal” comparator region of myocardium by selecting a ROI around a contiguous zone of myocardium ≥10% of total myocardium with ≥80% maximum uptake.
Statistical testing was performed using SPSS software Version 20.0 (IBM SPSS, Armonk, NY). Results are expressed as mean±SD or as median and interquartile range (IQR), as appropriate. The normality of variables’ distributions was verified using Q-Q plots and the Shapiro-Wilk test. The differences between regional rMBF within infarct zones and normal myocardial zones were assessed using paired Student’s t-tests. Two-sided p<0.05 was considered statistically significant.
Results
Sixteen patients (81% male, age 59±12 years) were identified. Patient-level data derived from the cMRI and PET scans are shown in Table 1 and 2. Twelve of 16 patients had definitive dates of their infarct identified in health records. Of these patients, the median time between the patients’ clinical infarct and cMRI scan was 872 days [IQR 46-1765]. In 11 of 16 patients, the cMRI was obtained prior to the PET scan. The median time between scans was -154 days [IQR -500: -26] (negative values indicate the MRI occurred before the PET). In 5 of 16 patients, the PET scan was obtained prior to the cMRI scan. In these 5 patients, the median time between scans was 27 days [IQR 1: 54]. In 2 of 16 patients, the precise date of infarct was uncertain; however, the infarct occurred 7 and 10 years prior to the cMRI, respectively. In the other 2 patients, the date of the infarct was undetermined. Both patients had been admitted for congestive heart failure and workup revealed chronic total occlusions in the artery of the scar zone.
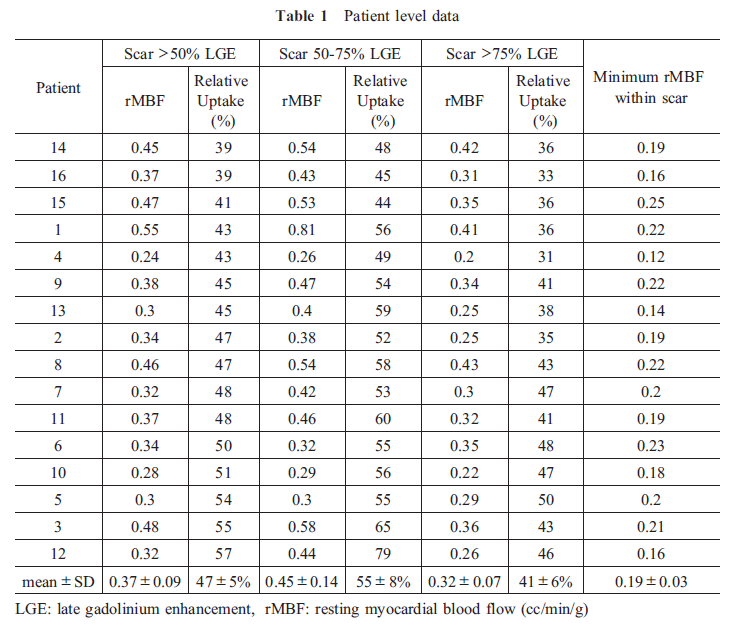

The mean total scar size was 34.5±12.3% and 34.0±12.7% (p=0.911) of the LV myocardium by MRI and PET, respectively. As transmurality of infarct increased, rMBF decreased. Within the total scar on PET corresponding to >50% LGE by cMRI, mean %RU was 47±5%, mean rMBF was 0.37±0.09 cc/min/g. Non-transmural scar, corresponding to 50–75% LGE, had a mean %RU of 55±8%, rMBF of 0.45±0.14 cc/min/g, and comprised 14±5% of the total myocardium. Transmural scar, corresponding to >75% LGE, had a mean %RU of 41±6%, rMBF of 0.32±0.07 cc/min/g, and comprised 20±12% of the total myocardium (p=0.002 vs >50–75% LGE). The mean minimum rMBF was 0.19±0.03 cc/min/g. In regions with myocardial scar>50% LGE, there was no significant difference in mean rMBF between zones with upstream occlusion of the major epicardial vessel vs. patency of the epicardial vessel, rMBF=0.34±0.07 vs. 0.4±0.07, p=0.162. In normal regions, mean %RU was 88±4% and mean rMBF was 0.78±0.27 cc/min/g (p<0.000001 vs. scar). The standard deviation of rMBF decreased with increasing transmurality of infarct. These results are summarized in Figure 2.

Discussion
The goal of the study was to identify rMBF within scar of various thickness with Rb82 PET. To achieve that goal, we used a multimodality evaluation, borrowing from the strengths of each modality (MRI’s spatial resolution and LGE, and PET’s depth-independent high-resolution imaging and precision for assessing rMBF). To our knowledge, this is the first report quantifying rMBF in zones of scar of varying thickness as measured with Rb82.
Our study has several important findings. First, our results are consistent with previous human studies utilizing N13, summarized in Table 3, which demonstrate a weighted mean rMBF of 0.31±0.1 cc/min/g within scar (1–4). Second, our results are consistent with animal studies, utilizing radiolabeled microbubbles and confirmed histologically, which demonstrated rMBF within infarcted segments averages ~0.30-.41 cc/min/g (5, 6). Third, we expanded on previous human studies by quantifying rMBF within regions of non-transmural vs. transmural scar. Finally, we demonstrated that as the percentage of LGE increases, the variability of rMBF decreases.

The clinical implications of the composite findings can easily be overlooked but are nonetheless, profound. PET as a quantitative tool provides the opportunity to measure MBF with precision and accuracy. However, with numerous commercial software packages (SP) available and increased utilization outside of dedicated research laboratories, data has shown significant differences in MBF derived from different SP (15, 16). In fact, current recommendations state that MBF values “may vary in different labs using different software” and “individual labs may adopt variations of thresholds” (17). The data (15, 16) and recommendations are contradictory to the nature of quantification and lead to confusion. Hence, a universally agreed upon, reproducible, and narrow reference range of rMBF would be of particular importance such that SP could be tested and improved. We suggest that the composite data confirm a “ground truth”; rMBF (cc/min/g) in regions of transmural myocardial scar is ~0.35 with a minimum rMBF of ~0.20 regardless of modality, radiotracer or kinetic model and as such could serve as a “low flow” reference for PET SP. These reference ranges have been demonstrated invasively, histologically and noninvasively with the 2 most common myocardial perfusion agents (N13 and Rb82).
In this study, we did not test the hypothesis that a minimum or threshold of rMBF could predict viability, and such conclusions should not be inferred. Our primary focus was to evaluate rMBF in regions of scar as defined by cMRI. Further studies are needed to determine if a lower limit threshold of rMBF could predict viability.
Limitations
This was a single-center retrospective study however the methodology has the potential for replication. We also used validated methods that are widely employed. Although the study size was small, it is comparable to the referenced studies that measured rMBF in scar (1–4).
The current study is predominantly male, which could impact the generalizability of our results. It is known that women have a higher average rMBF than men presumably due to differences in vessel size, hemodynamics, and endothelial function (18, 19). It is not known if these factors would also play a role in areas of transmural myocardial infarction with a large scar volume and a less intact arterial bed. Further studies with a larger female cohort would be required to definitively answer this question.
The cMRI and PET were performed on 2 different scanners and therefore there is inherent variability in registration of the images. However, any such variability is likely minimal given the large infarct sizes and would actually bias the data towards the null hypothesis.
Conclusions
We characterized rMBF within cMRI confirmed regions of myocardial scar of varying thicknesses using Rb82 PET. rMBF has an inverse relationship with the extent of LGE on cMRI. Mean rMBF (cc/min/g) in non-transmural scar (>50–75% LGE) was 0.45±0.14 decreasing to 0.32±0.07 in regions with transmural scar (>75% LGE).
Acknowledgments
None.
Sources of funding
None.
Conflicts of interest
Dr. Bober is a consultant for Bracco Diagnostics. There are no other relevant disclosures.
References
1. Czernin J, Porenta G, Brunken R, et al. Regional blood flow, oxidative metabolism, and glucose utilization in patients with recent myocardial infarction. Circulation 1993; 88: 884–95.
2. Sun KT, Czernin J, Krivokapich J, et al. Effects of dobutamine stimulation on myocardial blood flow, glucose metabolism, and wall motion in normal and dysfunctional myocardium. Circulation 1996; 94: 3146–54.
3. Gewirtz H, Fischman AJ, Abraham S, Gilson M, Strauss HW, Alpert NM. Positron emission tomographic measurements of absolute regional myocardial blood flow permits identification of nonviable myocardium in patients with chronic myocardial infarction. J Am Coll Cardiol 1994; 23: 851–9.
4. Beanlands RS, deKemp R, Scheffel A, et al. Can nitrogen-13 ammonia kinetic modeling define myocardial viability independent of fluorine-18 fluorodeoxyglucose? J Am Coll Cardiol 1997; 29: 537–43.
5. Rivas F, Cobb FR, Bache RJ, Greenfield JC. Relationship between blood flow to ischemic regions and extent of myocardial infarction. Serial measurement of blood flow to ischemic regions in dogs. Circ Res 1976; 38: 439–47.
6. Zhang WZ, Zha DG, Cheng GX, et al. Assessment of regional myocardial blood flow with myocardial contrast echocardiography: an experimental study. Echocardiography 2004; 21: 409–16.
7. Rehwald WG, Fieno DS, Chen EL, Kim RJ, Judd RM. Myocardial magnetic resonance imaging contrast agent concentrations after reversible and irreversible ischemic injury. Circulation 2002; 105: 224–9.
8. Kim RJ, Wu E, Rafael A, et al. The use of contrast-enhanced magnetic resonance imaging to identify reversible myocardial dysfunction. N Engl J Med 2000; 343: 1445–53.
9. Kim RJ, Fieno DS, Parrish TB, et al. Relationship of MRI delayed contrast enhancement to irreversible injury, infarct age, and contractile function. Circulation 1999; 100: 1992–2002.
10. Klein C, Nekolla SG, Bengel FM, et al. Assessment of myocardial viability with contrast-enhanced magnetic resonance imaging: comparison with positron emission tomography. Circulation 2002; 105: 162–7.
11. Gould KL, Martucci JP, Goldberg DI, et al. Short-term cholesterol lowering decreases size and severity of perfusion abnormalities by positron emission tomography after dipyridamole in patients with coronary artery disease. A potential noninvasive marker of healing coronary endothelium. Circulation 1994; 89: 1530–8.
12. Bober RM, Milani RV, Oktay AA, Javed F, Polin NM, Morin DP. The impact of revascularization on myocardial blood flow as assessed by positron emission tomography. Eur J Nucl Med Mol Imaging 2019; 46: 1226–39.
13. Bober RM, Thompson CD, Morin DP. The effect of coronary revascularization on regional myocardial blood flow as assessed by stress positron emission tomography. J Nucl Cardiol 2017; 24: 961–74.
14. Yoshida K, Mullani N, Gould KL. Coronary flow and flow reserve by PET simplified for clinical applications using rubidium-82 or nitrogen-13-ammonia. J Nucl Med 1996; 37: 1701–12.
15. Nesterov SV, Deshayes E, Sciagrà R, et al. Quantification of myocardial blood flow in absolute terms using 82Rb PET imaging: the RUBY-10 Study. JACC Cardiovasc Imaging 2014; 7: 1119–27.
16. Tahari AK, Lee A, Rajaram M, et al. Absolute myocardial flow quantification with 82Rb PET/CT: comparison of different software packages and methods. Eur J Nucl Med Mol Imaging 2014; 41: 126–35.
17. Murthy VL, Bateman TM, Beanlands RS, et al. Clinical quantification of myocardial blood flow using PET: joint position paper of the SNMMI cardiovascular council and the ASNC. J Nucl Cardiol 2018; 25: 269–97.
18. Chareonthaitawee P, Kaufmann PA, Rimoldi O, Camici PG. Heterogeneity of resting and hyperemic myocardial blood flow in healthy humans. Cardiovasc Res 2001; 50: 151–61.
19. Patel MB, Bui LP, Kirkeeide RL, Gould KL. Imaging microvascular dysfunction and mechanisms for female-male differences in CAD. JACC Cardiovasc Imaging 2016; 9: 465–82.

