Abstract
Background: Smoothing in 99mTc myocardial perfusion single-photon emission computed tomography (SPECT) often increases myocardial artifacts due to subdiaphragmatic activity near the heart. To reduce these artifacts, we developed a new process flow, masking on unsmoothed images (MUS), that includes the extraction of the myocardium by masking before smoothing.
Methods: This study evaluated the relationships between matrix sizes and distances to the subdiaphragmatic activity using the MUS method compared to conventional methods using a combination of image reconstruction methods (filtered back-projection [FBP] and ordered subset expectation maximization [OSEM]) with or without corrections (attenuation [AC], scatter [SC], and resolution recovery [RR]) using a myocardial phantom. The results were compared for two matrix sizes (pixel sizes) (128 × 128 [3.3 mm] and 64 × 64 [6.6 mm]); four subdiaphragmatic activity distances (5, 10, 15, and 20 mm); and three reconstruction methods (FBP without correction; OSEM with RR; and OSEM with AC, SC, and RR).
Results: In the conventional method, increasing distance resulted in interference with myocardial perfusion SPECT evaluation however, the artifacts were less apparent when the MUS method was applied. The images converted to 64 × 64 did not show the same effect as the 128 × 128 images, even when RR was used. The MUS method was useful for acquisition at 128 × 128, along with the use of RR in the reconstruction process.
Conclusion: MUS mitigated the effects of subdiaphragmatic activity on myocardial perfusion SPECT, particularly combined with 128 × 128 acquisitions and iterative reconstruction with RR.
In single-photon emission computed tomography (SPECT) of myocardial perfusion using 99mTc labeled radiotracers (99mTc-methoxyisobutylisonitrile [MIBI], 99mTc-tetrofosmin), hepatobiliary excretion of the radiotracers may result in prominent subdiaphragmatic activity in organs adjacent to the heart, predominantly the liver and bowel but also occasionally the stomach (1).
Activity in the subdiaphragmatic organs can interfere with the evaluation of myocardial perfusion SPECT, leading to two possible factors (2). Factor 1 can result in apparently increased activity of the adjacent inferior wall due to scatter and partial volume effects. This can mask a true defect in the inferior wall or may lead to normalization problems throughout the remainder of the myocardium owing to the increased activity in the inferior wall. In Factor 2, subdiaphragmatic ‘‘hot’’ activity can result in an apparent decreased activity in the adjacent myocardium. This results from the reconstruction algorithm used in filtered back-projection (FBP). FBP uses a ramp filter, which causes an artifactual decrease in the activity adjacent to hot objects. Statistical image reconstruction without a reconstruction filter (maximum likelihood expectation maximization, ordered subset expectation maximization, etc.) reduces these artifacts (3). Because myocardial perfusion SPECT images contain statistical noise, they are usually smoothed before and after image reconstruction. This smoothing process may enhance the effects of these factors on myocardial perfusion SPECT (4). Therefore, we developed a new image reconstruction process, masking on unsmoothed images (MUS), which involves extraction of the myocardium by masking before smoothing to reduce the effect of smoothing (5).
The widespread use of SPECT/CT systems has led to improved image quality and quantitative accuracy by incorporating various corrections including attenuation correction (AC), scatter correction (SC), and resolution recovery (RR) (6).
A previous study showed the usefulness of the MUS method based on the relationship between the subdiaphragmatic activity ratio and the myocardium (5). The present study evaluated the relationships between matrix sizes and distance to the subdiaphragmatic activity using the MUS method compared with conventional methods using a combination of image reconstruction methods (FBP and ordered subset expectation maximization [OSEM]) with or without corrections (AC, SC, and RR) using a myocardial phantom.
Materials and methods
-
New image reconstruction process flow
Figure 1(A) shows the image reconstruction process flow commonly used in SPECT/CT systems (conventional method) and the newly devised MUS image reconstruction process flow. MUS is characterized by a masking process to extract only the myocardium before smoothing. The MUS method uses cross-sectionally transformed unsmoothed horizontal long-axis (HLA), vertical long-axis (VLA), and short-axis (SA) images to obtain a three-dimensional (3D) ellipsoid region of interest (ROI) that includes only the myocardium, without subdiaphragmatic activity. The myocardial portion is extracted using an ellipsoid ROI before smoothing. We believe that the MUS method could improve both Factor 1 and Factor 2 and that additional statistical image reconstruction would improve these two factors responsible for the effects of subdiaphragmatic activity.
-
2.
Equipment and software
A Symbia T6 (Siemens Healthineers, Erlangen, Germany) SPECT/CT system equipped with a low-energy high-resolution (LEHR) collimator was used to perform the experiments. Image processing was performed using an image processing workstation, Syngo MI Apps (Siemens Healthineers, Erlangen, Germany) and DRIP (PDRadiopharma, Tokyo, Japan). Microsoft Excel 365 was used for graphing and statistical analysis.
-
3.
Acquisition and reconstruction conditions
The acquisition conditions were: matrix size, 128 × 128; zoom, 1.45 (pixel size: 3.3 mm); number of views, 60 views/360°; time per view, and time of the acquired myocardial average count at an anterior view at 30 counts/pixel. The acquired were converted to a matrix size of 64 × 64 pixels (pixel size 6.6 mm), and the same evaluation was performed.
Images were reconstructed for three types of processes using the conventional and MUS methods: FBP without correction, OSEM with RR (OSEM-RR), and OSEM with AC, SC, and RR (OSEM-ACSCRR). We used OSEM for image reconstruction, including 3D (transverse and axial) resolution recovery and attenuation correction (Flash3D, Siemens Healthineers, Erlangen, Germany). Both the 3D point spread function and attenuation effect were modeled in the forward and back-projection steps of the reconstruction (6). A Gaussian filter (FWHM:13.2 mm) was used for FBP and two OSEMs (iteration:12, subset:6).
-
4.
Evaluation of the effect of subdiaphragmatic activity using a myocardial phantom
This study evaluated whether the MUS method could suppress the effect of subdiaphragmatic activity on myocardial images on a myocardial phantom HL (Kyoto Kagaku Co., Ltd. Kyoto, Japan). The structure of the phantom is shown in Figure 1(B). Two types of images were acquired: one with no defect tip in the myocardial wall and one with a 2.0 cm diameter circular defect tip in the center of the inferior wall. The myocardium (120 mL) was filled with 99mTc solution (14.8 MBq (123 kBq/mL), assuming that approximately 2% of the administered dose would accumulate in the myocardium in clinical use. The cylinder was filled with 99mTc solution such that the ratio of radioactivity concentration to the myocardium was 1.5. This concentration ratios was based on the average count ratio of subdiaphragmatic activity near the heart to the myocardium (1.53 ± 0.5) obtained from 23 clinical images at 45 min after MIBI injection in rest myocardial perfusion SPECT with OSEM-ACSCRR images using the conventional method. Data with only water in the cylinder was also acquired as a reference image.
The left and right ventricles, mediastinum, liver, and stomach were filled with water.
As shown in Figure 1(C), circumferential profile curves (CPC) were created at 1-degree intervals counterclockwise from the 3 o'clock position within a circular ROI tangential to the epicardial for the central slice from which the defect in the SA image was delineated. The maximum value for the upper 180° of the myocardium (from 0° to 180°) was normalized to 100%. The same process was performed on the same slice for the images without defects. The differences in CPC in the reference image in each processing flow and in the images containing 99mTc at each distance relative to the reference image in each processing flow were compared to the reference image. The European Association of Nuclear Medicine (EANM) procedural guidelines (7) consider a regional perfusion distribution of ≥70% is considered to be within the normal range. Thus, we defined a defect as a minimum value of the 30° inferior wall (from 255° to 285°) of <70%.
Similarly, if the maximum value of the 30° inferior wall in an image without defects was >143%, it would be the maximum value of the entire curve and normalize it to 100% by multiplying the entire curve by a constant <0.7 (= 100/143). This would result in walls other than the inferior wall being <70% and, therefore, abnormally depicted. Thus, we defined the threshold at >143% for the image without defects.
Results
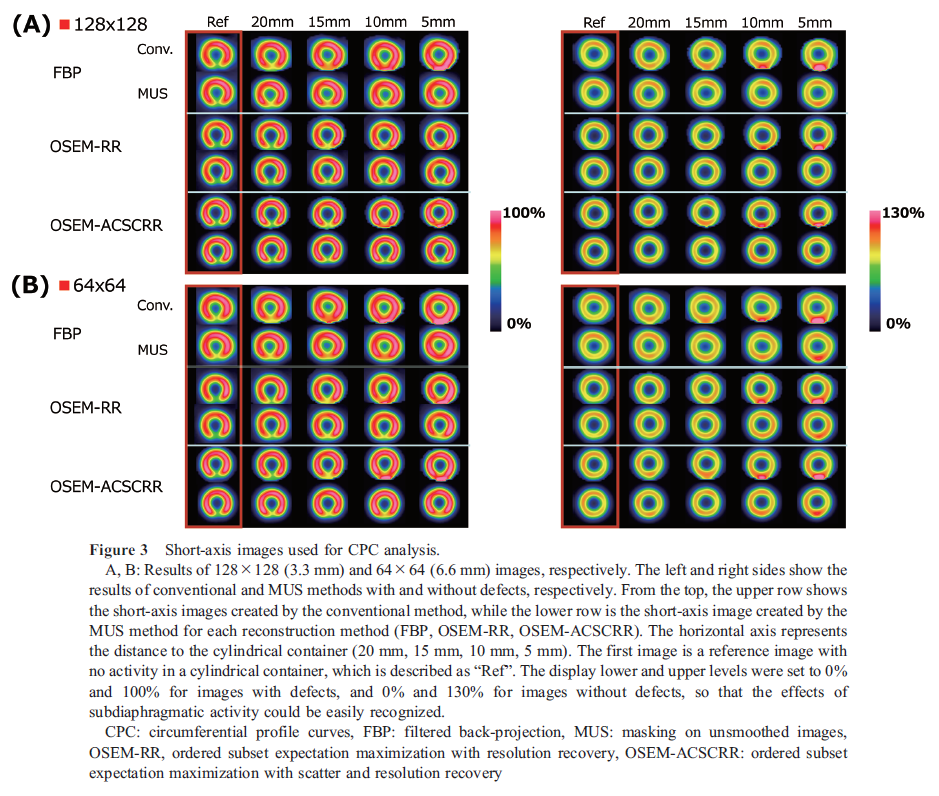
The analysis results of the CPC are shown in Figure 2.
In the images converted to 128 × 128 (3.3 mm), the minimum values of the inferior wall in the reference images with defects for the FBP, OSEM-RR, and OSEM-ACSCRR methods were 55.1%, 45.7%, and 53.5% for the conventional method and 56.0%, 46.0%, and 53.8% for the MUS method, respectively. The minimum value of the inferior wall for FBP was >70% at 15 mm, whereas OSEM-RR and OSEM-ACSCRR demonstrated distances of 10 mm in the conventional method. In the MUS method, the FBP was >70% at 5 mm. OSEM-RR and OSEM-ACSCRR did not exceed 70% at any distance. The maximum values of FBP, OSEM-RR, and OSEM-ACSCRR in the reference images without defects were 86.0%, 90.1%, and 99.4% for the conventional method, and 88.0%, 89.0%, and 100.9% for the MUS method, respectively. The conventional method showed that all the processes were >143% at 5 mm. The MUS method did not exceed 143% for any of the images.
In the images converted to 64 × 64 (6.6 mm), the minimum values of the inferior wall in the reference images with defects for the FBP, OSEM-RR, and OSEM-ACSCRR methods were 58.1%, 47.2%, and 54.1% for the conventional method and 60.0%, 47.4%, and 52.5% for the MUS method, respectively. The minimum value of the inferior wall for both FBP was >70% at 15 mm, while OSEM-RR and OSEM-ACSCRR demonstrated distances of 10 mm in the conventional method. In the MUS method, FBP was >70% at 15 mm, OSEM-ACSCRR was >70% at 5 mm, and OSEM-RR did not exceed 70% in any of the images. The maximum values of FBP, OSEM-RR, and OSEM-ACSCRR in the reference images without defects were 88.0%, 85.9%, and 94.6% for the conventional method, and 87.5%, 86.7%, and 94.2% for the MUS method, respectively. The conventional method showed that all the processes were >143% at 5 mm. In the MUS method, none of the processes exceeded 143% for any of the images.
Figure 3 shows the images used for CPC analysis. While the effect on images increased as the distance decreased with the conventional method, the artifacts were less apparent when the MUS method was applied, especially when RR was added to the iterative reconstruction.
Discussion
Regardless of the presence or absence of defects, the MUS method better suppressed the effect of subdiaphragmatic activity compared to the conventional method for all image reconstruction methods. In particular, the use of RR to increase the resolution and improve the separation of myocardial and subdiaphragmatic activities in images without smoothing suggested that the MUS method may be useful for improving accuracy. In the conventional method, even if images with good resolution are produced using RR, they are affected by subdiaphragmatic activity owing to smoothing before the masking process.
The results of this study showed that the effect of the MUS method was reduced for an image with a pixel size of 64 × 64 (6.6 mm). As the data suggested that an effective MUS method requires a distance of approximately twice the pixel size. In general, it is desirable to have at least two pixels per FWHM to avoid possible loss of image detail (8). In a previous report (5), SPECT resolution (FWHM mm) without smoothing under the same acquisition and reconstruction conditions with the present study were 15.13 ± 0.96, 13.25 ± 1.09, 6.16 ± 0.72, and 6.03 ± 0.70 for FBP, OSEM without correction, OSEM-RR, and OSEM-ACSCRR, respectively.
The present results suggest that the MUS method can be expected to suppress the effect of subdiaphragmatic activity at a distance greater than the FWHM if the pixel size meets this condition; if not, as in the case of the 64 × 64 (6.6 mm) image with RR, suppression can be expected at a distance greater than twice the pixel size. Therefore, acquisition with a small pixel size of 128 × 128 (3.3 mm) for RR was robust and recommended. While OSEM without correction was not examined in this study, its characteristics were considered to be similar to FBP with similar resolution.
However, even when RR was used in the MUS method, the reference image showed variations and the effect of subdiaphragmatic activity could not be completely eliminated. This finding may occur due to the effects of subdiaphragmatic activity on myocardial counts, even in images without smoothing, due to the finite resolution of SPECT images and the influence of scattered radiation and other factors. Thus, any possible artifacts due to subdiaphragmatic activity should first be considered to re-acquire cardiac images before trying the MUS method. Methods such as prone imaging (9) may be required to obtain a distance between the myocardium and subdiaphragmatic activity to improve the effectiveness of the MUS method.
Germano et al. suggested that if the counting statistics are good and subdiaphragmatic activity is high, increasing the cutoff frequency of the Butterworth filter before reconstruction may improve the specificity (4). However, changes in filter conditions may affect the image quality and quantitative analysis indices of myocardial perfusion and cardiac function. The effect is expected to be minimal for the application of the MUS method under the same filter conditions as the conventional method.
It is important to note that the masking process may miss non-cardiac information in the clinical application of MUS. Thus, the entire image, including the subdiaphragmatic activity, must be confirmed on SPECT-acquired planar images.
Myocardial perfusion SPECT studies using 99mTc-labeled radiotracers have demonstrated changes in subdiaphragmatic activity time due to the physiological accumulation of radiopharmaceuticals in the liver and their excretion from the gastrointestinal tract (10). The MUS method is expected to suppress the effect of variable subdiaphragmatic activity on myocardial images and provide more stable images. Although this study verified the effectiveness of the MUS method using phantom data, further evaluation of the intraoperative and intraoperative reproducibility is required for the clinical application of MUS.
Conclusion
The MUS method can mitigate the effects of subdiaphragmatic activity on myocardial perfusion SPECT. This method was particularly effective when combined with 128 × 128 (3.3 mm) acquisition and iterative reconstruction with RR.
Acknowledgments
None.
Sources of funding
None.
Conflicts of interest
Satomi Teraoka and Yasushi Ishikawa are employees of PDRadiopharma, Inc. The authors have no conflicts of interest to disclose regarding this study.
References
1. Dvorak RA, Brown RKJ, Corbett JR. Interpretation of SPECT/CT myocardial perfusion images: common artifacts and quality control techniques. Radiographics 2011; 31: 2041–57.
2. Burrell S, MacDonald A. Artifacts and pitfalls in myocardial perfusion imaging. J Nucl Med Technol 2006; 34: 193–211.
3. Germano G. Technical aspects of myocardial SPECT imaging. J Nucl Med 2001; 42: 1499–1507.
4. Germano G, Chua T, Kiat H, Areeda JS, Berman DS. A quantitative phantom analysis of artifacts due to hepatic activity in technetium-99m myocardial perfusion SPECT studies. J Nucl Med 1994; 35: 356–9.
5. Komuro A, Teraoka S, Ishikawa Y, Tsuboko M, Tanno M, Ishimori K, et al. Devising a method to suppress the effect of subdiaphragmatic high activity in 99mTc myocardial perfusion SPECT and examining its usefulness including image reconstruction method. The Japanese Journal of Nuclear Medicine Technology 2021; 41: 431–41. [Article in Japanese]
6. Zeintl J, Vija AH, Yahil A, Hornegger J, Kuwert T. Quantitative accuracy of clinical 99mTc SPECT/CT using ordered-subset expectation maximization with 3-dimensional resolution recovery, attenuation, and scatter correction. J Nucl Med 2010; 51: 921–8.
7. Verberne HJ, Acampa W, Anagnostopoulos C, Ballinger J, Bengel F, De Bondt P, et al. EANM procedural guidelines for radionuclide myocardial perfusion imaging with SPECT and SPECT/CT: 2015 revision. Eur J Nucl Med Mol Imaging 2015; 42: 1929–40. The fully revised version available at the EANM home page: http://eanm.org/publications/guidelines/2015_07_EANM_FINAL_myocardial_perfusion_guideline.pdf.
8. Simon Cherry, James Sorenson, Michael Phelps. Physics in Nuclear Medicine 4th Edition - February 14, 2012: 233.
9. Segall GM, Davis MJ. Prone versus supine thallium myocardial SPECT: a method to decrease artifactual inferior defects. J Nucl Med 1989; 30: 548–55.
10. Wackers FJ, Berman DS, Maddahi J, Watson DD, Beller GA, Strauss HW, et al. Technetium-99m hexakis 2-methoxyisobutyl isonitrile: human biodistribution, dosimetry, safety, and preliminary comparison to thallium-201 for myocardial perfusion imaging. J Nucl Med 1989; 30: 301–11.