Original Article
Recent debrachycephalization in Japan
2018 年 126 巻 1 号 p. 43-63

詳細
2018 年 126 巻 1 号 p. 43-63
This study aimed to show secular changes in the cephalic index (CI) in Japan when brachycephalization was reported to have ceased, and examined possible causes of the observed changes. Head length and breadth data measured on 4034 Japanese adults, born between 1910 and 1996, were used to examine the association between birth year and CI using linear and quadratic regression analyses. Possible causes of secular changes in CI were investigated by examining the secular changes in eight body-size variables and 16 environmental indicators, obtained from the government statistics records. Results showed that a trend reversal from brachycephalization to debrachycephalization occurred among the generation born in 1960–1964, followed by trend reversals in birth length (BL), energy intake, and birth weight (BW) in that order. Previous studies showed that the reverse trend in BW was related to a reduction in fetal growth rate, which resulted from worsening fetal nutritional status, which was also attributable to decreasing maternal energy intake. Since the head measurement at birth is approximately 60% of the adult size, the main cause of debrachycephalization may be worsening fetal nutritional status. From the maternal nutritional perspective, reverse trends in CI and BL began with rapid recovery from the post-war food shortage. However, the body mass index (BMI) of 20-year-old females decreased due to the very small increase in weight despite a rapid increase in height, which was partly achieved by weight loss after the age of 17. As speculated, debrachycephalization began when the negative effects of decreasing BMI among the young adult females outweighed the positive effects of the post-war recovery of the food situation. The results of this study may help to understand the plasticity of the human body.
Japanese people have grown progressively taller and more brachycephalic since the end of the 19th century (Morita and Ohtsuki, 1973; Yanagisawa and Kondo, 1973; Kouchi, 1983, 2000). However, brachycephalization in Japan ceased in the generation born in the 1960s, despite a continued increase in height (Kouchi, 2000). It is unknown if the cephalic index (CI) has been stable or if debrachycephalization started in the generation born after the 1960s.
Secular changes in head shape are observed in many populations, but the causes of these changes are not clear. A study in a population in which secular changes have ceased or reversed, and for whom information on environmental changes exist, thereby allowing for the examination of possible causes of secular changes, may be useful.
Several changes in secular trends, other than the cessation of brachycephalization, have been observed in Japanese individuals born in and after the 1970s. The mean birth weight (BW) increased after 1950, but began to decrease by 1977 (Doi et al., 1993). The mean height of children, aged 6–18 years, reached a plateau in the generation born in the early 1980s (Bassino and Kato, 2010). These changes in body size suggest that some changes occurred in the growth of Japanese born in and after the 1970s. Therefore, it is reasonable to suppose that some changes have also occurred in head growth parameters.
Studies on height strongly suggest that secular changes in adult height are determined by the rapid growth that occurs during the first several years of life (Bock and Sykes, 1989; Satyanarayana et al., 1989; Schmidt et al., 1995; Cole, 2003) or even during gestation (Steegman, 1985; Alberman et al., 1991). Secular changes in head measurements in adults may also be determined by the rapid and decelerating growth in early childhood (Jantz and Meadows Jantz, 2000).
Improved living conditions, especially nutritional and health status, are considered the primary reasons for the positive secular changes in height observed in many developed countries in the 20th century (Wieringen, 1986; Bogin, 1999; Roche and Sun, 2003). Variables such as energy intake (Padez, 2002), animal protein intake (Faccini and Gualdi-Russo, 1982; Würum, 1984), postneonatal mortality (Schmidt et al., 1995; Padez, 2002), and infant mortality (Pak, 2004; Little et al., 2006; Malina et al., 2010) have been identified as indicators of nutritional or health status, and are associated with fluctuations in height.
Interestingly, many reports state that head dimensions and CI also change when secular changes in height occur (Shapiro, 1939; Susanne et al., 1988; Facchini and Gualdi-Russo, 1982; Kouchi, 2000; Buretić-Tomljanović et al., 2004). Growth of the neural skull is dependent on brain growth (Moss and Young, 1960; Cameron et al., 1990). Therefore, these findings suggest that changes in living conditions have an impact on brain growth as well as growth of the long bones, although the rapid growing period of the brain tissue differs from that of the long bones. Head circumference at birth is approximately 60% of the adult size, while the recumbent length at birth is approximately 30% of the adult height (Bogin, 1999). This emphasizes the need to examine the environmental factors that affect prenatal growth in order to understand secular changes in head measurements.
The first aim of this study was to show the secular changes in head measurements and CI of Japanese adults born after the 1960s, using data measured between 1977 and 2015. In order to examine if similar changes were also observed in younger subjects, data from children aged 3–5 years were obtained from the literature. The second aim of this study was to examine trends in environmental factors, which were based on data obtained from government statistics, and to investigate possible reasons for the observed secular changes in head measurements and CI.
Head length (HL) and head breadth (HB) were measured using a spreading caliper according to Martin and Saller (1957). HL was the maximum glabello-occipital diameter and HB was the maximum lateral diameter. The CI was calculated using the formula, HB/HL × 100. To examine secular changes, the measurements of people born across a wide range of time, measured by different observers, were compared. This has been widely accepted because measurement errors in HL and HB are considered small. It is appropriate to confirm this presumption.
Studies on measurement errors in somatometric data show that the intra-observer error in HL and HB is small (Jamison and Ward, 1993; Kouchi et al., 1996). Conversely, inter-observer error is small in HB, but larger in HL (Bennett and Osborne, 1986; Gordon and Bradtmiller, 1992). In our study, in which six observers measured the HL of 27 participants (Kouchi et al., 1999), analysis of variance (ANOVA) revealed significant results; however, post hoc analysis showed that one observer who received training from a different institute reported significantly smaller values, and that the mean measurements of other observers were not significantly different.
Adult data examining geographic differences were measured by the present author from 1979 to 1983. Therefore, the estimated range of geographic differences using the data is not overestimated because of inter-observer errors. Adult data examining secular changes were measured by seven experienced anthropometrists including the present author. Other anthropometrists were either trained by the present author, or received training from the same institute as the author. Therefore, data presented in this study are expected to be less affected by inter-observer errors compared with previous studies.
Adult dataSubjects included Japanese males and females, aged 18 years and older, measured between 1977 and 2015. Subjects measured in the 1970s and 1980s were volunteers recruited at universities and colleges through a network of personal contacts. Measurements were obtained from a study on geographic differences and secular changes in Japan (Kouchi, 1986), or from collecting anthropometric data on Japanese adults to be used as reference data (Hoshi and Kouchi, 1978; Hoshi et al., 1980). Verbal informed consent was obtained from each subject prior to participation in this study.
Measurements taken after 1990 were obtained for various projects. Subjects were recruited through a network of personal contacts, through advertisements in local newspapers, and through temporary staffing agencies, including Silver Human Resources Centers (a national government program to provide job opportunities for retired citizens). Written informed consent was obtained from each subject prior to participation in this study. The experimental protocol of each project has been reviewed and approved by an institutional ethics committee since 1998, when a reviewing system was established.
Adult data for examining secular changesAnalyses of geographic variations within Japan showed significant differences in head measurements based on the geographical location (Kouchi, 1983, 1986); thus, data measured in the Kanto region (Figure 1) were used to minimize the effects of geographic differences. Birth year (BY) of male subjects ranged from 1910 to 1995, and that of female subjects ranged from 1911 to 1996. Subjects were divided into groups according to BY and sex. The BY ranges were 5 or 10 years, such that at least 30 subjects were included in each group. Table 1 shows the number of subjects by BY and sex. Data from the female BY group 1910–19 with 17 subjects were not used for statistical analyses, but are shown in Table 1B and Figure 3, Figure 4, Figure 5, Figure 6.
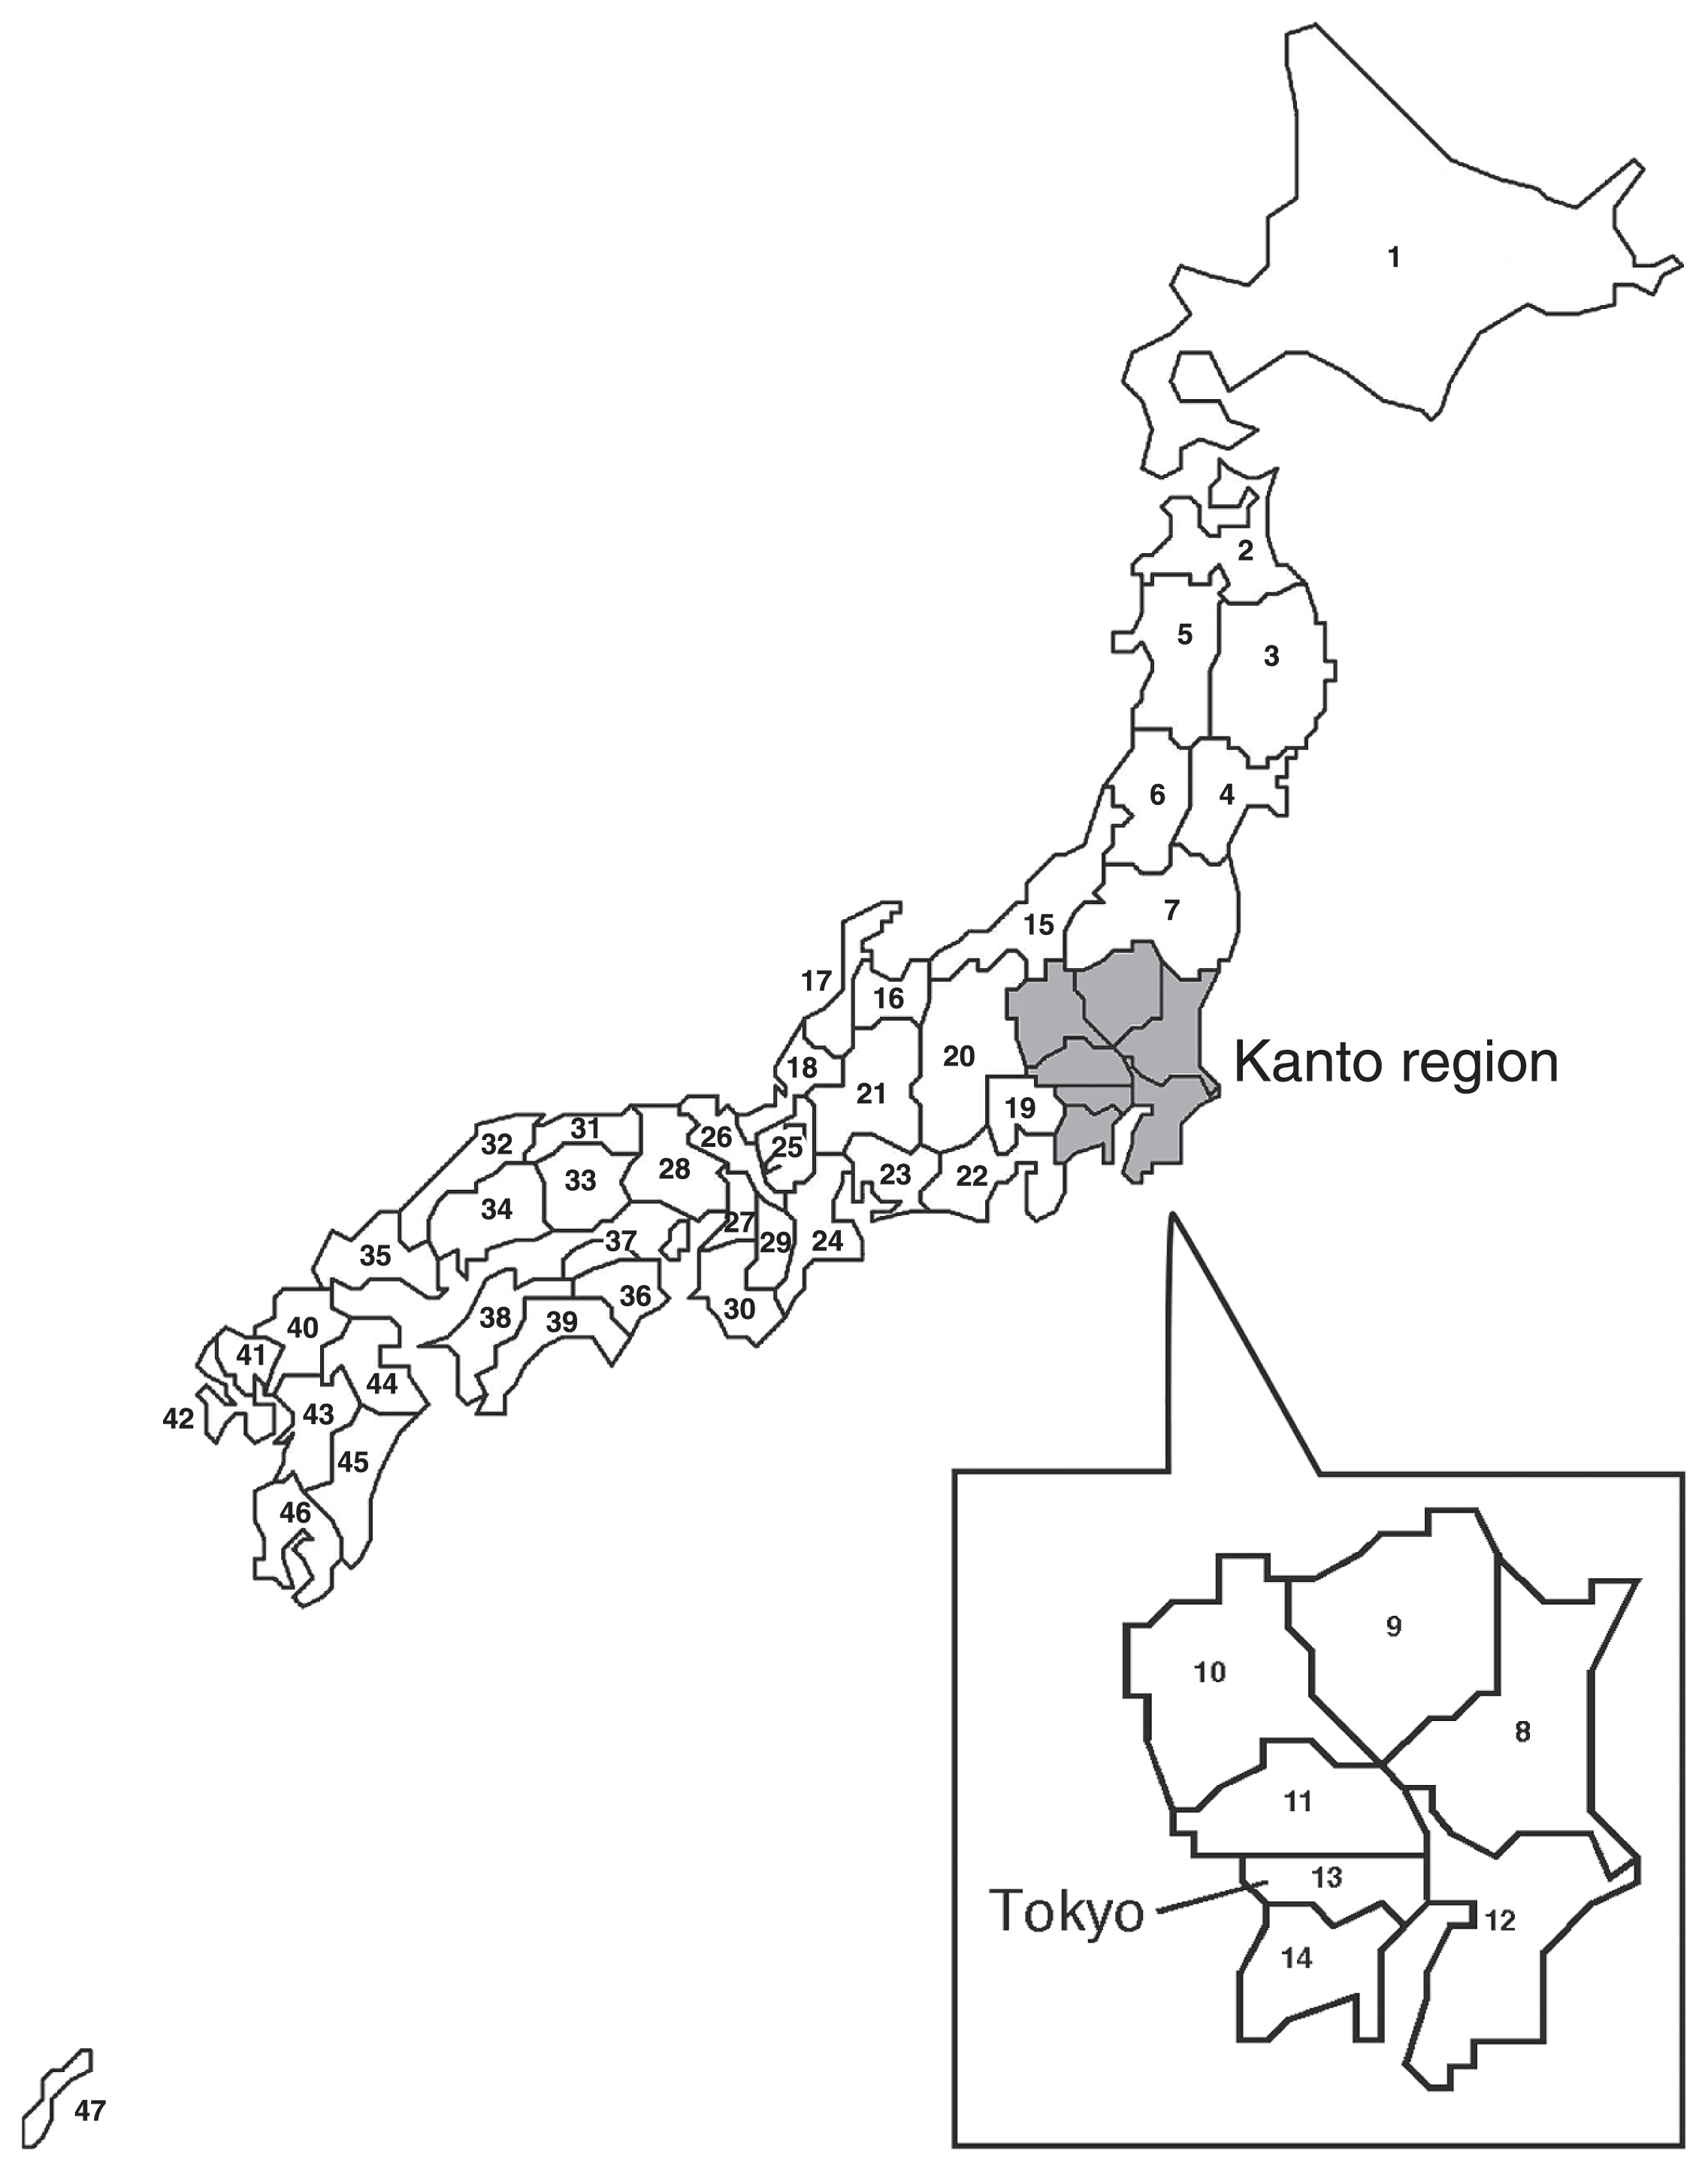
Map of Japan. Numbers for prefectures are the same as those in the appendix.
| A. Male | ||||||||||
|---|---|---|---|---|---|---|---|---|---|---|
| Birth year | N | Birth year | Age (years) | Head length (mm) | Head breadth (mm) | Cephalic index | ||||
| Mean | Mean | SD | Mean | SD | Mean | SD | Mean | SD | ||
| 1910–19 | 35 | 1915.5 | 74.6 | 6.6 | 189.7 | 8.0 | 154.8 | 5.3 | 81.8 | 4.9 |
| 1920–29 | 120 | 1925.9 | 68.2 | 10.0 | 189.0 | 6.8 | 156.0 | 5.3 | 82.6 | 4.0 |
| 1930–39 | 142 | 1933.7 | 63.7 | 10.4 | 188.8 | 6.8 | 159.1 | 6.3 | 84.4 | 4.3 |
| 1940–49 | 53 | 1944.4 | 40.3 | 14.0 | 187.9 | 5.6 | 157.7 | 6.2 | 84.0 | 3.9 |
| 1950–54 | 88 | 1952.4 | 25.4 | 2.4 | 187.6 | 6.9 | 158.9 | 6.1 | 84.8 | 4.8 |
| 1955–59 | 97 | 1957.5 | 20.8 | 4.8 | 185.9 | 6.4 | 156.8 | 6.4 | 84.4 | 4.7 |
| 1960–64 | 196 | 1962.5 | 22.0 | 3.8 | 187.4 | 6.7 | 161.0 | 5.5 | 86.0 | 4.2 |
| 1965–69 | 534 | 1966.3 | 20.7 | 3.1 | 188.4 | 7.1 | 162.2 | 5.9 | 86.2 | 4.6 |
| 1970–74 | 153 | 1971.5 | 22.6 | 4.7 | 190.4 | 6.4 | 162.0 | 5.8 | 85.2 | 4.1 |
| 1975–79 | 160 | 1977.1 | 21.9 | 3.7 | 189.8 | 5.9 | 161.6 | 5.4 | 85.2 | 3.8 |
| 1980–89 | 63 | 1982.6 | 23.7 | 5.0 | 190.1 | 5.9 | 161.3 | 4.8 | 84.9 | 3.7 |
| 1990–95 | 87 | 1991.3 | 22.8 | 1.0 | 191.5 | 6.3 | 158.8 | 6.7 | 83.0 | 4.6 |
| B. Female | ||||||||||
| Birth year | N | Birth year | Age (years) | Head length (mm) | Head breadth (mm) | Cephalic index | ||||
| Mean | Mean | SD | Mean | SD | Mean | SD | Mean | SD | ||
| 1910–19 | 17 | 1916.4 | 76.7 | 3.5 | 181.6 | 5.7 | 148.4 | 4.2 | 81.8 | 3.2 |
| 1920–29 | 67 | 1925.1 | 71.8 | 4.5 | 181.3 | 6.2 | 150.1 | 5.2 | 82.9 | 3.9 |
| 1930–39 | 147 | 1934.4 | 66.9 | 3.9 | 179.7 | 6.1 | 151.9 | 5.0 | 84.6 | 3.8 |
| 1940–49 | 50 | 1944.8 | 51.8 | 13.7 | 178.6 | 7.0 | 151.0 | 5.3 | 84.7 | 4.3 |
| 1950–54 | 65 | 1952.1 | 38.3 | 15.2 | 177.4 | 6.3 | 151.9 | 5.5 | 85.7 | 4.7 |
| 1955–59 | 113 | 1957.8 | 25.2 | 8.6 | 178.4 | 6.6 | 153.7 | 5.6 | 86.3 | 5.0 |
| 1960–64 | 765 | 1962.2 | 20.6 | 2.2 | 177.8 | 6.1 | 154.3 | 5.3 | 86.9 | 4.4 |
| 1965–69 | 550 | 1966.0 | 20.4 | 3.8 | 178.4 | 6.1 | 154.4 | 5.4 | 86.6 | 4.3 |
| 1970–74 | 181 | 1972.2 | 21.9 | 5.3 | 180.2 | 6.0 | 153.9 | 5.2 | 85.5 | 4.2 |
| 1975–79 | 132 | 1977.1 | 21.4 | 3.7 | 180.6 | 6.4 | 155.3 | 5.5 | 86.1 | 4.4 |
| 1980–89 | 66 | 1984.0 | 23.4 | 4.1 | 181.4 | 5.3 | 153.0 | 4.9 | 84.4 | 4.0 |
| 1990–96 | 153 | 1993.6 | 20.6 | 1.2 | 180.1 | 6.6 | 151.9 | 5.4 | 84.5 | 4.3 |
In the event that our study finds a reverse trend in CI, this could be a spurious result if the magnitude of change after the trend reversal was smaller than that due to geographic differences. To evaluate the range of geographic differences, measurements from 2821 male university students measured from 1979 to 1983 by the present author were used (Kouchi, 1986). Subjects used to examine secular changes were not included. BY of subjects ranged from 1955 to 1964, and the mean BY was 1961.4.
Subjects were divided into 47 prefectural groups (Figure 1). When three or more grandparents of a subject were born in the same prefecture, the subject was assigned to that prefecture. The mean value of a measurement was calculated for each prefecture, and the standard deviation of mean values by prefecture was used as the indicator for the range of geographic differences. Basic statistics of HL, HB, CI, and height, measured using an anthropometer, in each prefecture, are shown in the appendix.
Child dataSince changes in growth during a period of rapid growth are responsible for secular changes in adult head measurements, similar secular changes should be observed in children. According to Bayley (1936), who studied growth changes in CI from 1 month to 60 months of age, CI values are consistent after 36 months of age. This suggests that slight age differences between groups obtained from the different studies may not affect the comparisons of head measurements at 3 years of age and older. Therefore, measurements at 3, 4, and 5 years of age were obtained from the literature. The mean ages at the measurement of these age groups were approximately 3.5, 4.5, and 5.5 years, respectively.
Data from the Consumer Product Safety Association (CPSA) were measured in 1973 and in 1979 in Tokyo and its surrounding areas (Consumer Product Safety Association, 1973, 1979). Data measured in 1973 and in 1979 were pooled. Estimated BY from the year of measurement and age at measurement ranged from 1968 to 1976. Since CI values were not reported, CI was calculated from the mean HL and the mean HB.
Data from the Research Institute of Human Engineering for Quality Life (HQL) were measured between 2005 and 2008. Original data of HL and HB, as well as background information, such as the year and place of measurement, are available on a website (Research Institute of Human Engineering for Quality Life, 2008). Although data from HQL included data measured in Tokyo, Osaka, and other areas, only data measured in Tokyo and its surrounding areas were used. CI was calculated for each individual, and the estimated BY ranged from 2000 to 2005. Table 2 shows the number of subjects categorized according to age, sex, and data source.
| A. Boys | |||||||||
|---|---|---|---|---|---|---|---|---|---|
| Reference | Age group | N | Estimated birth year | Head length (mm) | Head breadth (mm) | Cephalic index | |||
| Mean | SD | Mean | SD | Mean | SD | ||||
| CPSA* | 3 | 64 | 1973 | 165.9 | 6.7 | 147.9 | 6.1 | 89.2 | — |
| 4 | 153 | 1972 | 166.5 | 6.6 | 148.6 | 5.9 | 89.2 | — | |
| 5 | 214 | 1971 | 167.4 | 7.2 | 149.9 | 6.5 | 89.5 | — | |
| HQL | 3 | 21 | 2003.5 | 167.6 | 6.1 | 143.4 | 7.2 | 85.7 | 5.5 |
| 4 | 28 | 2002.5 | 169.9 | 4.9 | 144.4 | 5.1 | 85.1 | 3.6 | |
| 5 | 31 | 2001.5 | 171.1 | 6.5 | 147.1 | 7.5 | 86.1 | 5.1 | |
| B. Girls | |||||||||
| Reference | Age group | N | Estimated birth year | Head length (mm) | Head breadth (mm) | Cephalic index | |||
| Mean | SD | Mean | SD | Mean | SD | ||||
| CPSA* | 3 | 58 | 1973 | 161.7 | 5.5 | 141.8 | 5.0 | 87.7 | — |
| 4 | 141 | 1972 | 164.0 | 7.4 | 143.3 | 5.4 | 87.3 | — | |
| 5 | 172 | 1971 | 164.3 | 6.5 | 143.8 | 7.2 | 87.5 | — | |
| HQL | 3 | 27 | 2003.5 | 163.5 | 6.9 | 139.7 | 5.6 | 85.6 | 4.7 |
| 4 | 40 | 2002.5 | 165.3 | 6.4 | 141.7 | 6.9 | 85.8 | 4.8 | |
| 5 | 32 | 2001.5 | 167.1 | 5.9 | 142.0 | 5.8 | 85.1 | 5.0 | |
CPSA, Consumer Products Safety Association, pooled data of measurements in 1973 and in 1979; HQL, Research Institute of Human Engineering for Quality Life.
Figure 2 shows the growth curves of HL and HB based on fetal data from Kimura (1979) and postnatal data from Terada and Hoshi (1965). The HL and HB fetal growth rates are higher than the postnatal growth rates, and both the rapid and the decelerating growth continue until 8–12 months of age. If the primary reasons for secular changes in CI are environmental, then environmental factors that affect fetal growth and growth within the first year of life are considered most important. When the HL and HB values at birth and 1 year of age (Terada and Hoshi, 1965) are compared with values at 30–39 years measured in 1992–1994 (Research Institute of Human Engineering for Quality Life, 1997), HL and HB are approximately 60% of adult values at birth, HL is approximately 80%, and HB is approximately 90% of adult value at 1 year of age. Therefore, we focused on environmental factors that may affect growth in childhood, especially by 1 year of age.

Growth curves of head length and head breadth. Data for fetuses are from Kimura (1979); data for infants are from Terada and Hoshi (1965).
Body size during childhood is related to multiple factors, including nutritional status and overall health (Bielicki, 1986; Komlos and Lauderdale, 2007). Since different environmental factors may affect growth during different periods, we examined secular changes in body size at birth, 1, 3, and 7 years of age.
Body size variables obtained from government statistics include weight and height (recumbent length at <2 years of age). Weight is measured to the nearest 10 g using a baby weighing scale (age <2 years) or an ordinary weighing scale (age ≥2 years) (Ministry of Health, Labour and Welfare, 2011a) or to the nearest 100 g using an ordinary weighing scale (age ≥6 years) (Japanese Society of School Health, 2016). Recumbent length is measured using a body length measuring board to the nearest 1 mm (Ministry of Health, Labour, and Welfare, 2011a). Height is measured to the nearest 1 mm using a stadiometer (Japanese Society of School Health, 2016).
BW and birth length (BL) are indicative of prenatal growth. Data on BW and BL were obtained from the annual reports of Vital Statistics by the Ministry of Health, Labour and Welfare (MHLW) and the reports of the National Growth Survey on Preschool Children, which is conducted every 10 years by MHLW.
The National Growth Survey on Preschool Children started in 1950. BW data before 1950 were obtained from Kamioka (1977), who compiled BW data measured in hospitals during the period between 1898 and 1968. BW measured for >30 infants in hospitals located in present-day Japan were used to calculate mean BW in 1900–1909 (three hospitals), 1910–1919 (three hospitals), 1920–1929 (three hospitals), 1930–39 (12 hospitals), and 1940–1949 (five hospitals).
Data on weight at 1 year (WT-1), recumbent length at 1 year (RL-1) (>1 year and <1 year, 1 month), weight at 3 years (WT-3), and height at 3 years (HT-3) (>3 years and <3 years, 6 months) were obtained from the reports of the National Growth Survey on Preschool Children. Weight and height at 7 years (WT-7 and HT-7, respectively) represent the growth achieved by school age. These data were obtained from the annual reports of School Health Survey by the Ministry of Education, Culture, Sports, Science and Technology (MEXT).
Data on environmental factorsEnvironmental factors that may affect growth during the prenatal and preschool periods include, but are not limited to, maternal nutritional status during pregnancy, maternal body size, maternal weight gain during pregnancy, maternal lifestyle choices during pregnancy, nutritional and overall health status in the first year of life, and nutritional and health status during childhood. We also considered head deformation during childbirth, as well as the economic situation. Economic situation was included because living condition indicators (such as income) are related to economic situation indicators (such as the gross domestic product (GDP)).
Table 3 lists 16 variables used as indicators of environmental factors, which may influence pre- and postnatal growth. Information on the trends of these variables was obtained from published reports or related survey websites.
| Environmental factor | Indicator | Year of observation | Data source (statistical survey) | |
|---|---|---|---|---|
| Nutritional status of Japanese including pregnant women | 1 | Energy intake* | 1930–2015 | Yamazaki, 1973 (1930–1940) National Health and Nutrition Survey, MHLW (1946–2015) |
| 2 | Intake of carbohydrate* | |||
| 3 | Intake of fat* | |||
| 4 | Intake of animal protein* | |||
| 5 | Proportion of energy intake from grains | 1930–2015 | ||
| 6 | Proportion of protein intake from animal food | |||
| Body size and body build of pregnant women | 7 | Maternal height at 20 years** | 1947–2015 | Vital Statistics, MHLW; National Health and Nutrition Survey, MHLW (1947–1963); Physical Fitness Survey, MEXT (1964–2015) |
| 8 | Maternal weight at 20 years** | |||
| 9 | Maternal BMI at 20 years** | |||
| Lifestyle of pregnant women | 10 | Smoking during pregnancy | 1990–2010 | National Growth Survey on Preschool Children, MHLW |
| Head shape modification during childbirth | 11 | Percentage of infants by Caesarean section | 1984–2014 | Survey of Medical Institutions, MHLW |
| Nutritional and health status in the first year after birth | 12 | Bottle feeding | 1960–2010 | National Growth Survey on Preschool |
| 13 | Age at weaning | 1974–2014 | Children, MHLW | |
| 14 | Postneonatal mortality | 1899–2014 | Vital Statistics, MHLW | |
| Hygiene conditions of children | 15 | Prevalence of parasite eggs in elementary school students | 1949–1965, 1974–2015 | School Health Survey, MEXT |
| Economic situations | 16 | Growth rate of real GDP | 1886–2013 | Cabinet Office |
Abbreviations: GDP, gross domestic product; MEXT, Ministry of Education, Culture, Sports, Science and Technology; MHLW, Ministry of Health, Labour and Welfare.
The per capita, per day energy, and nutrient intakes represent the general nutritional status of Japanese individuals, including pregnant women, which affects fetal nutritional status. The proportion of energy intake from grains and protein from animal sources is related to the degree of Westernization of dietary patterns. Nutrition data were obtained from the annual reports from the National Health and Nutrition Survey by MHLW, which started in 1946. The data before 1940 were obtained from Yamazaki (1973).
Maternal height, maternal weight, and maternal body mass index (BMI) are related to fetal body size at birth (Roche and Sun, 2003). Maternal height and weight at 20 years of age (MH-20 and MW-20, respectively) were calculated as follows: mean age of women who had a child in one year was obtained from the Vital Statistics report of 2015 for 1950–2015, and the mean BY of these women was calculated as the year of examination minus the mean age. Data on the mean height and mean weight of 20-year-old women born in that year were obtained from the annual reports of the National Health and Nutrition Survey (BY <1944) or the Physical Fitness Survey by MEXT (BY ≥1944). Data from the general population rather than data from students were used. Maternal BMI at 20 years of age (MBMI-20) was calculated from MH-20 and MW-20. The mean maternal BY (MBY) in 1950 was 1921 and that in 1955 was 1926. Mean height and mean weight at 20 years of age are not available for these years. Therefore, data at age 25 years in 1947 and data at age 21 years in 1947 were used for these years, respectively. Data on mean maternal age before 1950 were obtained from the report of 1943 Vital Statistics (Institute of the Ministry of Health and Welfare, 1943).
The lifestyle of Japanese women drastically changed after World War II (Ministry of Health, Labour and Welfare, 2011b). No data are available for trends in household workload that may affect fetal nutritional status. It is well known that smoking during pregnancy adversely affects fetal growth (Gould, 1986; Nakamura and Nagasaka, 2004). It is a risk factor for low birth weight (LBW) infants (Babazono, 1990; Nakamura, 2002; Nakamura and Nagasaka, 2004; Yoshida et al., 2014). Association between smoking during pregnancy and the height of children at 7 years is reported (Goldstein, 1971). Information on smoking rates of pregnant women has only been available since 1990 via the reports of the National Growth Survey on Preschool Children. We assumed that the trends in smoking rates among pregnant women reflect that of the young adult Japanese females in general, and, therefore, we obtained smoking rates of Japanese females aged 20–29 years via the reports of the National Health and Nutrition Survey (1989–2013) and Japan Tobacco Inc. (1965–2001) (Japan Health Promotion and Fitness Foundation, 2008). The smoking rates of Japanese males aged 20–29 years were also examined because this could be an indicator of passive smoking.
Head deformation during childbirth is less common during Caesarian section (C-section). If an increase in C-section rates and changes in head shape occur simultaneously, increases in C-section rates could be a cause of secular changes in head shape, despite Bayley’s findings (Bayley, 1936) that an infant delivered via C-section showed a similar growth pattern as infants delivered vaginally, and pressure on the head during childbirth did not affect the postnatal growth pattern of HL or HB. Information on trends in C-section rates between 1984 and 2014 was available every third year and was used in our analysis. Data were obtained from the reports of the Survey of Medical Institutions by MHLW.
Bottle-feeding and age at weaning are related to infant nutritional status during the first year of life. Shimada (1974) compared head measurements of bottle-fed and breast-fed groups of children aged 4 months–10 years, and reported that bottle-fed groups were often more brachycephalic than breast-fed groups. Data on bottle-feeding and age at weaning were obtained from reports of the National Growth Survey on Preschool Children.
Postneonatal mortality is a sensitive indicator of infant health, and is associated with infant nutritional status and prevalence of infections (Schmidt et al., 1995). Data on postneonatal mortality were obtained from reports of Vital Statistics.
The prevalence of parasite eggs among elementary school students is related to hygienic conditions of children. Data were obtained from reports of the School Health Survey.
The growth rate of real GDP is an indicator of the economic situation, which may reflect the nutritional status of a population. Data were obtained from websites of the Cabinet Office.
Statistical methodsIn order to examine the secular changes in HL, HB, and CI of adult data, linear and quadratic regression analyses were conducted using mean BY as the independent variable and a mean head variable as the dependent variable (Statview version 5 for Power PC, SAS Institute, Cary, NC). For the regression analysis using the data categorized according to BY groups, only data from BY groups with 30 or more subjects were used.
In order to examine if the results obtained from analyses, using data categorized according to BY group, oversimplify the trend, regression analyses were also conducted using the original data.
Secular change during a period was considered significant if the following two conditions were met: (1) the regression coefficient was significant; and (2) the difference in means between BY groups at the beginning and at the end of the period was significant and larger than the geographic difference. Significance of differences between the means of two groups was assessed using the t-test.
To visualize a trend in a body size variable or an environmental variable, a plot of the variable against BY or the year of survey was conducted, and the similarity of the variable trend and trend in CI was subsequently examined. When a trend reversal was observed in a variable, the BY at the peak (or bottom) was estimated as the BY at the maximum or minimum of the fitted quadratic function (Statview version 5)
A significance level of 0.05 was used for all statistical tests.
The basic statistics of HL, HB, and CI, categorized according to BY group, are shown in Table 1. Figure 3, Figure 4, and Figure 5 show the relationships between BY and HL, BY and HB, and BY and CI, respectively. Quadratic regression lines and the ranges of geographic differences are also shown. The mean values of BY group 1960–64 were very close to those of geographic differences data.

Relationship between birth year and head length of Japanese adults. Black lines indicate quadratic regression lines, and the gray line indicates the range of geographical differences.
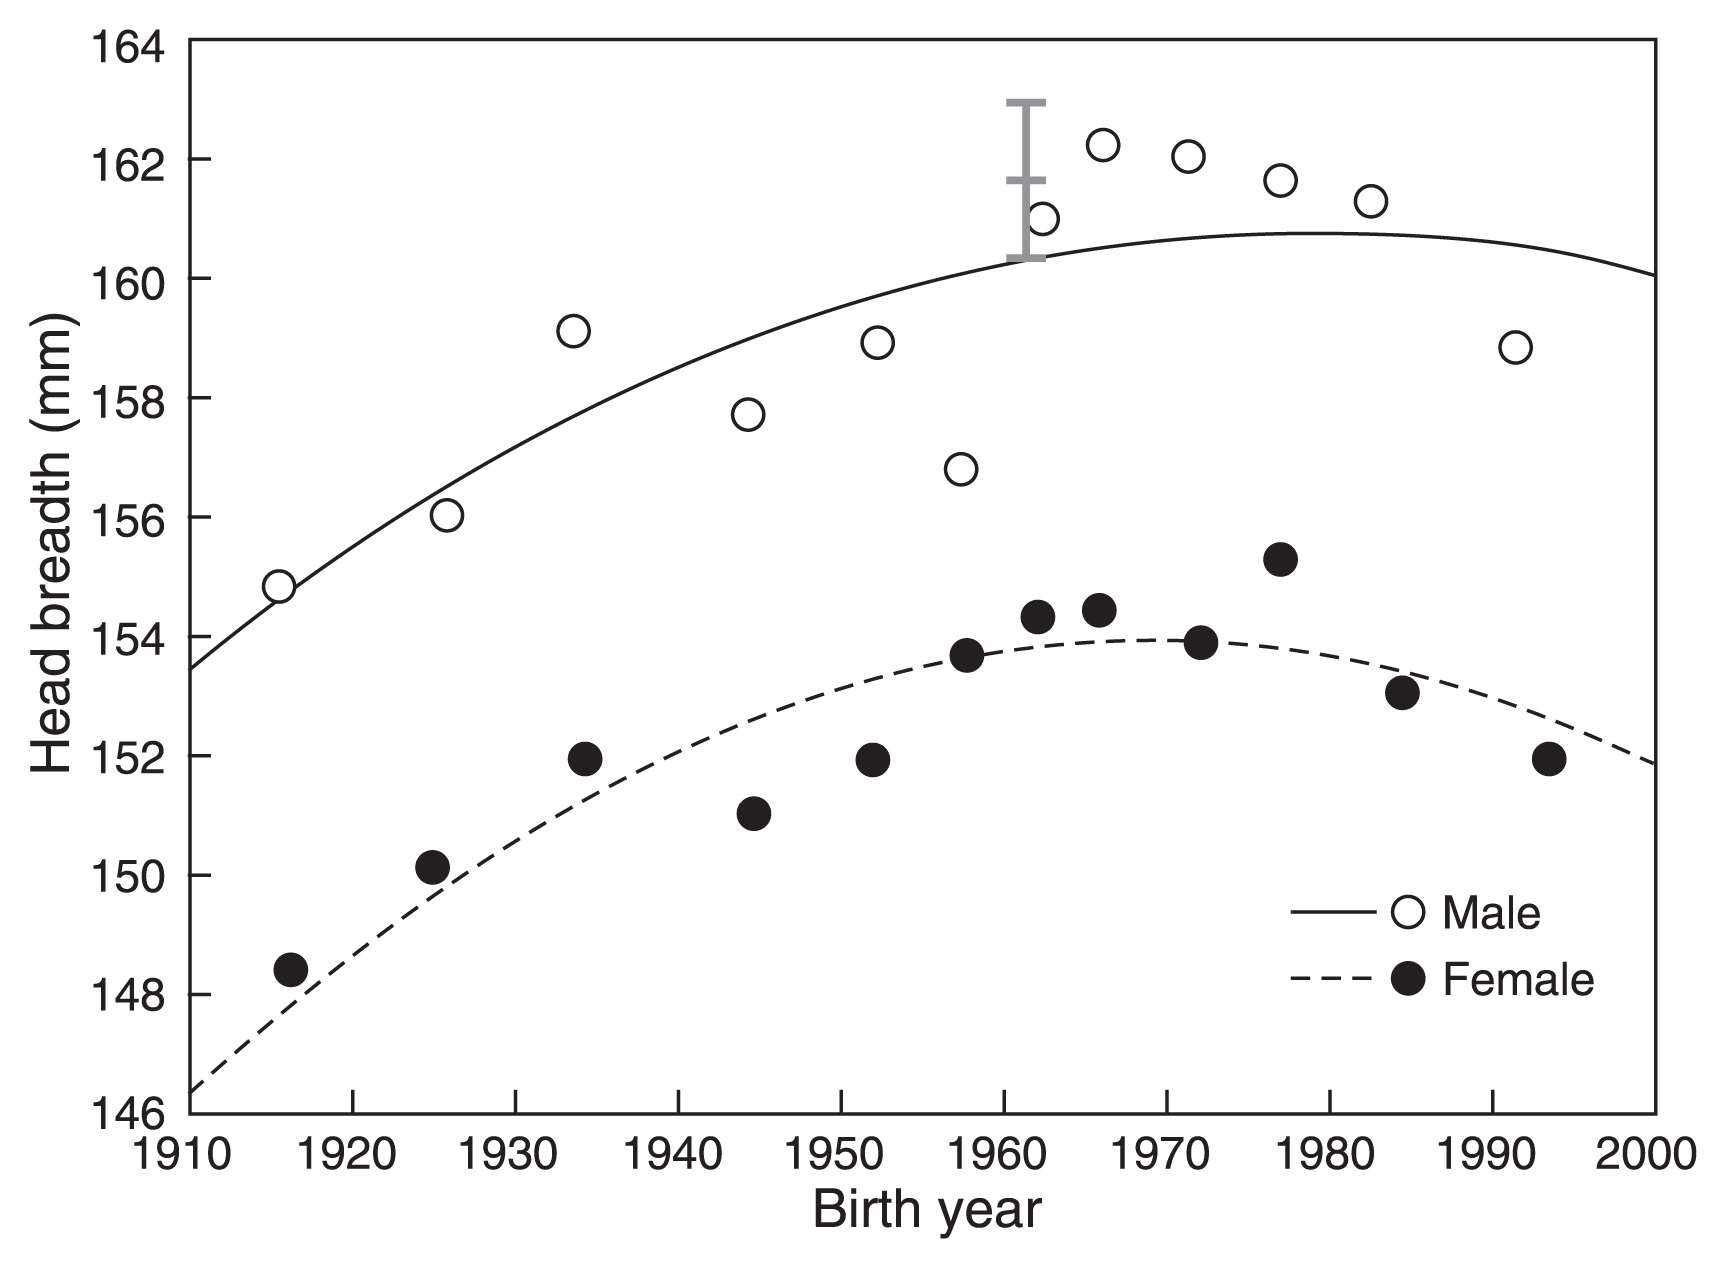
Relationship between birth year and the head breadth of Japanese adults. Black lines indicate quadratic regression lines, and the gray line indicates the range of geographical differences.
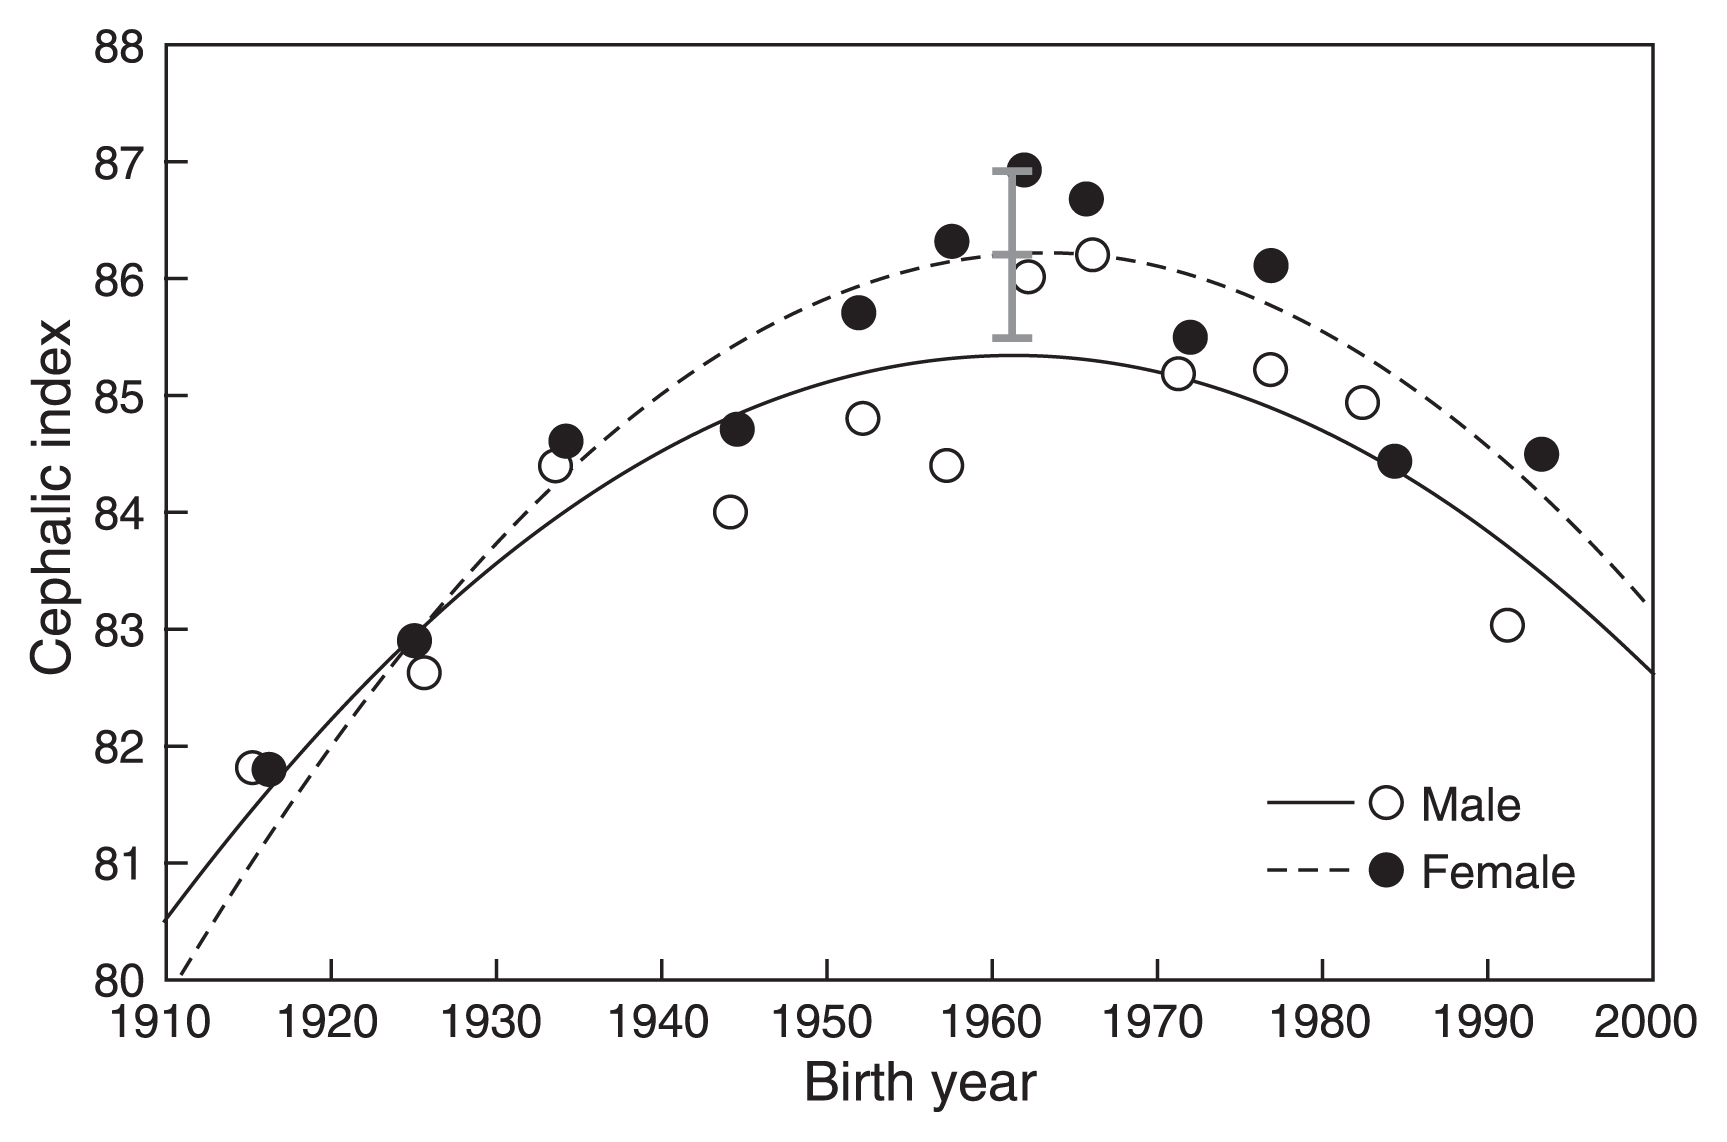
Relationship between birth year and the cephalic index of Japanese adults. Black lines indicate quadratic regression lines, and the gray line indicates the range of geographical differences.
Trends were similar in males and females for all variables. HL decreased until BY 1950–1960, and subsequently increased (Figure 3). HB increased until BY 1960–1970 and then decreased (Figure 4). A similar trend was seen in CI, which increased until BY 1960–1965 and then decreased (Figure 5).
Table 4A shows the results of regression analysis based on the original data. Aside from linear regression of female HL, linear and quadratic regressions were significant according to ANOVA. R2 values were higher in quadratic than in linear regressions.
| A. Based on all data | |||||||
|---|---|---|---|---|---|---|---|
| Males (N = 1943) | |||||||
| R2 | ANOVA | Y-intercept | BY | BY2 | BY at the vertex | ||
| Linear | Head length | 0.004 | ** | ** | ** | — | |
| Head breadth | 0.046 | ** | NS | ** | — | ||
| Cephalic index | 0.013 | ** | * | ** | — | ||
| Quadratic | Head length | 0.025 | ** | ** | ** | ** | 1949.6 |
| Head breadth | 0.072 | ** | ** | ** | ** | 1969.4 | |
| Cephalic index | 0.060 | ** | ** | ** | ** | 1960.4 | |
| Females (N = 2371) | |||||||
| R2 | ANOVA | Y-intercept | BY | BY2 | BY at the vertex | ||
| Linear | Head length | 0.001 | NS | ** | NS | — | |
| Head breadth | 0.007 | ** | ** | ** | — | ||
| Cephalic index | 0.001 | * | ** | * | — | ||
| Quadratic | Head length | 0.019 | ** | ** | ** | ** | 1957.4 |
| Head breadth | 0.037 | ** | ** | ** | ** | 1967.1 | |
| Cephalic index | 0.044 | ** | ** | ** | ** | 1963.1 | |
| B. Based on BY groups | |||||||
| Males (N = 12) | |||||||
| R2 | ANOVA | Y-intercept | BY | BY2 | BY at the vertex | ||
| Linear | Head length | 0.102 | NS | ** | NS | — | |
| Head breadth | 0.510 | ** | NS | ** | — | ||
| Cephalic index | 0.273 | NS | NS | NS | — | ||
| Quadratic | Head length | 0.708 | ** | ** | ** | ** | 1948.7 |
| Head breadth | 0.632 | * | NS | NS | NS | ||
| Cephalic index | 0.724 | ** | ** | ** | ** | 1961.5 | |
| Females (N = 11) | |||||||
| R2 | ANOVA | Y-intercept | BY | BY2 | BY at the vertex | ||
| Linear | Head length | 0.026 | NS | ** | NS | — | |
| Head breadth | 0.338 | NS | NS | NS | — | ||
| Cephalic index | 0.124 | NS | NS | NS | — | ||
| Quadratic | Head length | 0.567 | * | * | * | * | 1956.8 |
| Head breadth | 0.669 | * | * | * | * | 1969.8 | |
| Cephalic index | 0.816 | ** | ** | ** | ** | 1963.6 | |
NS, not significant; ANOVA, analysis of variance; BY, birth year; R2, coefficient of determination
Table 4B shows the results of regression analysis based on the data from BY groups. Quadratic regression was significant for all variables except male HB, whereas linear regression was significant only for male HB.
Overall, quadratic regression exhibited a better fit than linear regression. The regression analyses results showed that the trend reversal observed in Figures 3, Figure 4, and Figure 5 is statistically significant. The timing at which a trend reversal was observed in analyses using both types of data was similar, as indicated by the peak of quadratic regression functions. The trend reversal occurred first in HL (bottom year: 1948–49 in males, 1956–57 in females), followed by CI (peak year: 1960–61 in males, 1963 in females), and lastly in HB (peak year: 1969 in males, 1967–69 in females)
Differences between the means of BY group 1920–29 and BY group 1960–64, as well as differences between the means of BY group 1960–64 and BY group 1990–96, were significant for all variables in both males and females. Figures 3, Figure 4, and Figure 5 show that these differences were larger than the geographic differences.
Child dataTable 2 shows basic statistics of HL, HB, and CI of children by age and data series. Subjects of the CPSA series born in 1968–76 generally had smaller HL, larger HB, and larger CI compared with subjects of the HQL series born in 2000–05. The between-series difference in HL or HB was significant in males, with the exception of HL of males aged 3 years. However, the difference was significant only in HL of females aged 5 years. Since statistics on CI were not available for the CPSA series, statistical analyses were not conducted for CI.
Figure 6 shows the relationship between BY and CI of children (Table 2), as well as that of adults (Table 1). Data for male and female children of all age groups showed a similar trend of debrachycephalization as observed in adults.
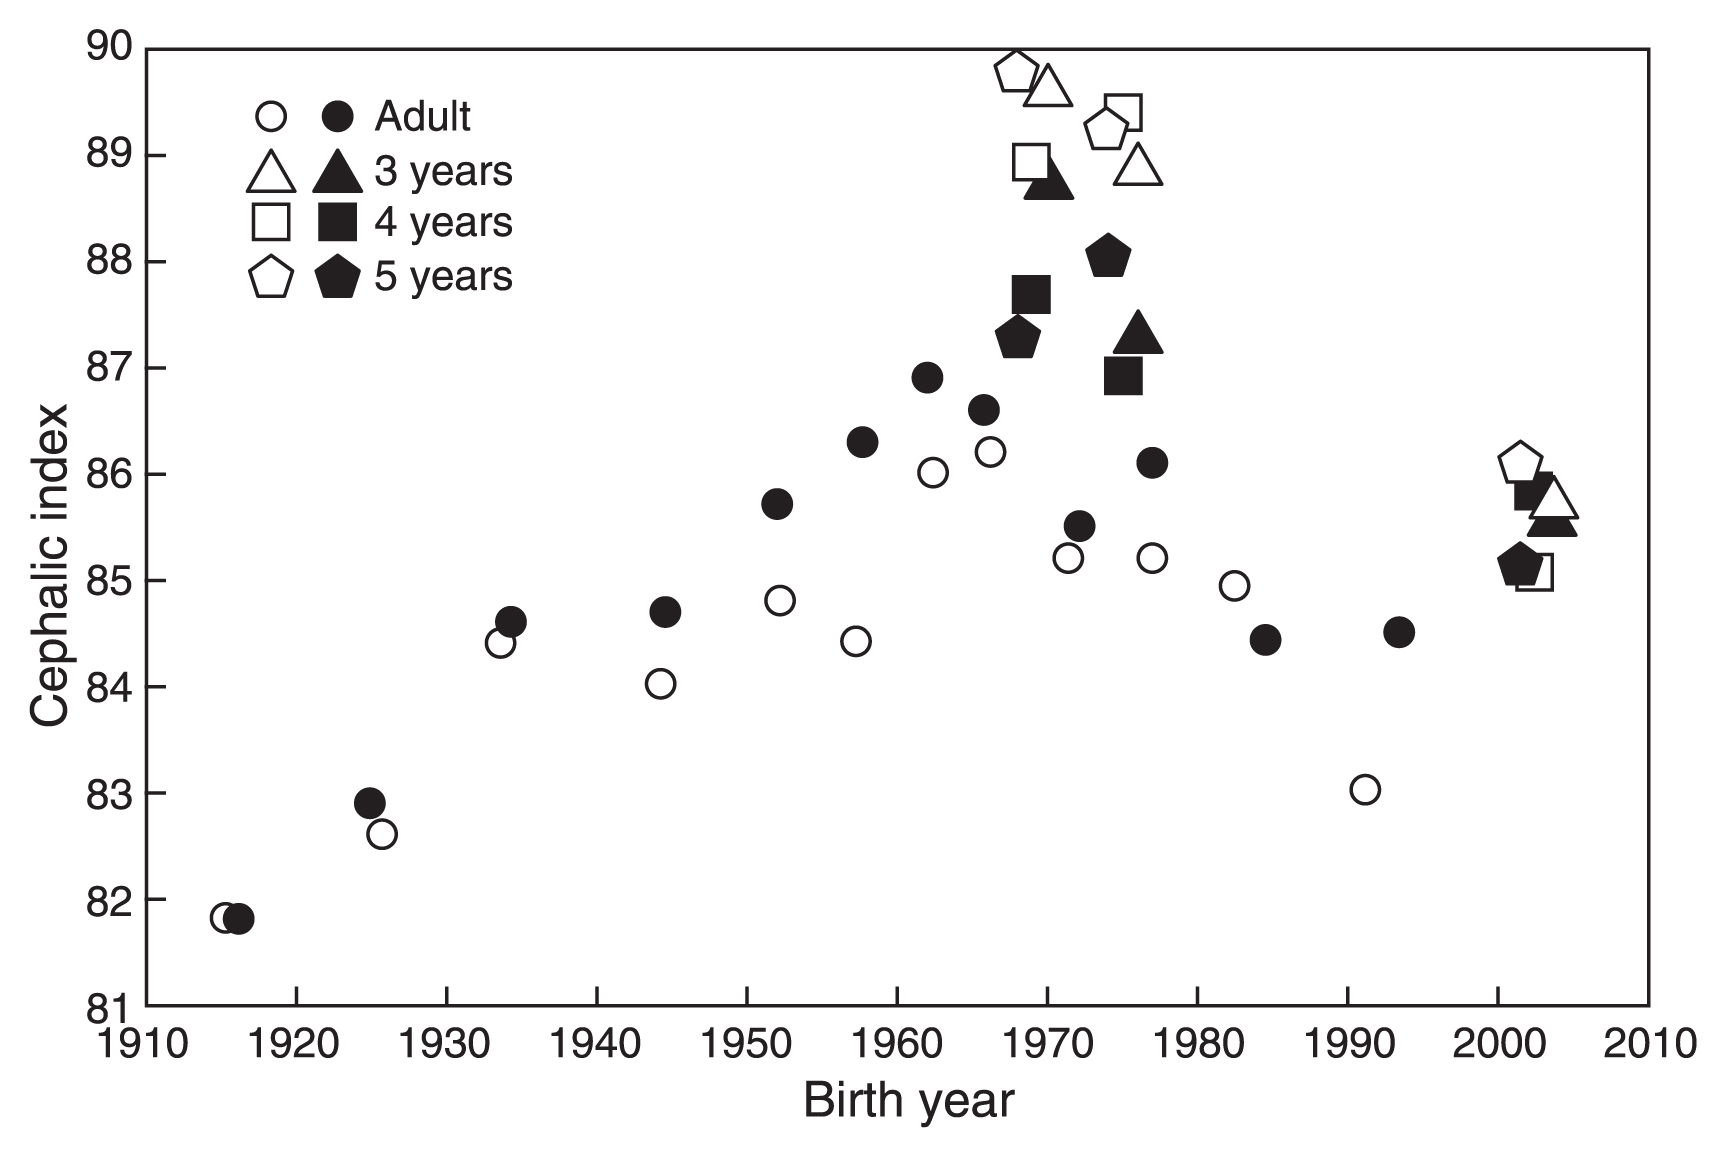
Relationship between birth year and the cephalic index of Japanese individuals. Open marks indicate males and solid marks indicate females.
Figure 7 shows relationships between BY and weight and BY and height (recumbent length at <2 years of age) at birth, 1, 3, and 7 years of age.

Secular changes in body size at birth and at 1, 3, and 7 years of age. See Table 3 for references.
Figure 7A shows the relationship between BY and BW. Mean BW basically increased from 1900 to 1950, rapidly increased in the 1960s, was heaviest in the mid-1970s, and then started to decrease in the late 1970s. Mean BW continued to decrease, and was neither substantially different from that in the 1930s in 2000, nor from that in the 1910s in 2010, in both males and females. The BY at the peak calculated using the data from National Growth Survey on Preschool Children (1960 ≤ BY ≤ 2000) was 1977.8 for males (R2 = 0.978, P < 0.01) and 1978.5 for females (R2 = 0.954, P < 0.01).
BL showed similar trends as BW between 1950 and 2010; however, the trend reversal occurred 10 years earlier (Figure 7E). BL was longest in the 1960s. The BY at the peak calculated using data from National Growth Survey on Preschool Children (1950 ≤ BY ≤ 2000) was 1966.2 for males (R2 = 0.927, P < 0.05) and 1966.5 for females (R2 = 0.930, P < 0.05).
It is reasonable to assume that BW and BL are influenced by the same environmental factors. The difference observed in the timing of trend reversal between BW and BL may be due to differences in fetal growth patterns. According to Kimura (1979), during the fetal growth period, increase in weight is proportional to body length cubed (body length3), and body length grows most rapidly during mid-fetal life, whereas weight grows most rapidly during late fetal life (Smith and Yuen, 1973; Kimura, 1979). Intrauterine conditions may affect BL more than BW, as body length has a longer period of rapid fetal growth. The fetal growth pattern of body length is similar to those of HL and HB shown in Figure 2.
Secular changes in body size at 1, 3, and 7 years of ageWT-1 (Figure 7B) increased from 1960 to 1970, and was almost stable between 1970 and 1990. WT-3 (Figure 7C) increased from 1960 to 1980, and was stable between 1980 and 1990. WT-7 (Figure 7D) started to increase in the 1900s. Although a weak decreasing trend was observed in these variables in the generation born after 1990, this was more than 20 years after debrachycephalization began.
RL-1 (Figure 7F) increased from 1960 to 1970, and remained stable between 1970 and 2000. HT-3 (Figure 7G) increased from 1960 to 1980, and remained stable after 1980. HT-7 (Figure 7H) rapidly increased starting in the 1900s. The rate of secular change in HT-7 slowed in the mid-1960s, and ceased to increase in the generation born in and after the 1980s.
It is interesting to note that a clear reverse trend observed in BW and BL was not observed in body size variables at 1, 3, and 7 years of age.
Environmental factorsFigure 8 shows trends in some of the environmental variables listed in Table 3.

Secular changes in the indicator variables of environmental factors. See Table 3 for references.
Figure 8A shows the trend in energy intake per capita per day. The very severe shortage of food at the end of and after WWII started to recover in 1949, and energy intake reached pre-war levels in 1953 (Yamazaki, 1973). Energy intake increased from 1964, peaked in 1971, and then suddenly started to decrease in 1974. The period of highest energy intake was later than the observed trend reversals in CI and BL by 10 years, and slightly earlier than the initiation of decreasing BW.
Decreases in energy intake starting in the mid-1970s were primarily due to decreases in carbohydrate intake. Changes in nutrient intake among the Japanese population after WWII reflect the Westernization of dietary patterns, which involved a significant increase in fat and animal protein intake (Figure 8B), a decrease in the proportion of energy obtained from grains, and an increase in protein intake from animal sources (Figure 8C). In the mid-1990s, trends in fat intake and animal protein intake reversed (Figure 8B), and increases in the proportion of energy obtained from grains and the amount of protein from animal sources reached a plateau (Figure 8C). However, these changes occurred 30 years after the start of debrachycephalization.
Maternal body size and compositionMH-20 continued to increase in the generations born in and after the 1950s, with particular growth in MH-20 observed in generations born in and after the 1970s, when a majority of mothers were born after WWII. MH-20 was not significantly correlated with MW-20, which did not show a trend with BY, but highly negatively correlated with MBMI-20 (r = −0.920, degree of freedom (df) = 12, P < 0.01)
Figure 8D shows the relationship between the BY of the child and the MBMI-20. Contrary to MH-20, MBMI-20 decreased until 1990. This trend reflects secular changes in height and weight in young adult Japanese females; we observed increases in height, but weight increases were very small (Kouchi, 1996).
Smoking during pregnancyFigure 8E shows smoking rates among pregnant women in 1990, 2000, and 2010, as well as trends in the smoking rates of Japanese males and females in the general population aged 20–29 years. Smoking rates among females have steadily increased since 1965, but started to decrease in the early 2000s. If smoking rates among pregnant women reflect those of the general young adult female population, then the smoking rates among pregnant women should show similar trends. Conversely, exposure to passive smoking has likely reduced since the mid-1970s, when smoking rates among males started to decrease.
Smoking rates among Japanese females from 1944 to 1947 are considered close to 0% because a tobacco rationing system was introduced in 1944 due to supply shortages during WWII, and tobacco was only distributed to men until 1947. The tobacco rationing system was abolished in 1950 (Japan Tobacco Inc., 2016; Tobacco and Salt Museum, 2017). Therefore, it is likely that smoking rates among pregnant women increased between 1950 and 1965, when BL and CI were increasing.
Head deformation during childbirth and delivery by Cesarian sectionFigure 8F shows trends in C-section rates and percentage of births performed at medical institutions. Although information before 1984 is unavailable, C-section rates pre-1950 are considered very low, as <5% of infants were born in medical institutions. The percentage of infants born in medical institutions rapidly increased from 5.2% in 1950 to 84.9% in 1970, reaching 95% in 1979. C-section rates were 7.3% in 1984 and increased to 19.7% in 2014. It is currently unknown when, exactly, C-section rates started to increase. The increase in C-section rates was highly correlated with the mean maternal age between 1984 and 2014 (r = 0.966, df = 9, P < 0.01). The mean maternal age decreased between 1950 (28.7 years) and 1960 (27.6 years), was relatively stable between 1960 and 1976 (27.5 years), and then started to increase. Mean age rapidly increased in the 2000s, and was 31.8 years in 2015.
Nutritional and health status during the first year of birthFigure 8G shows the trend in the percentage of bottle-fed infants. The percentage of bottle-fed infants increased after WWII when low-priced infant formula became available (Murata, 2012), and when there was a rapid increase in hospital births (Otani, 1998). The percentage of bottle-fed infants rapidly increased until the mid-1970s, and then started to decrease. The timing of the trend reversal was 10 years later than the start of debrachycephalization. BY at the peak, calculated using three data points including the maximum value, was 1973.7, 1974.2, 1974.9, and 1975.8 for 1 month, 2 months, 3 months, and 4 months of age, respectively.
The trend reversal was due to the promotion of breastfeeding by MHLW (Children and Families Bureau, Ministry of Health and Welfare, 1975; Otani, 1998) following a resolution of the World Health Organization in 1974 noting the importance of breastfeeding. After 1975, some companies modified the nutritional components of infant formula, reducing the calories per volume (Kobayashi et al., 1984), which also may have influenced growth in the first year of life.
Another indicator of nutritional status in the first year of life is the timing of weaning. Figure 8H shows the relationship between BY and mean age at the end of weaning. The mean age at the end of weaning has become younger since 1970, but this trend reversed in the 1980s. It was 12.1–12.3 months in the mid-1980s, and 13.5–14.0 months in the mid-2000s. However, the timing of the trend reversal was 20 years later than the start of debrachycephalization. BY at the bottom was calculated as 1983.1 (R2 = 0.948, P < 0.0001).
Postneonatal mortality rapidly decreased from 96.7/1000 in 1920 to 4.4/1000 in 1970. It continued to decrease, and was lower than 2/1000 in 1996. No trend reversal was observed.
Hygienic condition of school childrenPrevalence of parasite eggs among elementary school students has rapidly decreased since the late-1940s to <5% in 1980 and <1% in 2002. No trend reversal was observed.
Economic situationsThe average growth rate of the real GDP was 9.0% between 1947 and 1973, 4.2% between 1974 and 1990, and 0.9% between 1991 and 2003. Debrachycephalization and decrease in BL started in the 1960s when the growth rate of real GDP was still very high.
The results of the present study showed that the trend reversal from brachycephalization to debrachycephalization occurred in the generation born in the early 1960s (Figure 5 and Figure 6, Table 4). This finding suggests changes in growth by 3 years of age. However, it is not known if the change was acceleration or retardation of growth in nature because secular change is based on form, and not on the size. The growth pattern of head measurements (Figure 2) and the observed association between the trend reversals in CI and BL suggest a significant contribution of changes in prenatal growth. However, the contribution of postnatal growth to the debrachycephalization is not clear.
Contrary to the head measurements, association between height and environmental conditions during growth is widely accepted (Bielicki, 1986; Komlos and Launderdale, 2007). Therefore, by examining the contributions of pre- and postnatal growth to the secular changes in height in generations that experienced the debrachycephalization, it may be possible to assess the contribution of changes in pre- and postnatal growth to the start of debrachycephalization.
Decrease in BL suggests a decrease in fetal growth rate, but this might not be true because many factors other than fetal growth rate affect BL. Therefore, it is necessary to clarify possible causes of trend reversal in BL. Many papers have been published that investigated possible causes of reverse trend in BW in Japan, but none on the reverse trend in BL. Since BW and BL are influenced by the same intrauterine environment, papers on possible causes of reverse trend in BW are reviewed to understand causes of reverse trend in BL.
Mean BW increased from the 1910s to the mid-1970s, and then started to decrease (Figure 7A). Possible causes of reverse trends in BW have been analyzed using statistical or original data from Vital Statistics and other surveys conducted by MHLW (Doi et al., 1993; Nakamura, 1995, 2002; Furuta and Matsuda, 1998; Yoshida et al., 2014), data from Perinatal Care Information Network of Tokyo Metropolitan (Nakamura and Nagasaka, 2004), and databases from hospitals in Okinawa (Matsuda, 1990), Nara (Yoneyama et al., 1992), and Osaka (Hiroshige et al., 1994). Examined variables include, but were not limited to, gestational age, sex of infant, parity, maternal age and height, maternal weight and BMI before pregnancy, maternal weight gain during the pregnancy, maternal energy intake during pregnancy, maternal smoking, pregnancy toxemia, placental dysfunction, percentage of multiple pregnancies, or increased prevalence of extremely LBW infants, and infertility treatment.
A reverse trend in mean BW was observed even when sex of infant, parity, gestational age, and maternal age were controlled and only single births were analyzed (Doi et al, 1993; Hiroshige et al., 1994; Nakamura, 1995; Nakamura and Nagasaka, 2004; Matsuda, 1990). The contribution of an increased prevalence of extremely LBW infants (BW < 1000 g) to the decrease in mean BW was much smaller than that of the increased prevalence of LBW infants (2000 g ≤ BW < 2500 g). Accordingly, a negative trend in prenatal growth rate is associated with the decrease in BW. This suggests that the fetal growth change that is related to the start of debrachycephalization is retardation rather than acceleration of growth, and that the deteriorated fetal nutritional status is a possible cause of the trend reversal in BL, BW, and CI
Variables that have largest influence on BW when gestational age was controlled were maternal weight gain during pregnancy and maternal weight and BMI before pregnancy (Matsuda, 1990; Nakamura, 1995; Nakamura and Nagasaka, 2004; Yoneyama et al., 1992).
Maternal weight gain during pregnancy decreased between 1979 and 1992 (Nakamura, 1995). The direct cause of this decrease in maternal weight gain during pregnancy is considered to be a decrease in energy intake caused by intervention by physicians. Since the mid-1970s, maternal weight gain has become strictly managed by physicians in order to avoid complications associated with excess maternal weight gain and obesity (Nakamura, 1995, 2002; Nakamura and Nagasaka, 2004; Furuta and Matsuda, 1998; Matsuda et al., 1998; Yoshida et al., 2014). In a study in which the energy intake of 200 pregnant women was studied, the maternal energy intake was smaller than recommended by the Dietary Reference Intakes for Japanese by MHLW, and was not significantly different from that of women who were not pregnant (Fukuoka, 2010).
The decrease in maternal energy intake is related to the decrease in mean energy intake of the Japanese population. Despite starting just after the oil crisis in the 1970s (Figure 8A), this sudden decrease in energy intake among Japanese individuals was not a direct result of economic conditions at that time. In the mid-1970s, the MHLW considered that the postwar food shortage was no longer an issue, and that new problems related to excessive food consumption, namely obesity, should be addressed (Ministry of Health and Welfare, 1975). Since then, the MHLW has periodically revised recommended dietary allowances (RDAs) and promotes health and disease awareness at a national level. Table 5 shows changes in the energy requirement of an average Japanese per person per day from 1947 and 1979 (Numajiri, 1980). The RDA for pregnant women has also continued to be revised over the years, and the recommended energy intake has gradually reduced (Hiroshige et al., 1994). With the start of management of maternal weight gain by physicians in order to avoid complications associated with excess maternal weight gain and obesity (Furuta and Matsuda, 1998; Nakamura, 2002; Yoshida et al., 2014), energy intake among pregnant women has gradually decreased, and this change has likely influenced maternal weight gain during pregnancy and the nutritional status of the fetus (Hiroshige et al., 1994; Furuta and Matsuda, 1998; Nakamura, 1995, 2002; Nakamura and Nagasaka, 2004; Matsuda et al., 1998; Fukuoka, 2010; Yoshida et al., 2014).
| Year | Daily energy requirement (kcal) |
|---|---|
| 1947 | 2150 |
| 1954 | 2180 |
| 1960 | 2200 |
| 1963 | 2300 |
| 1969 | 2150 |
| 1975 | 2100 |
| 1979 | 2000 |
Data from Numajiri (1980).
The other important factor that influences BW is maternal weight and BMI before pregnancy. MBMI-20 rapidly decreased after 1950 (Figure 8D) because the increase in weight was very small in spite of an increase in height. Some researchers have also cited the negative effects of an increase in young women with a BMI < 18.5 as a possible contributing factor to decreasing BW (Matsuda et al., 1998; Nakamura, 2002; Nakamura and Nagasaka, 2004; Fukuoka, 2010).
Figure 9 and Figure 10 show the relationship between BY and BMI of Japanese females and males, respectively. Figure 9 shows that after WWII, BMI increased in females ≤15 years of age, but changes were very small in 17-year-old females, and a clear decreasing trend was observed in females ≥20 years of age. BMI at 20 years of age (BMI-20) is not available for females born before 1927. However, when the data measured in 1947 were used for the generation born between 1922 and 1926, an increase in BMI with BY is observed from 1922 to 1927. Therefore, female BMI-20 may have started to decrease in the generation born in and after 1928. Since the mean height of Japanese females increased in all ages, the cause of decrease in BMI-20 was a very small increase in weight (Kouchi, 1996).
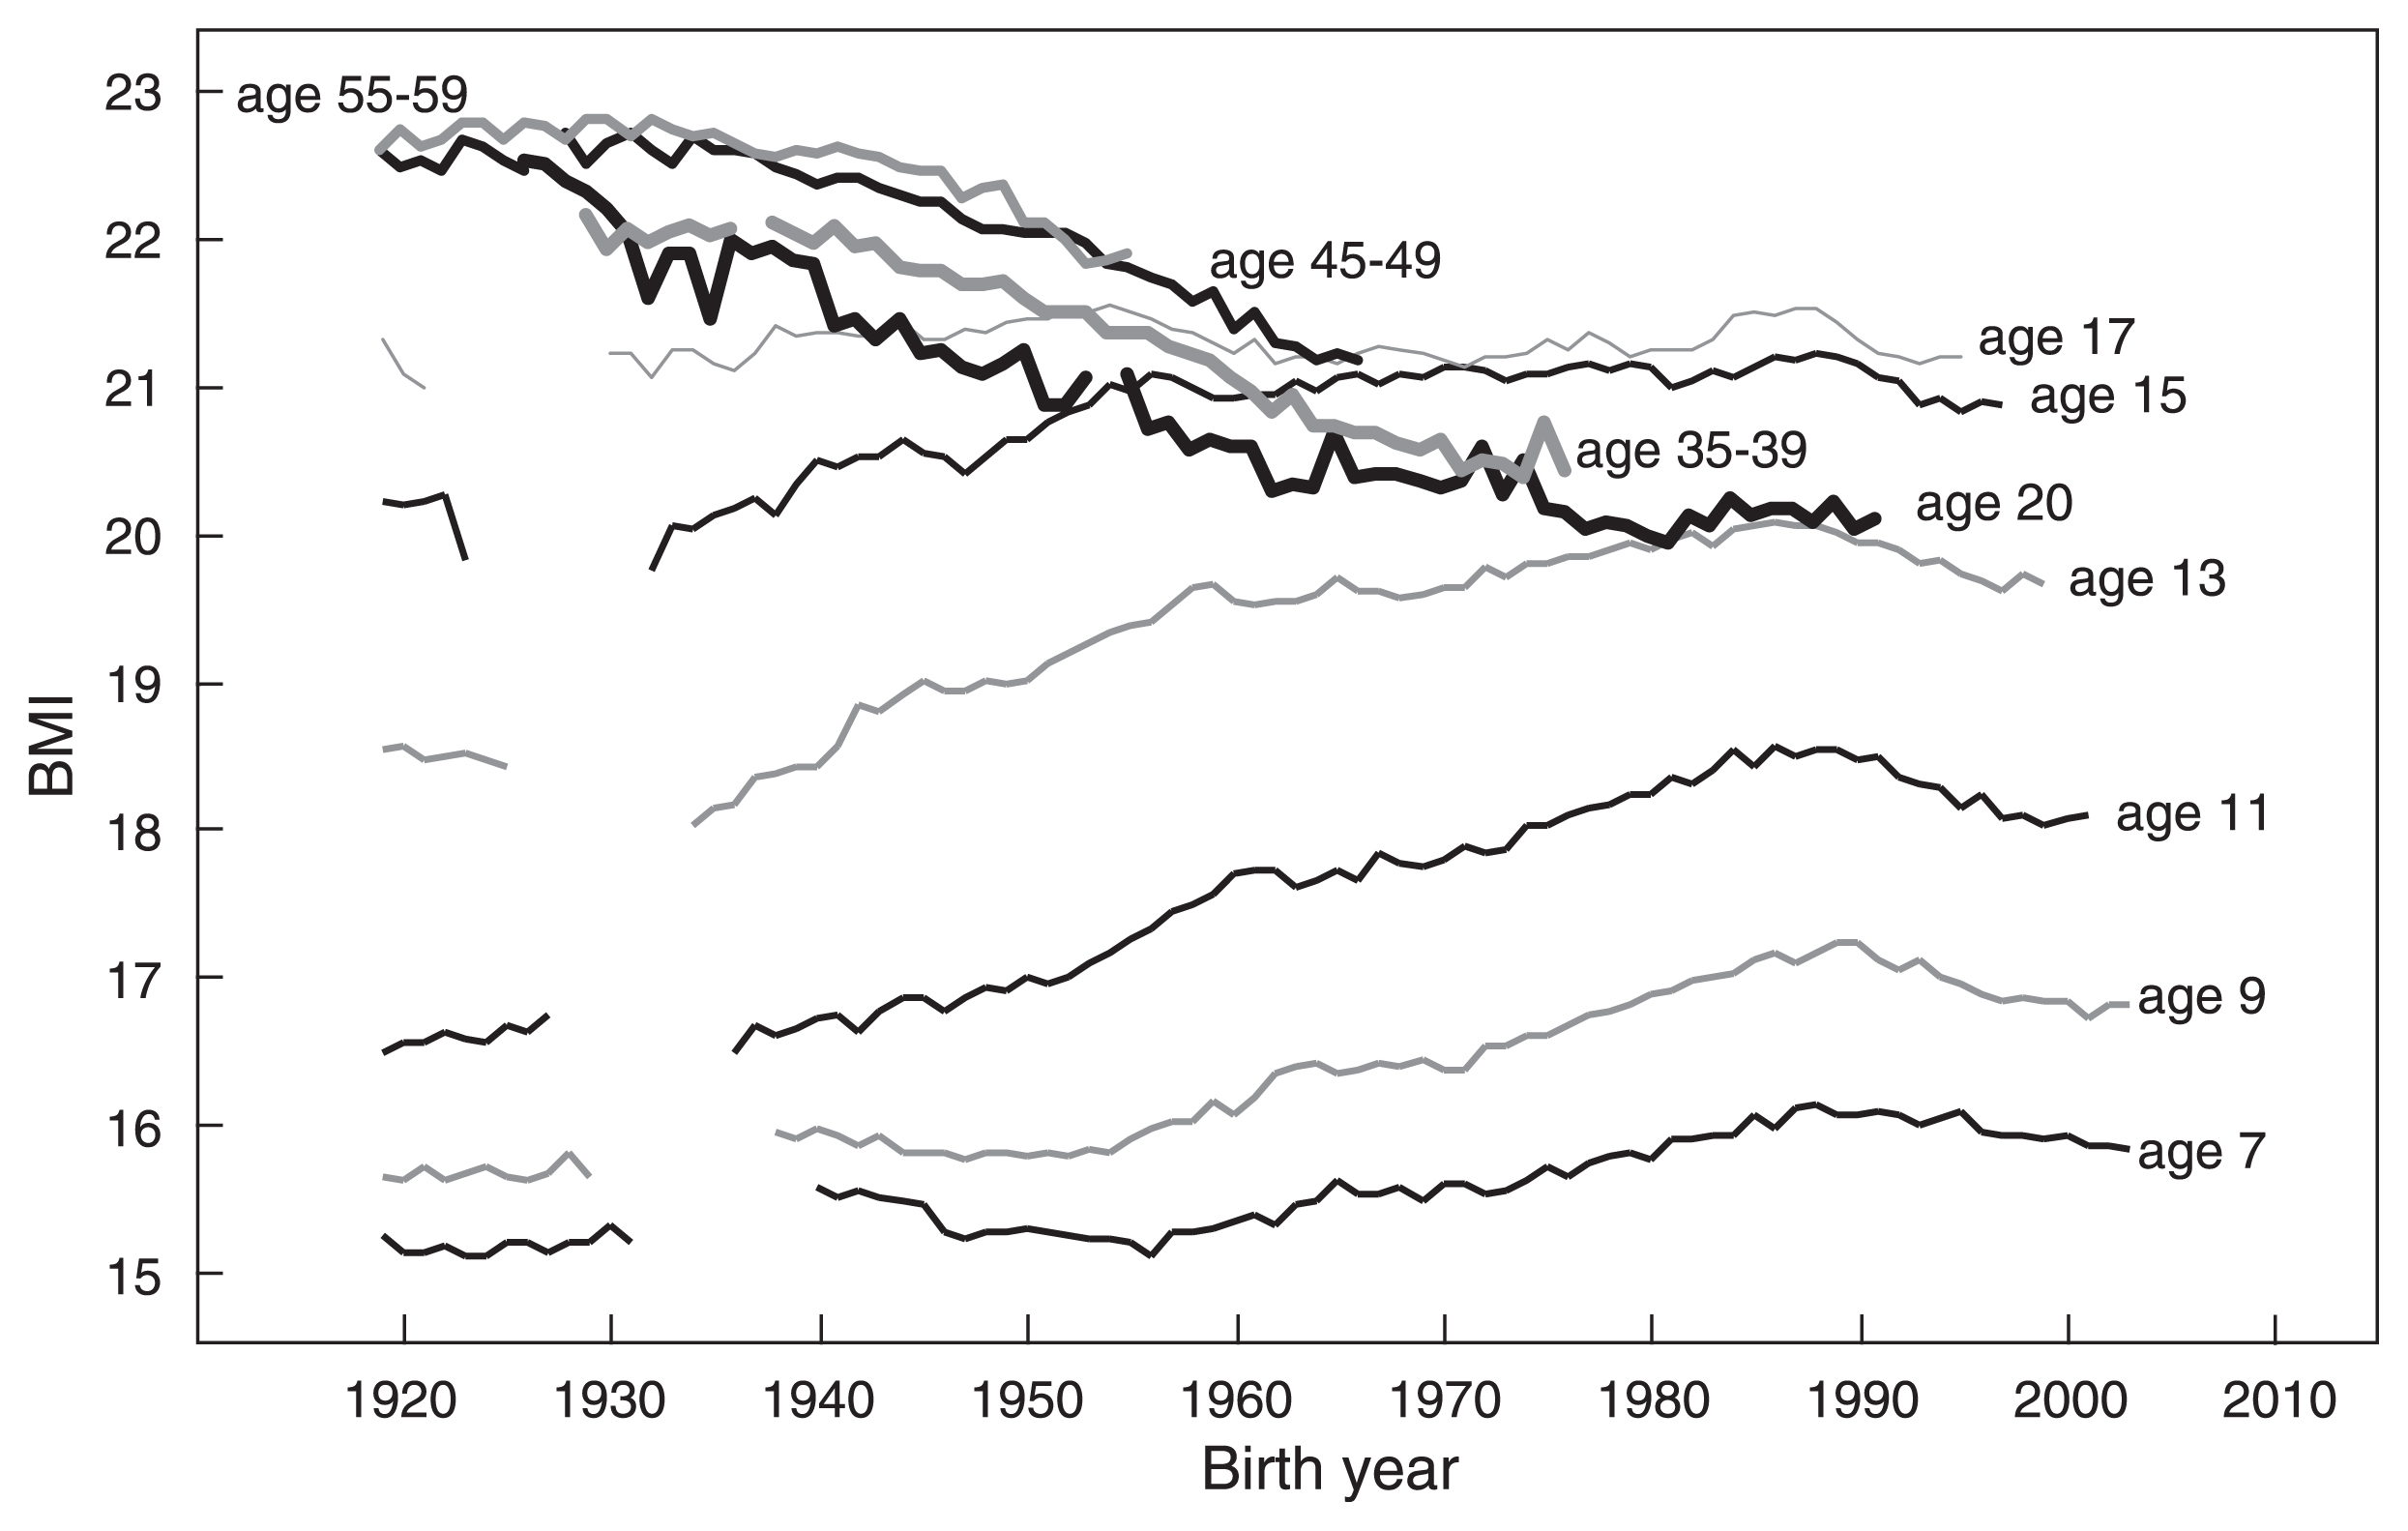
Secular changes in BMI of Japanese females. Data for females ≤17 years are from the School Health Survey, and data for females ≥20 year are from the National Health and Nutrition Survey (birth year <1944) or from the Physical Fitness Survey (birth year ≥1944).
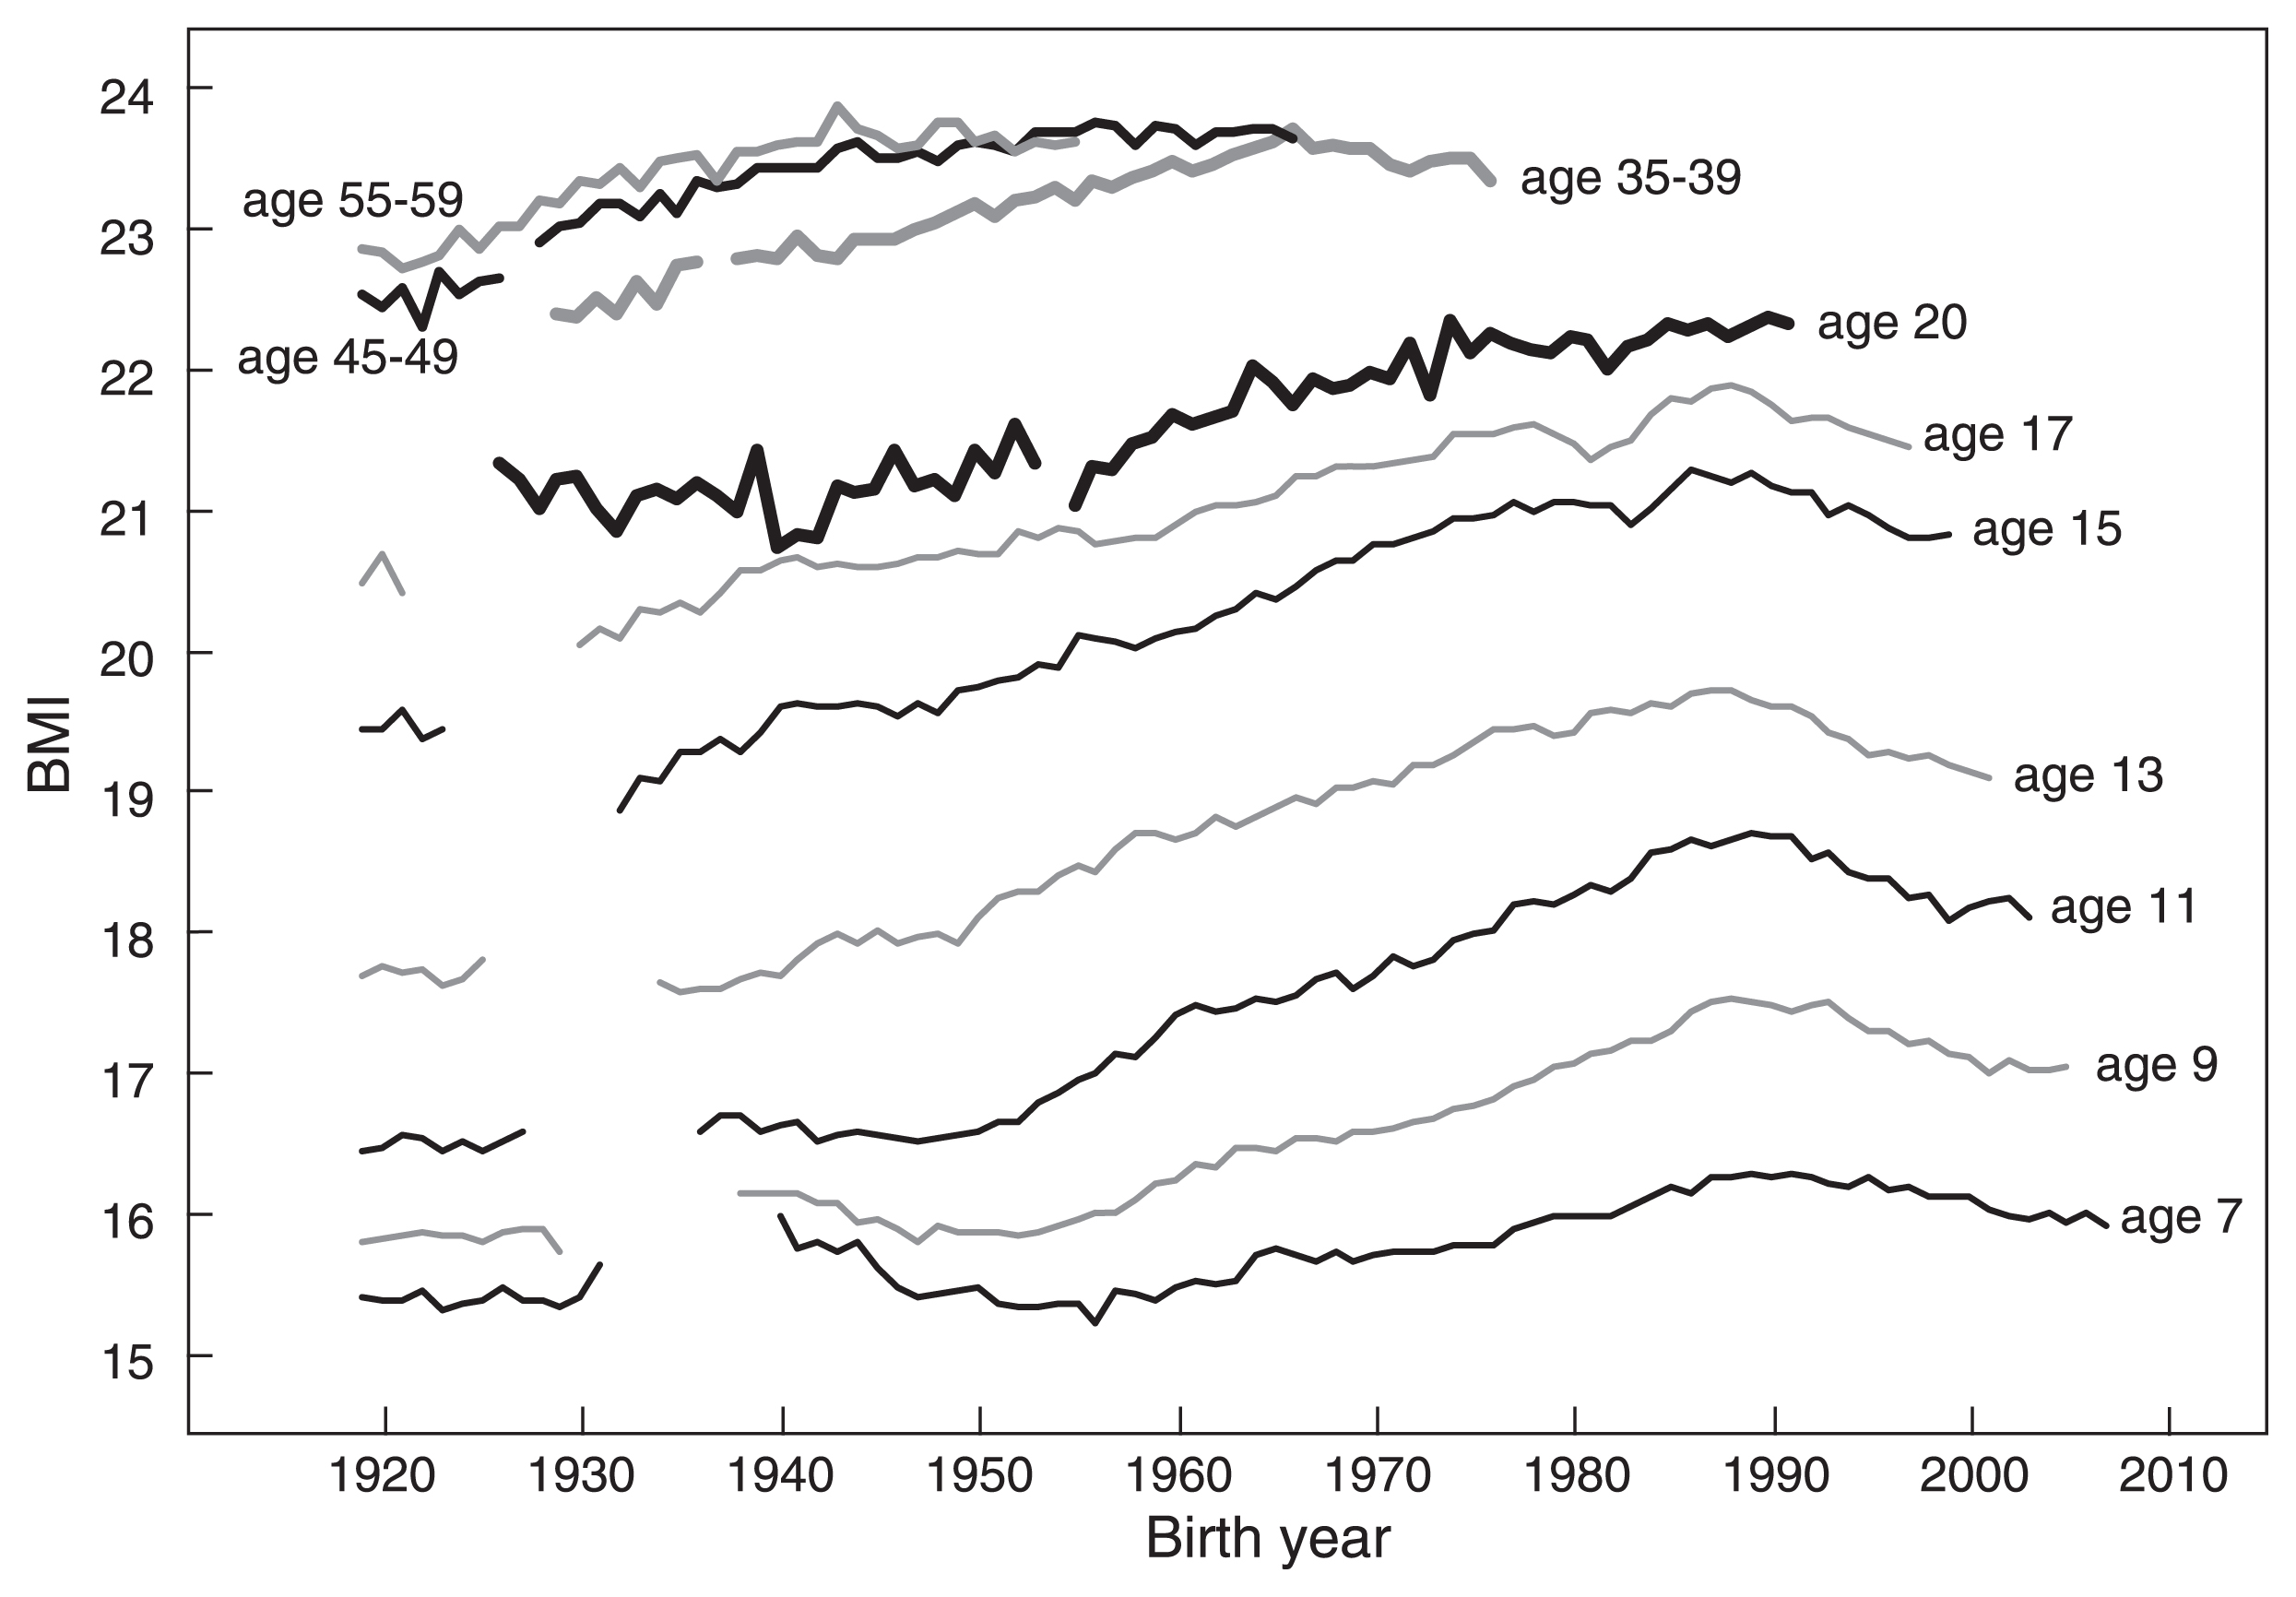
Secular changes in the BMI of Japanese males. Data for males ≤17 years are from the School Health Survey, and data for males ≥20 years are from the National Health and Nutrition Survey (birth year <1944) or from the Physical Fitness Survey (birth year ≥1944).
Figure 9 shows that BMI increases from 7 years to 17 years. Although BMI-20 shows a decreasing trend, it was larger than BMI at age 17 years until 1943. BMI-20 became smaller than BMI at age 17 years in females born in and after 1944, smaller than BMI at age 15 years in females born in and after 1957, and smaller than BMI at age 14 years in females born in and after 1970. This is due to the decrease in weight not to the increase in height after 17 years of age.
Figure 10 shows that BMI increased in males of all ages. The exception is a very small increase in BMI-20 of males born before 1950. A decreasing trend of adult BMI (age ≥20 years), a very small increase in BMI at 17 years, and a decrease in weight after 17 years of age are observed only in females. These sex differences need some explanation.
There are two possible causes for the decreasing trend in adult female BMI. One is that females are more concerned with health and diet (White Paper on Annual Health, Labour and Welfare Report 2014) and more diligent than males about preventing obesity and lifestyle-related diseases (2002 National Health and Nutrition Survey report). Different trends between males and females aged 45–49 years and 55–59 years born in and after the mid-1940s may be due to such differences: BMI plateaued in males, but decreased in females (Figure 9, Figure 10). However, age groups expressing health concerns about being overweight were mainly ≥30 years in both males and females (2002 National Health and Nutrition Survey report). The decreasing trend of BMI-20 in females born in and after 1928 and decreases in BMI and weight between 17 years and 20 years observed in females born in and after the mid-1940s cannot be explained by health consciousness. It cannot be explained by food shortages caused by WWII either, because these trends started when the food shortage started to recover or energy intake was increasing.
Another possible cause is dietary behaviors related to the culturally entrenched ideal body image among Japanese females (Chisuwa and O’Dea, 2010). According to the 1996 report of the National Nutrition Survey, 11.1% of females aged 20–29 years were on a diet to lose weight, and according to the 2002 National Nutrition Survey report, 54.4% of females aged 20–29 years and 64.1% of females aged 15–19 years were trying to lose weight irrespective of BMI. The percentage of people who periodically measure their weight among Japanese aged 20–29 years was 58.3% in males and 72.6% in females. Among these females, 49.9% answered “want to be beautiful” as the reason for periodic weight measurement. Young adult Japanese females are concerned about being overweight because they want to stay beautiful rather than because they want to stay healthy.
Timing of trend reversalVariables that showed a trend reversal were CI, BL, BW, energy intake, percentage of bottle-fed infants, and age at the end of weaning. Body size at birth is related to the environment surrounding the pregnant woman. Therefore, events linked to secular changes in these variables and in female BMI-20 are ordered according to the MBY in Table 6. When MBY for infants born in a year was not available, it was estimated from the BY of infants using a linear regression function calculated using the data during the period between 1925 and 2015 (MBY = 0.9807 × BY of infants + 28.839, R2 = 0.999, P < 0.01).
| Year of observation | Related population | Event | BY of child | Mean BY of mothers |
|---|---|---|---|---|
| 1949 | Mother | Food shortage started to recover | 1949– | 1920* (mothers) |
| 1950–60 | Child | BL increased | 1950–60 | 1921–32 (mothers) |
| 1953 | Mother | Energy intake recovered to prewar level | 1953– | 1924*– (mothers) |
| 1948 | Mother | BMI-20 started to decrease | — | 1928† |
| 1960–70 | Child | BW increased | 1960–70 | 1932–42 (mothers) |
| 1961 (M), 1963 (F) | Child | Debrachycephalization started | 1961, 1963 | 1932*, 1934* (mothers) |
| 1964 | Mother | Rapid increase in energy intake | — | 1935* (mothers) |
| 1966 (M & F) | Child | BL started to decrease | 1966 | 1937* (mothers) |
| 1972 | Mother | Energy intake started to decrease | — | 1943* (mothers) |
| 1964 | Mother | BMI-20 < BMI-17 | — | 1944† |
| 1975 (M), 1976 (F) | Child | BW started to decrease | 1975, 1976 | 1946*, 1947* (mothers) |
| 1969 | Mother | BMI-20 < BMI-16 | — | 1949† |
| 1979 | Mother | Energy intake < Energy intake in 1930–39 | — | 1950* (mothers) |
| 1989 (F), 1991 (M) | Child | Height at 7 years ceased to increase | 1982, 1984 | 1953*, 1955* (mothers) |
| 1977 | Mother | BMI-20 < BMI-15 | — | 1957† |
| 1990 | Child | BL< BL in 1950 | 1990 | 1961 (mothers) |
| 1990 | Mother | BMI-20 < BMI-14 | — | 1970† |
| 2000 | Child | BW< BW in 1930–39 | 2000 | 1978 (mothers) |
| 2000 | Mother | BMI-20 ≈ BMI-13 | — | 1980† |
Abbreviations: BL, birth length; BMI-x, body mass index at x years of age; BW, birth weight; BY, birth year; F, female; M, male.
Table 6 shows that the post-war food shortage started to recover in MBY 1920, and BL increased between MBY 1921 and MBY 1932. Female BMI-20 started to decrease in MBY 1928, followed by the start of debrachycephalization (MBY = 1933 in males, 1935 in females), though BW started to increase (MBY = 1932). HL started to increase before this. Energy intake rapidly increased from MBY 1935, but BL started to decrease in MBY 1938. HB started to decrease in MBY 1937–42. Energy intake started to decrease in MBY 1943. Female BMI-20 became smaller than BMI at age 17 years in MBY 1944, and the strict management of weight gain among pregnant women by physicians started around this time. BW started to decrease in MBY 1949 in males and MBY 1950 in females. Decreases in energy intake, BW, BL, and BMI-20 continued until MBY 1980. Female BMI-20 became smaller than BMI at age 16 years in MBY 1949, energy intake became smaller that that in the 1930s in MBY 1950, and HT-7 ceased to increase in MBY 1953–55.
Decrease in energy intake and strict management of weight gain among pregnant women by physicians may not be the direct cause of trend reversal in BL and CI, which occurred before these events. The decrease in BMI of young adult females that started in MBY 1928 is a more probable cause of the reverse trend in fetal growth. We can speculate that the increase in BL and CI ceased when the negative effects of decreasing BMI of young adult females outweighed the positive effects of improving nutritional conditions of pregnant women. The decrease in energy intake and the activities of physicians to avoid over-nutrition of pregnant women likely contributed to further deterioration of fetal nutritional status, and a continued decreasing trend in BL, CI, and, eventually, BW.
The purpose of health promotion programs by the MHWL and doctor-recommended weight management during pregnancy were intended to prevent problems related to over-nutrition and obesity. These programs have resulted in a very low adult obesity (BMI >30) rate of 5.8% for males and 4.4% for females in Japan in 2008 (http://top10.sakura.ne.jp/WHO-NCD-BMI-30C-Male-AGE20-PLUS, http://top10.sakura.ne.jp/WHO-NCD-BMI-30C-Female-AGE20-PLUS.html). On the other hand, coupled with the decreasing trend of BMI of young adult females, they may have also resulted in the unexpected reverse trends in CI, BL, and BW.
Contribution of postnatal growthApproximately 45% of HL growth after birth and approximately 75% of HB growth after birth occur within 1 year of birth. Therefore, the effects of environmental changes during this period on the secular change in CI may not be negligible.
Figure 11 shows the relation between the year of examination and increment of height (recumbent length) from birth to 1 year of age calculated as RL-1 minus BL. The increment of height during the first year of life continued to increase between 1960 and 2000. This suggests that nutritional and health conditions in the first year after birth were improving during this period, and that reverse trends in the percentage of bottle-fed infants, and age at the end of weaning did not have much negative effect on growth, if any. If the trend reversal in CI is associated with the deterioration of fetal nutritional status, then it is likely that nutritional conditions after birth worked against debrachycephalization.

Secular changes in the increment of recumbent length from birth to 1 year. Data from National Growth Survey on Preschool Children.
Along with the decrease in mean BW, the incidence of LBW infants has been increasing. Some researchers have cited inadequate nutrition during the prenatal period as the primary reason for this trend (e.g. Fukuoka, 2010). According to the fetal origin of adult disease theory (Barker, 2007), such under-nutrition may lead to adult diseases (Fukuoka, 2010; Nakamura and Nagasaka, 2004). Excessively strict management of weight gain during pregnancy has recently been regarded as a problem, resulting in the development of new nutritional guidelines for pregnant women (Fukuoka, 2010; Ministry of Health, Labour and Welfare, 2006). The adult population studied in the present study included individuals born before the year 1996, for whom estimated MBY was 1966. The secular decrease in BMI of females aged 20–24 years has ceased in the generation born around 1980. Due to the aforementioned modification of nutritional guidelines for pregnant women and the ending of the decrease in the BMI of young adult females, a cessation of secular changes or another trend reversal in CI could occur among the generation born in the 21st century.
Changes in head shapeKouchi (2000) speculated that the preferential increase in growth rate of the neural skull in a lateral direction during the first year of life was the main cause of brachycephalization among Japanese individuals born between 1912 and 1979. However, our results suggest that prenatal growth has a greater influence on secular changes in CI than postnatal growth.
Secular changes in height can be explained by an increase or decrease in growth rate caused by improvement or deterioration of nutritional conditions. However, secular changes in the head shape cannot be explained without considering differential growth rates according to the directions of growth vectors.
Trenouth (1991) reported that changes in the shape of the fetal cranium were highly correlated with relative growth rates rather than with growth rates. The relative growth rate was different between anteroposterior, lateral, and vertical dimensions, and length became relatively larger while breadth and height became relatively smaller during 2.5 and 5.5 months gestation (Trenouth, 1991).
Compensatory relations between cranial breadth, height, and length have been reported (Boas, 1899; Mizoguchi, 1992). When a secular change in head shape is observed, HB increased while HL decreased (Kouchi, 2000), or HB decreased while HL increased (Susanne et al., 1988), or HB decreased while cranial height increased (Jantz and Meadows Jantz, 2000). These findings suggest that the relative growth rates of cranial length, breadth, and height are interdependent.
Changes in the relative growth rates of fetal brain may result in changes in head shape. Observed secular changes in head shape may be explained if the relative growth rates of fetal brain in different directions are affected by intrauterine environmental conditions differently.
Future studiesOne limitation of the present study is a lack of information about some environmental variables before the time of trend reversal in CI.
The effect of maternal smoking on brachycephalization, if any, remains unclear. However, it is unlikely that an increase in smoking rates among pregnant women directly initiated debrachycephalization. In fact, decreased BW was observed between 2000 and 2010 despite decreases in smoking rates among pregnant women, and the effects of smoking during pregnancy over that time period were reported as small (Yoshida et al., 2014). In addition, the present results show that BL and CI increased from 1950 and 1960, during which time maternal smoking rates probably increased. However, possible effects of maternal smoking on brachycephalization should be further explored when data become available.
The potential long-term effects of C-section on brachycephalization remain unclear. Normal birth molding typically resolves within hours to weeks without intervention (Ridgway and Weiner, 2004). In addition, neither the brachycephalization trend observed in the generation born between the 1890s and the 1960s (Kouchi, 2000) nor the debrachycephalization trend observed between the 8th and the 14th centuries in Japan (Suzuki, 1969; Nakahashi, 1987) were related to C-section rates. These findings suggest that the recent debrachycephalization trend can likely be explained without considering the increase in C-section rates. However, further investigations are necessary to reject the hypothesis that head deformation at childbirth does not contribute to secular changes in adult head shape.
Another limitation is the lack of information on the energy intake according to sex and age group. The fact that a decreasing trend in adult BMI is observed only in females suggests sex- and age-related differences in secular changes in energy intake. However, such data are available only since 1995. It may be interesting to examine the process of the decreasing trend in the BMI of young adult females starting in the generation born at the end of 1920s.
Brachycephalization occurred alongside an increase in height among certain Asian populations, such as the Japanese (Shapiro, 1939; Beiguelman, 1963; Morita and Ohtsuki, 1973) and Koreans (Kouchi, 2000). Data from the Size China project (Ball, 2011) also showed increases in height and brachycephalization in 20th-century China. However, debrachycephalization has been observed to occur simultaneously with increases in height in certain European countries (Facchini and Gualdi-Russo, 1982; Susanne et al., 1988; Buretić-Tomljanović et al., 2004). Further studies on fetal cranial growth are necessary to explain these population differences.
CI is only a simple indicator of head shape, and its secular changes show only a limited aspect of the cranial shape change. The finding that a reversed trend in HL started earlier than that in HB suggests that changes in relative growth rate in different directions may not occur simultaneously. Studies on the three-dimensional shape of fetal or infant growth may be necessary to understand the process of secular changes in the head shape.
Cephalic data of Japanese individuals born between 1910 and 1996 residing in the Kanto region of Japan were examined for secular changes using regression analyses. Brachycephalization was observed in the generation born in and before 1960–63, evidenced by a decrease in HL and an increase in HB. Conversely, debrachycephalization was observed in the generation born after 1960–63, which was evidenced by an increase in HL and a decrease in HB. Debrachycephalization was statistically significant, and the magnitude of change was larger than the geographical differences. Debrachycephalization was also observed in children 3–5 years of age.
Secular changes in body size at birth and at 1, 3, and 7 years of age, as well as 16 indicators of environmental factors, were examined to investigate possible causes of the trend reversal observed in CI secular changes. BL and BW showed a clear trend reversal in the generation born after 1966 and the generation born after 1977–78, respectively. Among 16 indicators of environmental factors, energy intake, percentage of bottle-fed infants, and age at the end of weaning showed a trend reversal starting in 1972, 1973–75, and 1983, respectively.
Since BL, BW, and CI are influenced by the same intrauterine environment, previous studies that investigated possible causes of the reverse trend in BW were reviewed. These studies on BW showed that the reverse trend in BW was associated with decreasing fetal growth rate, which was likely attributed to worsening intrauterine nutritional conditions, which in turn was related to decreased maternal energy intake. Since head measurements reach approximately 60% adult size at birth, debrachycephalizaion may also be attributed to worsening intrauterine nutritional conditions.
The decrease in maternal energy intake is partly caused by activities of the MHWL started in the mid-1970s to prevent problems caused by overweight and obesity, which resulted in the decrease in RDA and start of physician-recommended weight management during pregnancy. The other probable cause of a decrease in maternal energy intake is the behavior of young adult females to control their weight evidenced by the decreasing trend in BMI due to the very small increase in weight in spite of the increase in height that started in the generation born in and after 1928. Since the reverse trends in CI and BL started when food shortages after WWII were rapidly improving but maternal BMI was decreasing, we speculated that increases in BL and brachycephalization ceased once the negative effects of decreasing maternal BMI outweighed the positive effects of improving maternal nutritional conditions post-WWII. The reverse trend in energy intake and start of physician-recommended weight control among pregnant women likely contributed to a further deterioration of fetal nutritional status, and continued reverse trend in BL, CI, and, eventually, BW.
The finding that the increment in recumbent length during the first year of life increased between 1960 and 2000 suggested an improvement in postnatal nutritional conditions. Also, reverse trends in the indicators of nutrition during the first year of life occurred 10–20 years after debrachycephalization. Therefore, if debrachycephalizaion resulted from growth changes caused by the worsening fetal nutritional conditions, the contribution of postnatal growth to debrachycephalization may be small, if any.
The limitations of the present study include the lack of information on some environmental factors before the trend reversals in CI and BL. Also, CI represents only a limited aspect of the head shape. In order to understand the process of brachycephaliczaion and debrachycephalization, further studies on the growth of the fetus and the infant are necessary when information becomes available using the three-dimensional head shape information.
| Prefecture | N | Mean age | Mean | SD | Mean | SD | Mean | SD | Mean | SD | |
|---|---|---|---|---|---|---|---|---|---|---|---|
| 1 | Hokkaido | 32 | 20.3 | 188.9 | 8.0 | 162.6 | 4.9 | 86.2 | 4.4 | 168.8 | 5.1 |
| 2 | Aomori | 32 | 20.9 | 189.2 | 5.4 | 160.9 | 5.7 | 85.1 | 4.1 | 170.2 | 5.8 |
| 3 | Iwate | 69 | 20.7 | 188.2 | 6.2 | 161.1 | 5.6 | 85.7 | 3.9 | 171.2 | 5.1 |
| 4 | Miyagi | 53 | 21.2 | 187.6 | 7.5 | 161.2 | 7.1 | 86.1 | 5.5 | 170.5 | 6.4 |
| 5 | Akita | 33 | 20.5 | 188.4 | 6.4 | 161.4 | 6.1 | 85.8 | 4.3 | 170.4 | 5.9 |
| 6 | Yamagata | 77 | 21.7 | 187.7 | 7.0 | 162.6 | 5.6 | 86.7 | 4.2 | 169.0 | 5.6 |
| 7 | Fukushima | 47 | 21.1 | 188.1 | 6.1 | 163.3 | 7.1 | 86.9 | 4.4 | 170.1 | 5.9 |
| 8 | Ibaraki | 68 | 20.8 | 187.1 | 7.1 | 162.4 | 6.3 | 86.9 | 4.5 | 169.0 | 5.1 |
| 9 | Tochigi | 59 | 21.1 | 187.7 | 6.3 | 164.2 | 5.7 | 87.6 | 4.4 | 169.4 | 5.8 |
| 10 | Gunma | 59 | 20.6 | 187.2 | 7.0 | 161.7 | 5.0 | 86.5 | 4.3 | 170.2 | 5.5 |
| 11 | Saitama | 54 | 21.5 | 188.3 | 6.7 | 162.6 | 6.4 | 86.4 | 4.2 | 169.5 | 5.3 |
| 12 | Chiba | 46 | 21.1 | 187.2 | 5.8 | 161.9 | 6.4 | 86.6 | 4.6 | 171.1 | 4.8 |
| 13 | Tokyo | 78 | 20.8 | 188.1 | 6.9 | 161.2 | 5.8 | 85.8 | 4.0 | 169.8 | 5.7 |
| 14 | Kanagawa | 75 | 20.6 | 187.7 | 6.6 | 161.3 | 6.1 | 86.0 | 4.2 | 169.2 | 5.6 |
| 15 | Niigata | 78 | 20.9 | 187.5 | 6.6 | 162.5 | 5.7 | 86.8 | 4.6 | 170.9 | 5.6 |
| 16 | Toyama | 48 | 20.7 | 187.3 | 6.8 | 162.5 | 5.0 | 86.9 | 4.0 | 169.9 | 5.7 |
| 17 | Ishikawa | 45 | 21.0 | 186.8 | 6.8 | 163.2 | 6.2 | 87.4 | 4.1 | 169.0 | 5.2 |
| 18 | Fukui | 103 | 20.6 | 186.6 | 6.4 | 162.9 | 5.6 | 87.4 | 4.3 | 170.8 | 5.7 |
| 19 | Yamanashi | 108 | 20.2 | 185.5 | 6.9 | 163.3 | 5.9 | 88.1 | 4.7 | 169.1 | 5.1 |
| 20 | Nagano | 98 | 20.7 | 187.4 | 6.0 | 162.5 | 6.1 | 86.8 | 4.2 | 170.4 | 5.1 |
| 21 | Gifu | 41 | 20.6 | 185.6 | 5.8 | 162.1 | 6.4 | 87.5 | 4.4 | 169.3 | 6.0 |
| 22 | Shizuoka | 93 | 20.5 | 186.3 | 6.5 | 162.0 | 5.7 | 87.0 | 4.3 | 168.5 | 6.0 |
| 23 | Aichi | 78 | 20.9 | 187.7 | 6.0 | 161.2 | 5.7 | 86.0 | 4.3 | 169.9 | 5.0 |
| 24 | Mie | 38 | 20.4 | 187.3 | 6.5 | 160.3 | 6.4 | 85.7 | 4.8 | 168.8 | 5.2 |
| 25 | Shiga | 24 | 20.2 | 186.2 | 6.1 | 161.2 | 6.1 | 86.7 | 4.9 | 169.1 | 4.9 |
| 26 | Kyoto | 33 | 21.1 | 189.3 | 7.3 | 164.0 | 7.0 | 86.8 | 5.5 | 170.7 | 4.5 |
| 27 | Osaka | 76 | 20.4 | 189.1 | 7.1 | 160.7 | 6.3 | 85.1 | 5.1 | 171.1 | 5.3 |
| 28 | Hyogo | 113 | 21.0 | 187.3 | 6.8 | 161.5 | 6.0 | 86.4 | 4.4 | 171.2 | 5.3 |
| 29 | Nara | 32 | 20.3 | 187.0 | 7.6 | 159.1 | 5.3 | 85.3 | 5.1 | 166.5 | 5.5 |
| 30 | Wakayama | 44 | 20.8 | 187.4 | 6.5 | 160.6 | 4.8 | 85.8 | 4.0 | 169.3 | 6.4 |
| 31 | Tottori | 37 | 22.0 | 188.2 | 6.5 | 160.9 | 6.2 | 85.6 | 4.7 | 170.8 | 5.0 |
| 32 | Shimane | 44 | 20.4 | 184.3 | 7.0 | 160.1 | 5.3 | 87.0 | 4.5 | 167.3 | 4.9 |
| 33 | Okayama | 76 | 20.6 | 187.5 | 7.2 | 159.2 | 6.5 | 85.0 | 5.2 | 169.1 | 5.0 |
| 34 | Hiroshima | 362 | 20.2 | 185.6 | 7.6 | 159.2 | 5.8 | 85.9 | 4.7 | 168.3 | 6.0 |
| 35 | Yamaguchi | 52 | 20.5 | 186.9 | 7.7 | 159.7 | 5.7 | 85.6 | 4.7 | 168.3 | 4.9 |
| 36 | Tokushima | 29 | 20.7 | 189.8 | 6.2 | 161.2 | 7.0 | 85.1 | 5.1 | 169.1 | 4.7 |
| 37 | Kagawa | 44 | 20.7 | 186.4 | 7.6 | 160.2 | 5.9 | 86.0 | 4.6 | 168.4 | 4.7 |
| 38 | Ehime | 78 | 20.8 | 186.7 | 7.1 | 159.8 | 5.8 | 85.7 | 4.5 | 167.8 | 5.6 |
| 39 | Kochi | 24 | 21.6 | 188.8 | 6.3 | 161.8 | 5.7 | 85.8 | 4.2 | 169.8 | 5.2 |
| 40 | Fukuoka | 42 | 21.2 | 187.2 | 5.6 | 162.1 | 7.4 | 86.6 | 4.3 | 169.0 | 6.8 |
| 41 | Saga | 10 | 20.8 | 190.3 | 6.7 | 161.7 | 4.8 | 85.1 | 4.1 | 169.6 | 5.2 |
| 42 | Nagasaki | 20 | 21.5 | 188.4 | 7.7 | 159.4 | 5.8 | 84.7 | 4.5 | 168.4 | 4.9 |
| 43 | Kumamoto | 19 | 21.7 | 187.8 | 6.0 | 161.4 | 6.2 | 86.0 | 4.2 | 169.1 | 5.4 |
| 44 | Oita | 20 | 21.8 | 187.0 | 6.1 | 161.2 | 5.2 | 86.3 | 4.4 | 168.8 | 4.2 |
| 45 | Miyazaki | 31 | 20.8 | 186.3 | 7.7 | 161.3 | 4.4 | 86.7 | 4.2 | 167.9 | 5.5 |
| 46 | Kagoshima | 92 | 21.8 | 187.6 | 7.0 | 161.0 | 6.1 | 85.9 | 4.3 | 169.5 | 5.6 |
| 47 | Okinawa | 7 | 22.1 | 186.1 | 4.4 | 163.3 | 8.1 | 87.8 | 5.2 | 169 | 3.4 |
| Mean | 187.5 | 161.5 | 86.3 | ||||||||
| SD | 1.2 | 1.2 | 0.8 |
The author thanks all participants in our anthropometric surveys, professors, colleagues, and friends who helped in recruiting participants, and her coworkers who conducted anthropometric surveys.