Original Articles
Computed tomography examinations of the surface and internal morphologies of the upper face in Ryukyu Islanders and mainland Japanese population
2018 年 126 巻 3 号 p. 123-133

詳細
2018 年 126 巻 3 号 p. 123-133
Using computed tomography, we examined the surface and internal morphologies of the upper face of people living on the Ryukyu Islands and mainland Japanese, focusing on the nasal root protrusion and eyeball position. The results showed that the nasal root protrusion on the surface was influenced by a combination of changes in both hard and soft tissues, such as skeletal nasal protrusion, eyeball recession, and skin thickness. The eyeball position became more posterior as the orbital cavity height and depth increased. Compared with people originating from mainland Japan, Ryukyu Islanders had a more prominent nasal root at both surface and skeletal levels, and a lower orbital rim relative to its internal height. However, a significant difference in the eyeball position and skin thickness was not detected. Therefore, the skeletal nasal root protrusion, not soft tissue configuration, is likely to account for the difference in the surface nasal root protrusion between the two populations. These findings will contribute to a better understanding of the association between hard and soft tissue configurations and the diversification of human facial features at the individual and population levels.
Human facial morphology has attracted much interest due to its importance in adaptation to local environments as well as in social communication among individuals. The face comprises several sensory organs and the masticatory apparatus; therefore, facial morphology reflects the combination and integration of physiological and functional adaptations. Facial morphology also provides significant visual cues about an individual’s personality, which can affect mate choice. Many scholars have attempted to explain the evolutionary significance of intra- and inter-population variations of facial morphologies, but this topic is still the subject of vigorous debate (Harvati and Weaver, 2006; Roseman and Weaver, 2007; Weston et al., 2007; Hubbe et al., 2009; von Cramon-Taubadel and Weaver, 2009; Guo et al., 2014).
One of the most marked facial characteristics is evident on the surface configuration of the upper face. Particularly important features that contribute to the impression of an individual’s face include the projection of the nasal root and brow ridge and recession of the eyes. Such characteristics also vary among populations. For example, the upper face of Europeans is more chiseled than that of the East Asians, with more protruded nasal roots and brow ridges and more concaved eye regions (Guo et al., 2014; Watanabe et al., 2014). The upper facial morphology is also significantly different among local populations in the same continent and region (Miyazato et al., 2014).
In shaping the upper face, eyeball position is considered to be an important characteristic (Stephan et al., 2009). For this reason, particularly in the field of forensic science, some efforts have been taken to reveal the factors that determine the eyeball position (Stephan et al., 2009; Guyomarc’h et al., 2014; Kim et al., 2016). In a survey of computed tomography (CT) data from French hospitals, Guyomarc’h et al. (2014) found that individuals with more projected eyeballs had a higher orbit. Kim et al. (2016) investigated CT data and showed that, in Koreans, more posteriorly positioned lateral orbital rims resulted in more projected eyeballs. These facts suggest that the orbital morphology could affect the relative eyeball position and consequently predict the surface configuration of the upper face. However, little is known about how and to what extent these anatomical regions/levels interact with each other.
Using CT images, the present study aimed to reveal the anatomical backgrounds of the upper facial variations, particularly focusing on the nasal root protrusion and the eyeball position. In this context, Ryukyu Islanders and mainland Japanese are appropriate subjects, because there are significant variations in facial morphologies (Fukase et al., 2012; Miyazato et al., 2014; Yamauchi et al., 2016). For example, the people originating from Okinawa Island (one of the Ryukyu Islands in Japan) have a more chiseled face than those originating from mainland Japan (Miyazato et al., 2014). Ryukyu Islanders have limited admixture with Yayoi people, who migrated from the continental mainland to the Japanese archipelago as the Jomon period finished (Hanihara, 1991; Omoto and Saitou, 1997; Yamaguchi-Kabata et al., 2008; Sato et al., 2014). This results in the persistence of Jomon-like features in living Ryukyu Islanders, who are significantly differentiated from mainland Japanese in terms of some morphological characters, although marked morphological differences between Ryukyu Islanders and Jomon people were also reported (Hanihara, 1991; Dodo et al., 1998, 2000; Fukumine et al., 2006; Fukase et al., 2012). Thus, our study targeting Ryukyu Islanders, in comparison to mainland Japanese, will contribute to our further understanding of human facial diversification among local populations.
In particular, the present study analyzed CT data to clarify the following two points. First, we evaluate the interactions among different anatomical regions/levels of hard and soft tissues (i.e. eyeball position/size, skin surface, thickness, and skeletons). In this way we aim to evaluate the intrapopulation covariation pattern that is assumed to be common to local populations of humans. Second, we evaluate the difference in each of these hard- and soft-tissue morphologies between Ryukyu Islanders and the mainland Japanese population. Based on these analyses, we discuss how the diversity in the nasal root protrusion of the surface was formed during human population differentiation.
This study used CT images of 137 individuals who were scanned for clinical purposes at the University Hospital, University of the Ryukyus, Japan, of which 115 individuals (35 females and 80 males) belonged to the Ryukyu Islands and 22 (8 females and 14 males) to mainland Japan. Individuals with anomalies or apparent operation scars on the facial cranium were excluded. The population of individuals was defined as the reported birthplace of both maternal and paternal grandparents. Most grandparents of Ryukyu Islanders belonged to Okinawa Honto, but some belonged to the islands of Kume-jima, Sakishima, and Amami. The age (years), sex, body weight (kg), and height (cm) of the participants were either acquired from medical records or self-reported. Body mass index (BMI) was calculated from body weight and height measurements. Our sample consisted of individuals aged 24–86 years, with no significant age bias between the two populations (Welch’s t-test: P = 0.189). This study was approved by the Ethics Committee of University of the Ryukyus, and informed consent was obtained from all the participants.
CT was performed using either one of two scanners (Aquilion ONE, Toshiba Medical Systems Co. Ltd, Otawara, Japan; LightSpeed VCT, GE Medical Systems, LCC, Waukesha, USA). The scans were performed using a tube voltage of 120 kV, slice thickness of 0.50–1.25 mm, and a pixel size of 0.39–0.82 mm.
MeasurementsImage processing and landmarking were performed using Amira v. 5.5 software (FEI Visualization Sciences Group, Bordeaux, France). The resolution of images among individuals was homogenized by resampling image sequences to be cubic with a voxel size of 0.3 mm3. The orientation of each CT image was manually adjusted based on the Frankfurt and midsagittal planes, which was visually judged. Subsequently, the coordinates of three-dimensional (3D) landmarks were obtained on the two-dimensional (2D) resliced images or 3D reconstructed images (Appendix 1; Figure 1).

Illustrations of landmarks and measurements used in this study. Visible landmarks are denoted by filled circles and hidden ones by open circles. (A) Left lateral (left) and frontal views (right) of facial surface. Landmarks and measurements on the facial surface as well as facial reference plane (fRP) are illustrated. (B) Left lateral (left) and frontal views (right) of upper facial cranium with the eyeball. Landmarks on the eyeball are illustrated. A cross denotes the center of an eyeball. (C) Left lateral view of upper facial cranium with frontal facial surface. Landmarks and measurements on the facial surface and cranium are illustrated. (D) Left lateral (left) and frontal views (right) of facial cranium. Landmarks and measurements on orbit are illustrated. (E) Left lateral (left) and frontal views (right) of upper facial cranium. Landmarks and measurements regarding skeletal facial flatness and cranial nasal angle are illustrated.
The left–right orientation of landmark configurations was further adjusted based on the plane passing through the midsagittal landmarks and the midpoints of bilateral landmarks. Then, the superoinferior orientation was adjusted based on the plane passing through the optic canals and the midpoints of the four landmarks on each orbital rim. Based on the orientation-adjusted coordinates, 21 morphological variables (16 linear distances, 4 ratios, and 1 angle) were calculated (Table 1; Figure 1). Note that the definition of orbital height (OH) was different from the traditional one (Table 1), because it is easy to take measurements on digital images and this is expected to achieve better repeatability. These calculations were performed using a custom script written in R software (R Core Team, 2018).
| Region/level | Abbreviation | Unit | Measurements |
|---|---|---|---|
| Eyeball | EH1 | mm | Eyeball height: vertical distance between Es and Ei |
| EW1 | mm | Eyeball width: horizontal distance between Em and El | |
| EL1 | mm | Eyeball length: anteroposterior distance between Ea and Ep | |
| ES1 | mm | Eyeball size: geometric mean of EH, EW, and EL | |
| ER1 | mm | Eyeball recession: anteroposterior distance between the center of eyeball2 and the midpoint of Mf and Fmo | |
| ERI | ratio | Eyeball recession index: ratio of ER to OD | |
| Skin surface | NRP | mm | Nasal root projection: perpendicular distance from Se to the facial reference plane3 |
| GP | mm | Glabella projection: perpendicular distance from Gs to the facial reference plane3 | |
| Skin thickness | NRT | mm | Soft tissue thickness at nasal root: anteroposterior distance between Se and Ns |
| GT | mm | Soft tissue thickness at glabella: anteroposterior distance between Gs and Gc | |
| Skeleton | OD1 | mm | Orbital depth: anteroposterior distance between Mf and Oc |
| OH1 | mm | Orbital rim height: vertical distance between Ors and Ori | |
| OW1 | mm | Orbital rim width: horizontal distance between Mf and Fmo | |
| IOH1 | mm | Internal orbital height: vertical distance between Orr and Orf | |
| ORR1 | mm | Orbital rim recession: anteroposterior distance between Mf and Fmo | |
| OI1 | ratio | Orbital index: ratio of OH to OW | |
| IOI1 | ratio | Internal orbital index: ratio of OH to IOH. | |
| FC | mm | Frontal chord: distance between left Fmo and right Fmo | |
| FS | mm | Frontal subtense: perpendicular distance from Ns to FC | |
| FI | ratio | Frontal index: ratio of FS to FC | |
| CNA | angle | Cranial nasal angle: angle between the vector from Ns to Gc and the vector from Ns to Rhi |
To evaluate measurement error and reduce its effects, the measurements were taken twice by a single observer (T.I.). The reproducibility of the duplicate measurements was evaluated as an intraclass correlation coefficient (ICC) using the ‘psy’ package (Falissard, 2011) in R, where no time trends were assumed (Shrout and Fleiss, 1979). The ICC was high for all measurements (Appendix 2), indicating a good repeatability, but the effects of measurement errors should be kept in mind when interpreting results. Measurement error causes a risk of Type II error (i.e. too conservative) when testing univariate response variables, because it will overestimate among-individual (within-group) variance by incorporating measurement error variance (Bailey and Byrnes, 1990). Correlations between pairs of variables are also affected by the measurement error of each variable, and this is remarkable particularly when measurement errors are correlated with each other between pairs of variables, e.g. by sharing same landmark. To reduce such erroneous factors, we removed unreliable measurement values, i.e. the measurement values that marked large differences (i.e. exceeded the standard deviation of this variable) between the duplicated measures. Eleven measurement values (in 9 individuals and 7 variables) fell under this category and were treated as missing. We further halved measurement error variance by averaging the duplicate measurements, and they were used for the following analyses. Missing values were eliminated from the analyses that required those values.
StatisticsFirst, correlations between all the pairs of variables were calculated to capture the morphological interaction patterns among different anatomical regions/levels (i.e. eyeball, skin surface, thickness, and skeleton). To control the effects of exogenous factors (population, sex, age, height, and BMI), partial correlations were calculated using the ‘ppcor’ package (Kim, 2015) in R. Nasal root projection (NRP) was further tested using multiple regression; we evaluated which anatomical factors contribute to the intrapopulation variation of this feature. Eyeball size (ES), recession (ER), soft tissue thickness at nasal root (NRT), and frontal subtense (FS) were used as explanatory variables that potentially anatomically influence NRP. BMI was also included as the covariate explanatory variable. This was done separately for Ryukyu Islanders and mainland Japanese to take population structure into account. By comparing the results, we tested the assumption that the intrapopulation covariation pattern was common to the two populations. We also performed this for the total sample but included population as an explanatory variable. Second, to evaluate the population difference of each morphological trait, multiple regression analyses were performed, wherein population and other covariates (sex, age, height, and BMI) were used as explanatory variables. For these statistical analyses, population and sex were coded as dummy variables, i.e. mainland Japanese as 0 and Ryukyu Islander as 1, and male as 0 and female as 1. All statistical analyses were performed using R software.
Correlation and partial correlation matrices showed morphological interactions among different anatomical regions/levels (i.e. eyeball, skin surface, thickness, and skeleton) (Table 2). Eyeball dimensions positively correlated with orbital cavity dimensions [orbital depth (OD) and internal orbital height (IOH)] but not with orbital rim morphology [OH, width (OW), and orbital rim recession (ORR)]. ER positively correlated with NRP and glabella projection (GP) and with some orbital cavity dimensions (OD and IOH). ES and ER showed a positive correlation. Furthermore, the eyeball recession index (ERI) had a negative correlation with internal orbital index (IOI) (Figure 2). Other than the eyeballs, the surface morphology of the upper face, represented by NRP and GP, showed a significant positive correlation with OD and frontal chord (FC) and a significant negative correlation with cranial nasal angle (CNA). NRP was also correlated positively with NRT, ORR, FS, and frontal index (FI). GP was also correlated negatively with IOH and orbital index (OI). The skin thickness [NRT and soft tissue thickness at glabella (GT)] were negatively correlated with CNA. GT was also correlated negatively with OH.
| Eyeball | Skin surface | Skin thickness | Skeleton | ||||||||||||||||||
|---|---|---|---|---|---|---|---|---|---|---|---|---|---|---|---|---|---|---|---|---|---|
| EH | EW | EL | ES | ER | ERI | NRP | GP | NRT | GT | OD | OH | OW | ORR | IOH | OI | IOI | FC | FS | FI | CNA | |
| EH | 0.71** | 0.79** | 0.91** | 0.12 | 0.12 | −0.02 | 0.04 | 0.03 | 0.05 | 0.18* | 0.13 | 0.19* | 0.06 | 0.24** | −0.02 | −0.11 | 0.16 | 0.10 | 0.07 | 0.01 | |
| EW | 0.68** | 0.79** | 0.90** | 0.17 | 0.16 | 0.04 | 0.07 | 0.01 | 0.02 | 0.34** | 0.10 | 0.15 | 0.07 | 0.23** | −0.02 | −0.13 | 0.13 | 0.10 | 0.08 | −0.07 | |
| EL | 0.76** | 0.78** | 0.94** | 0.22* | 0.22* | −0.02 | 0.01 | 0.02 | 0.02 | 0.24** | 0.07 | 0.10 | −0.09 | 0.21* | 0.00 | −0.14 | 0.04 | −0.06 | −0.08 | 0.00 | |
| ES | 0.89** | 0.90** | 0.94** | 0.18* | 0.18* | 0.00 | 0.04 | 0.02 | 0.03 | 0.27** | 0.11 | 0.16 | 0.01 | 0.25** | −0.01 | −0.14 | 0.12 | 0.05 | 0.02 | −0.02 | |
| ER | 0.20* | 0.19* | 0.26** | 0.24** | 1.00** | 0.44** | 0.34** | −0.30** | −0.34** | 0.33** | −0.09 | −0.03 | 0.03 | 0.11 | −0.06 | −0.24** | −0.20* | −0.08 | −0.02 | 0.11 | |
| ERI | 0.20* | 0.18* | 0.26** | 0.24** | 1.00** | 0.44** | 0.33** | −0.29** | −0.33** | 0.30** | −0.1 | −0.04 | 0.03 | 0.10 | −0.06 | −0.24** | −0.21* | −0.08 | −0.02 | 0.11 | |
| NRP | −0.14 | −0.12 | −0.13 | −0.14 | 0.41** | 0.41** | 0.74** | 0.29** | 0.02 | 0.32** | −0.1 | 0.23** | 0.39** | 0.02 | −0.25** | −0.15 | 0.22* | 0.46** | 0.45** | −0.26** | |
| GP | −0.11 | −0.09 | −0.12 | −0.12 | 0.35** | 0.35** | 0.70** | 0.04 | 0.10 | 0.32** | −0.27** | 0.28** | 0.17 | −0.18* | −0.44** | −0.15 | 0.29** | 0.23** | 0.16 | −0.43** | |
| NRT | −0.05 | −0.06 | −0.03 | −0.05 | −0.17 | −0.16 | 0.35** | 0.01 | 0.56** | −0.05 | −0.1 | 0.02 | 0.03 | −0.06 | −0.11 | −0.06 | 0.05 | 0.06 | 0.05 | −0.49** | |
| GT | −0.04 | −0.01 | −0.01 | −0.02 | −0.16 | −0.14 | 0.10 | 0.15 | 0.50** | −0.07 | −0.11 | 0.01 | 0.07 | −0.05 | −0.1 | −0.08 | 0.03 | 0.10 | 0.11 | −0.20* | |
| OD | 0.16 | 0.31** | 0.21* | 0.25** | 0.35** | 0.33** | 0.26** | 0.26** | −0.07 | −0.06 | 0.05 | 0.25** | 0.36** | 0.17 | −0.13 | −0.13 | 0.20* | 0.27** | 0.24** | −0.07 | |
| OH | 0.11 | 0.12 | 0.05 | 0.10 | −0.02 | −0.03 | −0.06 | −0.29** | −0.15 | −0.20* | 0.04 | 0.23** | 0.22* | 0.65** | 0.73** | 0.52** | 0.23** | 0.18* | 0.12 | 0.23** | |
| OW | 0.03 | 0.01 | −0.04 | 0.00 | 0.05 | 0.04 | 0.16 | 0.17 | −0.1 | −0.1 | 0.18* | 0.20* | 0.42** | 0.24** | −0.49** | 0.01 | 0.85** | 0.43** | 0.19* | −0.25** | |
| ORR | −0.05 | −0.01 | −0.18* | −0.09 | 0.03 | 0.03 | 0.38** | 0.13 | 0.00 | 0.03 | 0.35** | 0.23* | 0.43** | 0.25** | −0.09 | 0.00 | 0.44** | 0.89** | 0.86** | 0.11 | |
| IOH | 0.20* | 0.18* | 0.16 | 0.20* | 0.18* | 0.17 | −0.05 | −0.27** | −0.13 | −0.12 | 0.13 | 0.68** | 0.18 | 0.19* | 0.42** | −0.31** | 0.22* | 0.26** | 0.22* | 0.14 | |
| OI | 0.07 | 0.10 | 0.07 | 0.09 | −0.05 | −0.05 | −0.16 | −0.37** | −0.08 | −0.11 | −0.08 | 0.78** | −0.46** | −0.07 | 0.50** | 0.45** | −0.39** | −0.14 | −0.03 | 0.38** | |
| IOI | −0.1 | −0.05 | −0.12 | −0.1 | −0.24** | −0.23** | −0.03 | −0.06 | −0.05 | −0.12 | −0.09 | 0.51** | 0.05 | 0.07 | −0.29** | 0.42** | 0.04 | −0.07 | −0.1 | 0.13 | |
| FC | 0.03 | 0.01 | −0.08 | −0.02 | −0.07 | −0.08 | 0.19* | 0.21* | −0.13 | −0.15 | 0.15 | 0.19* | 0.82** | 0.48** | 0.14 | −0.35** | 0.08 | 0.53** | 0.26** | −0.22* | |
| FS | −0.02 | −0.02 | −0.17 | −0.09 | −0.04 | −0.05 | 0.43** | 0.14 | −0.03 | 0.02 | 0.23* | 0.19* | 0.37** | 0.90** | 0.18* | −0.07 | 0.02 | 0.50** | 0.96** | 0.05 | |
| FI | −0.03 | −0.02 | −0.17 | −0.08 | −0.02 | −0.03 | 0.42** | 0.10 | 0.01 | 0.08 | 0.22* | 0.15 | 0.15 | 0.86** | 0.16 | 0.04 | 0.00 | 0.24** | 0.96** | 0.13 | |
| CNA | 0.10 | 0.03 | 0.08 | 0.08 | 0.03 | 0.03 | −0.23* | −0.37** | −0.47** | −0.18* | 0.01 | 0.31** | −0.07 | 0.11 | 0.23* | 0.33** | 0.14 | 0.00 | 0.17 | 0.18* | |
The third variables for partial correlation are population, sex, age, height, and BMI. Population and sex are coded as dummy variables (mainland Japanese as 0 and Ryukyu Islanders as 1, male as 0 and female as 1).
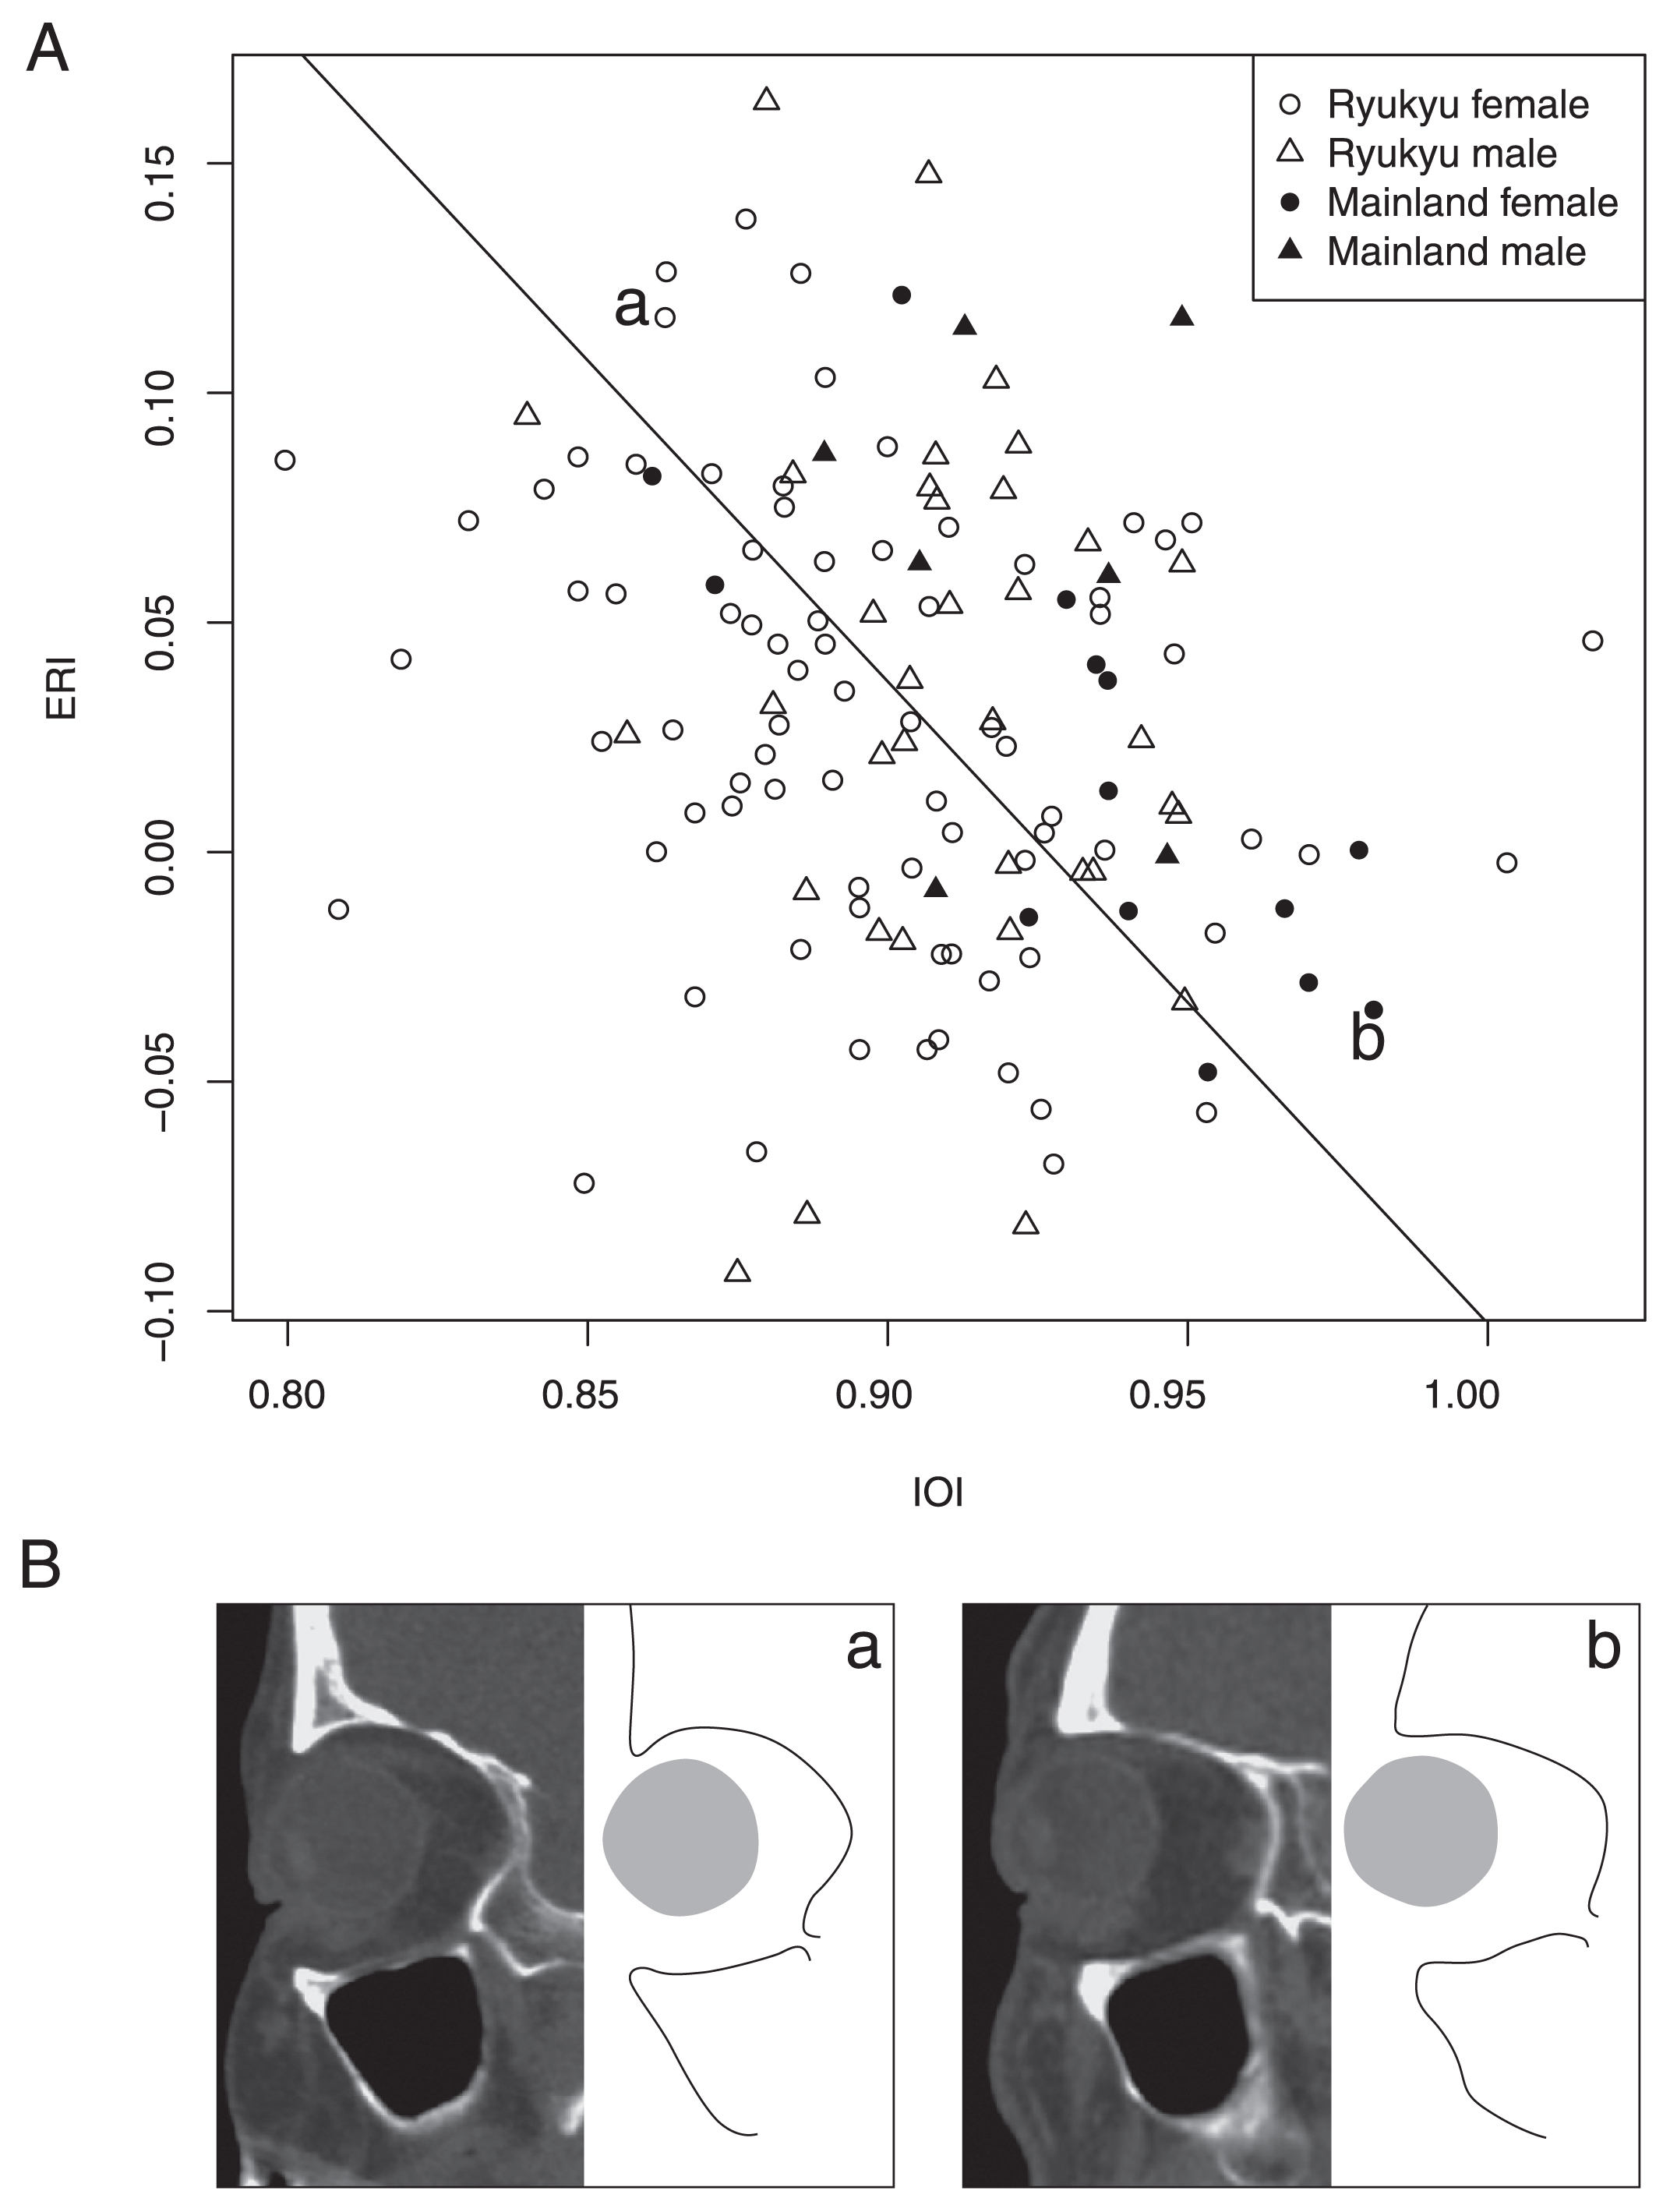
(A) Relationship between eyeball recession index (ERI) and internal orbital index (IOI). Solid line indicates the reduced major axis regression line. (B) The sagittal section of upper face at the three-fifths level from Fmo (Frontomalare orbitale) to Mf (Maxillofrontale) is displayed (original image, left; corresponding line schema, right).
NRP was further tested by multiple regression analysis, considering the effects of other covariates. The results were similar between Ryukyu Islanders and mainland Japanese (Table 3). Among the explanatory factors, ER was consistently the strongest predictor for NRP. ER, NRT, FS, and population positively influenced NRP, whereas ES was negatively associated with NRP. In the test of the total sample, a significant effect of population on NRP still remained.
| (Intercept) | ES | ER | NRT | FS | BMI | Population | |
|---|---|---|---|---|---|---|---|
| Ryukyu Islanders (adjusted R2 = 0.63, P < 2.2E–16) | |||||||
| B | 2.653 | −0.234 | 0.556 | 0.762 | 0.514 | −0.0869 | |
| β | −3.E-16 | −0.094 | 0.571 | 0.432 | 0.471 | −0.1431 | |
| P-value | 0.496 | 0.111 | 2.2E-13 | 6.7E-11 | 4.E-13 | 0.03041 | |
| Mainland Japanese (adjusted R2 = 0.69, P = 2.4E–04) | |||||||
| B | 22.289 | −1.000 | 0.508 | 0.657 | 0.403 | −0.030 | |
| β | −0.027 | −0.519 | 0.677 | 0.509 | 0.342 | −0.069 | |
| P-value | 0.004 | 1.5E-03 | 4.8E-03 | 0.003 | 0.023 | 0.746 | |
| Total sample (adjusted R2 = 0.64, P < 2.2E–16) | |||||||
| B | 4.891 | −0.349 | 0.546 | 0.766 | 0.503 | −0.082 | 0.741 |
| β | −2.E-03 | −0.141 | 0.565 | 0.445 | 0.461 | −0.140 | 0.117 |
| P-value | 0.154 | 0.008 | 4.8E-15 | 2.6E-13 | 2.E-14 | 0.025 | 0.037 |
Population and sex are coded as dummy variables (mainland Japanese as 0 and Ryukyu Islanders as 1, male as 0 and female as 1).
B, partial regression coefficient; β, standardized partial regression coefficient.
Significance (P < 0.05) is indicated in bold.
Multiple regression analyses revealed that some measurements were significantly associated with population (Ryukyu Islands or mainland Japan), sex, age, or physical constitution (height and BMI) (Table 4; Appendix 3). Compared with mainland Japanese, Ryukyu Islanders showed a significantly larger average NRP, ORR, IOI, FS, and FI. However, internal soft tissues, i.e. eyeball dimensions [eyeball height (EH), width (EW), length (EL), and ES], ER, and NRT, and the other skeletal measures, were not significantly different between the two populations. Eyeball dimensions were rather explained by age, decreasing with aging. ER and NRT were associated positively and negatively with BMI, respectively.
| Intercept | Population | Sex | Age (year) | Height (cm) | BMI | |||||||||||
|---|---|---|---|---|---|---|---|---|---|---|---|---|---|---|---|---|
| B | B | β | P-value | B | β | P-value | B | β | P-value | B | β | P-value | B | β | P-value | |
| EH | 25.15 | 0.02 | 0.01 | 0.91 | −0.26 | −0.11 | 0.32 | −0.05 | −0.51 | 1.2E-08 | 0.02 | 0.13 | 0.22 | 0.02 | 0.06 | 0.40 |
| EW | 26.22 | 0.43 | 0.16 | 0.05 | −0.40 | −0.19 | 0.12 | −0.03 | −0.30 | 1.0E-03 | 0.01 | 0.06 | 0.58 | −0.02 | −0.09 | 0.30 |
| EL | 23.32 | 0.04 | 0.01 | 0.88 | −0.16 | −0.07 | 0.57 | −0.03 | −0.31 | 9.8E-04 | 0.02 | 0.15 | 0.22 | −0.01 | −0.02 | 0.79 |
| ES | 24.94 | 0.16 | 0.06 | 0.43 | −0.28 | −0.14 | 0.24 | −0.03 | −0.40 | 9.3E-06 | 0.02 | 0.13 | 0.27 | −4.5E-03 | −0.02 | 0.82 |
| ER | 8.44 | 0.30 | 0.05 | 0.55 | 0.91 | 0.18 | 0.11 | −0.01 | −0.06 | 0.50 | 0.01 | 0.02 | 0.86 | −0.34 | −0.55 | 1.6E-11 |
| ERI | 0.19 | 0.01 | 0.04 | 0.55 | 0.02 | 0.17 | 0.11 | −2.8E-04 | −0.06 | 0.47 | 6.1E-05 | 0.01 | 0.93 | −0.01 | −0.56 | 9.7E-12 |
| NRP | 6.14 | 1.60 | 0.25 | 2.0E-03 | −0.67 | −0.13 | 0.26 | −0.02 | −0.10 | 0.26 | 0.04 | 0.13 | 0.24 | −0.18 | −0.30 | 2.3E-04 |
| GP | 15.26 | 1.03 | 0.12 | 0.13 | −1.96 | −0.29 | 0.01 | −0.05 | −0.19 | 0.03 | 0.02 | 0.06 | 0.59 | −0.14 | −0.18 | 0.03 |
| NRT | 4.78 | 0.26 | 0.07 | 0.40 | −0.77 | −0.26 | 0.03 | −0.01 | −0.06 | 0.53 | 8.1E-04 | 0.00 | 0.97 | 0.08 | 0.22 | 0.01 |
| GT | 0.66 | 0.10 | 0.03 | 0.67 | −0.21 | −0.09 | 0.44 | −1.3E-03 | −0.01 | 0.88 | 0.02 | 0.14 | 0.24 | 0.11 | 0.40 | 3.0E-06 |
| OD | 36.91 | 0.22 | 0.04 | 0.67 | −0.03 | −0.01 | 0.96 | −1.2E-05 | −5.8E-05 | 1.00 | 0.07 | 0.23 | 0.06 | −0.05 | −0.10 | 0.27 |
| OH | 27.41 | −0.66 | −0.13 | 0.13 | 0.27 | 0.07 | 0.58 | −2.3E-03 | −0.01 | 0.89 | 0.04 | 0.18 | 0.14 | 0.06 | 0.14 | 0.12 |
| OW | 30.68 | −0.14 | −0.03 | 0.68 | −0.77 | −0.22 | 0.06 | −0.02 | −0.17 | 0.05 | 0.07 | 0.31 | 0.01 | 0.05 | 0.11 | 0.16 |
| ORR | 0.85 | 1.05 | 0.20 | 0.02 | 0.64 | 0.15 | 0.23 | −0.02 | −0.10 | 0.28 | 0.06 | 0.23 | 0.06 | 0.01 | 0.01 | 0.89 |
| IOH | 28.33 | 0.52 | 0.10 | 0.23 | 0.14 | 0.03 | 0.78 | −7.1E-04 | −4.3E-03 | 0.96 | 0.06 | 0.25 | 0.04 | 0.03 | 0.07 | 0.41 |
| OI | 0.89 | −0.01 | −0.09 | 0.27 | 0.02 | 0.22 | 0.09 | 4.7E-04 | 0.10 | 0.27 | −3.8E-04 | −0.06 | 0.63 | 4.7E-04 | 3.8E-02 | 0.66 |
| IOI | 0.96 | −0.03 | −0.31 | 4.3E-04 | 0.00 | 0.04 | 0.73 | −8.8E-05 | −0.03 | 0.78 | −3.0E-04 | −0.06 | 0.60 | 8.9E-04 | 0.10 | 0.26 |
| FC | 71.44 | −0.18 | −0.02 | 0.82 | −2.52 | −0.30 | 0.01 | −0.03 | −0.08 | 0.31 | 0.15 | 0.29 | 0.01 | 0.23 | 0.24 | 2.0E-03 |
| FS | 6.60 | 1.30 | 0.22 | 0.01 | −0.35 | −0.08 | 0.54 | −0.02 | −0.12 | 0.19 | 0.06 | 0.20 | 0.09 | 0.04 | 0.07 | 0.43 |
| FI | 0.11 | 0.01 | 0.25 | 4.2E-03 | 6.6E-04 | 0.02 | 0.90 | −1.8E-04 | −0.10 | 0.28 | 3.4E-04 | 0.14 | 0.26 | 4.4E-06 | 9.1E-04 | 0.99 |
| CNA | 134.15 | 1.56 | 0.07 | 0.34 | 8.67 | 0.52 | 1.3E-05 | 0.05 | 0.07 | 0.44 | −0.01 | −0.01 | 0.92 | −0.05 | −0.03 | 0.73 |
See Table 3 for legends.
Correlations between the measurements showed morphological interactions among different anatomical regions/levels, indicating that eyeball size and position have considerable interactions with surrounding traits. In terms of size, larger eyeballs are associated with relatively higher (IOH) and deeper orbital cavities (OD). In terms of position, more posteriorly positioned eyeballs are associated with more projected nasal roots (NRP) and supraorbital ridges on the surface (GP), and relatively higher (IOH and IOI) and deeper orbital cavities (OD) with respect to the openings. Although the causal relationship is unknown, these findings imply that the anteroposterior position of the eyeballs is to some extent determined by the orbital cavity dimensions, and affects the degree of nasal root and supraorbital projection.
Other than the eyeballs, a more projected nasal root on the surface is associated with thicker skin at the nasal root (NRT), more projected nasal roots at the skeleton (FS and FI), more concaved nasal profiles (CNA), more recessed orbital rims (ORR), and deeper orbital cavities (OD). A more projected supraorbital ridge (GP) is also associated with more projected nasal roots at the skeleton, more concaved nasal profiles, and deeper orbital cavities, and is specifically associated with lower orbital cavities (IOH) and lower orbital rims relative to the orbital width (OI). Thicker skin at both nasal root and supraorbital ridge are associated with more concaved nasal profiles. Thicker skin at the supraorbital ridge is also associated with lower orbital rims. Thus, every pair of the different anatomical regions/levels interact considerably with each other.
Nasal root protrusion at the surface is further evaluated to consider complex covariation patterns among different anatomical regions/levels. When testing the total sample, the significant effect of population still remains, suggesting the existence of unknown factors that cause the difference in the average of nasal root protrusion between the two populations. The major patterns of interaction between the nasal root protrusion of the surface and the underlying anatomical factors are almost same for the two populations. In both populations, eyeball recession is the strongest predictor for the degree of nasal root protrusion on the surface. More prominent nasal root of the surface is associated with more recessed eyeballs, decreasing eyeball size, thicker soft tissue at the nasal root, and a more prominent skeletal nasal root. What should be emphasized here is that both soft and hard tissues contribute to the intrapopulation variation in the nasal root protrusion of the surface and that such a covariation pattern is likely common to the two populations.
Population differences between Ryukyu Islands and mainland JapanWe found that, at both surface and skeletal levels, Ryukyu Islanders had a more protruded nasal root, i.e. lesser flatness of the upper face, than that of the mainland Japanese. The finding at the surface level (NRP) is in accordance with a previous study (Miyazato et al., 2014), which analyzed the 3D surface models of modern human faces. The finding at the skeletal level (FS and FI) is, however, confounded by conflicting reports; Dodo et al. (2000) argued that the early-modern Ryukyu Islanders (Sakishima, Amami, and Okinawa Islands, including Kume-jima) had a flatter upper face (smaller FI) than that of the mainland Japanese. Also, Fukumine et al. (2001) reported that early-modern Okinawa Islanders (Yacchi-no-Gama and Kanjinbaru in Kume-jima; c. late 17th century–mid-20th century) have a flatter face than that of the mainland Japanese. It should be noted that these studies investigated samples from an early-modern period, while the present study used modern individuals. We speculate that the discrepancy may be due to a temporal reduction of nasal root prominence in Ryukyu Islanders around the early-modern period. In fact, Kouchi and Mochimaru (2006) showed that nasal root prominence has significantly changed in the past 80 years. Kawakubo (2007) also reported considerable temporal changes of upper facial flatness (FI) from Jomon to Yayoi–Kofun periods and from medieval to recent periods. These findings suggested that skeletal facial forms may be more liable to change than previously thought, considerably influenced by changes of subsistence. The chiseled upper face in modern Ryukyu Islanders, at least at the skeletal level, could have been formed during the past hundred years or so.
The other traits including both soft and hard tissues, except for the orbital rim recession (ORR) and the orbital rim height relative to its cavity height (IOI), are not significantly different between the two populations. Eyeball dimensions (EH, EW, EL, and ES) and recession (ER) are rather influenced by BMI and age. The negative correlation between BMI and eyeball recession suggests high plasticity of the relative eyeball position, which can be greatly affected by the amount of adipose behind eyeballs. With regard to the negative association of age with eyeball dimensions, our findings agree with a previous study that reported a decreasing axial diameter of eyeballs with aging (Leighton and Tomlinson, 1972), although another study found no statistical difference in eyeball diameters among different age categories (Bekerman et al., 2014). Thus, the variations in internal soft tissues (including eyeball dimension and position), orbital dimensions (OD, OH, OW, IOH, and OI), and skeletal nasal profile (CNA) are likely caused by the factors other than population differentiation.
Insights into the evolutionary process of nasal root protrusionOur findings in this study will shed light on understanding the factors that determine the population differences in the nasal root protrusion on the surface. The present study showed that the surface nasal root is more prominent in Ryukyu Islanders than in mainland Japanese. We further demonstrated that the surface nasal root protrusion is associated with soft tissue thickness at nasal root, eyeball size and recession, and skeletal nasal root protrusion and profile. However, of these, only skeletal nasal root protrusion was significantly different between the Ryukyu Islanders and mainland Japanese. No population difference was detected in eyeball position/size and skin thickness. This suggests that, assuming that the intrapopulation covariation pattern of morphological traits is similar between the two populations, the anatomical factor contributing to the population differences in surface nasal root protrusion is the difference in skeletal nasal root protrusion.
Taking this argument a step further, it can be suggested that the driving force responsible for the population differences in surface nasal root protrusion does not influence eyeball position/size and skin thickness; it acts on the surface topography itself or the skeletal shape. Although our data could not specify this driving force, it can be further evaluated using genotype–phenotype association studies and population genomics. Previous studies found that nasion position, which is similar to NRP, is significantly associated with a variant in the Paired Box 3 (PAX3) gene in Europeans (Paternoster et al., 2012) and Latin Americans (Adhikari et al., 2016). In addition, a significant association between the PAX3 variant and the distance from the center of the eyeball to the nasion was found in Europeans (Liu et al., 2012). Rare variants in PAX3 are known to cause Waardenburg syndrome, which results in a broad and high nasal root (Read and Newton, 1997), although their effects on the relative position and size of eyeballs are unknown. The same genetic variants might be responsible for the variation in the upper facial morphology in the Ryukyu Islanders and mainland Japanese, but genetic variants underlying this trait could be different among populations (e.g. Cole et al., 2016). If such a genetic variant were detected, population genomics could be applied to estimate its evolutionary process, and thus genome-wide association studies of normal facial variations in Asians, including both soft and hard tissues (organs), are required.
This CT-based study revealed the following: (1) Nasal root protrusion of the surface is influenced by a combination of changes in both soft and hard tissues, including eyeball position/size, skin thickness, and skeletal nasal protrusion. Such a covariation pattern is likely common to the two populations. (2) Ryukyu Islanders have a more prominent nasal root at both skeletal and surface levels than mainland Japanese, but eyeball position/size and soft tissue thickness do not differ between the two populations. Following from these findings, we suggest that the skeletal nasal root protrusion, not soft tissue configuration, is likely to account for the difference in the surface nasal root protrusion between the two populations. This study fills gaps between skeletal and somatometric (or 3D surface) studies and will contribute toward a better understanding of human facial diversifications.
We express our great thanks to the radiological technologists and staffs at the University Hospital, University of the Ryukyus for CT scanning and their help with data acquisition. We also thank Mutsumi Isa for her help with data management. We are grateful to the people who participated in this study. We also thank Masato Nakatsukasa, an anonymous associate editor, and two reviewers for their constructive comments that greatly improved this paper. This study was supported by the Grants-in-Aid for Scientific Research from JSPS (25251042 to H.I.) and the Keihanshin Consortium for Fostering the Next Generation of Global Leaders in Research (K-CONNEX), established by Human Resource Development Program for Science and Technology, MEXT (to T.I.).
| Abbreviation | Definition | Type1 |
|---|---|---|
| Face surface | ||
| Gs | Glabella on face surface | M |
| Se | Serion | M |
| En | Entocanthion | B |
| Ac | Alar curvature | B |
| Eyeball | ||
| Ea | Anterior-most point of eyeball | B |
| Ep | Posterior-most point of eyeball | B |
| Es | Superior-most point of eyeball | B |
| Ei | Inferior-most point of eyeball | B |
| Em | Mesial-most point of eyeball | B |
| El | Lateral-most point of eyeball | B |
| Skeleton | ||
| Gc | Glabella on cranium | M |
| Ns | Nasion | M |
| Rhi | Rhinion | M |
| Mf | Maxillofrontale | B |
| Fmo | Frontomalare orbitale | B |
| Zm | Anteroinferior point of zygomaticomaxillary suture | B |
| Oc | Anteroinferior point of optic canal | B |
| Ors | The point on the superior margin of the orbit at the level of three-fifths from Fmo to Mf | B |
| Ori | The point on the inferior margin of the orbit at the level of three-fifths from Fmo to Mf | B |
| Orr | Orbital roof: the most superior point of orbital roof | B |
| Orf | Orbital floor: the most inferior point of orbital floor | B |
| EH (mm) | EW (mm) | EL (mm) | ES (mm) | ER (mm) | ERI (index) | NRP (mm) | GP (mm) | NRT (mm) | GT (mm) | OD (mm) | OH (mm) | OW (mm) | ORR (mm) | IOH (mm) | OI (index) | IOI (index) | FC (mm) | FS (mm) | FI (index) | CNA (angle) | |
|---|---|---|---|---|---|---|---|---|---|---|---|---|---|---|---|---|---|---|---|---|---|
| ICC | 0.952 | 0.942 | 0.951 | 0.973 | 0.986 | 0.986 | 0.986 | 0.984 | 0.965 | 0.941 | 0.973 | 0.959 | 0.968 | 0.971 | 0.991 | 0.966 | 0.922 | 0.995 | 0.964 | 0.952 | 0.949 |
| Mean | 0.271 | 0.288 | 0.225 | 0.171 | 0.327 | 0.007 | 0.299 | 0.419 | 0.288 | 0.313 | 0.420 | 0.421 | 0.342 | 0.360 | 0.202 | 0.011 | 0.012 | 0.330 | 0.391 | 0.004 | 2.072 |
| SD | 0.225 | 0.215 | 0.273 | 0.149 | 0.314 | 0.007 | 0.258 | 0.360 | 0.222 | 0.220 | 0.317 | 0.315 | 0.260 | 0.310 | 0.173 | 0.008 | 0.009 | 0.263 | 0.438 | 0.004 | 1.712 |
| Max | 1.701 | 1.068 | 2.084 | 0.828 | 1.503 | 0.029 | 1.631 | 2.130 | 1.006 | 0.940 | 1.494 | 1.442 | 1.170 | 1.681 | 0.830 | 0.034 | 0.041 | 1.213 | 3.976 | 0.039 | 8.037 |
| Ryukyu Islanders | Mainland Japanese | |||||||
|---|---|---|---|---|---|---|---|---|
| Female | Male | Female | Male | |||||
| Mean | SD | Mean | SD | Mean | SD | Mean | SD | |
| EH | 25.60 | 1.19 | 25.70 | 1.02 | 25.35 | 1.05 | 25.57 | 1.10 |
| EW | 25.57 | 0.97 | 25.93 | 0.98 | 25.23 | 1.06 | 25.38 | 0.77 |
| EL | 24.62 | 1.12 | 24.82 | 1.05 | 24.56 | 1.04 | 24.69 | 1.16 |
| ES | 25.25 | 0.99 | 25.48 | 0.93 | 25.04 | 1.00 | 25.21 | 0.95 |
| ER | 1.53 | 2.66 | 1.27 | 2.34 | 2.88 | 2.19 | 0.90 | 2.33 |
| ERI | 0.03 | 0.06 | 0.03 | 0.05 | 0.06 | 0.05 | 0.02 | 0.05 |
| NRP | 7.74 | 2.27 | 8.99 | 2.33 | 6.77 | 1.43 | 7.49 | 2.02 |
| GP | 11.85 | 2.70 | 14.00 | 3.11 | 11.44 | 2.51 | 12.77 | 2.89 |
| NRT | 6.01 | 1.22 | 6.45 | 1.38 | 4.84 | 0.72 | 6.45 | 1.39 |
| GT | 6.11 | 1.05 | 6.26 | 1.06 | 5.32 | 0.94 | 6.29 | 1.29 |
| OD | 45.69 | 1.84 | 46.71 | 2.32 | 46.38 | 2.27 | 46.27 | 2.25 |
| OH | 35.20 | 1.30 | 35.08 | 1.91 | 34.89 | 1.80 | 36.20 | 2.22 |
| OW | 39.84 | 1.56 | 40.98 | 1.51 | 39.38 | 1.92 | 41.36 | 1.52 |
| ORR | 10.66 | 2.09 | 10.43 | 1.96 | 9.26 | 1.65 | 9.59 | 1.66 |
| IOH | 38.72 | 1.31 | 39.15 | 1.90 | 38.06 | 1.91 | 38.75 | 2.26 |
| OI | 0.88 | 0.04 | 0.86 | 0.05 | 0.89 | 0.05 | 0.88 | 0.05 |
| IOI | 0.91 | 0.03 | 0.90 | 0.04 | 0.92 | 0.02 | 0.93 | 0.04 |
| FC | 96.48 | 3.70 | 99.58 | 3.46 | 94.01 | 3.66 | 100.80 | 3.69 |
| FS | 15.76 | 2.03 | 16.55 | 2.20 | 14.51 | 1.58 | 15.12 | 1.55 |
| FI | 0.16 | 0.02 | 0.17 | 0.02 | 0.15 | 0.01 | 0.15 | 0.01 |
| CNA | 143.63 | 4.87 | 135.62 | 7.69 | 143.75 | 4.77 | 133.49 | 5.12 |