Abstract
This study investigates the morphological variation and taxonomic affinities of 28 fossil gibbon molars from eight newly discovered Pleistocene cave sites in the area of Chongzuo, Guangxi Zhuang Autonomous Region, China. A recent descriptive analysis demonstrated that these fossil teeth form a uniform group that can be assigned to a single species of Nomascus. In this contribution, a two-dimensional morphometric approach is employed to examine the Chongzuo specimens in comparison with a large sample of extant hylobatids, as well as with previously reported hylobatid dental remains from the Pleistocene of China. Buccolingual and mesiodistal measurements and crown outline areas reveal that the Chongzuo molars correspond most closely with Nomascus and, to a lesser extent, Hoolock. Crown shape was investigated using elliptical Fourier analysis. Our results show that the Chongzuo specimens fall in most cases either within the range of variation of extant Nomascus to the exclusion of all other hylobatid genera, or their distance from the cluster represented by the Nomascus sample is relatively small. Similarly, the Mahalanobis distances for crown shape show a trend towards smaller morphological distances between the Chongzuo specimens and Nomascus, followed by Hoolock and Hylobates. The Chongzuo molars are also morphometrically distinct from Bunopithecus sericus, but fall within the range of overlap of other Pleistocene hylobatid dental remains from southern China. The balance of evidence indicates that the Chongzuo teeth can be attributed to cf. Nomascus. The fossil teeth are sufficiently distinct from those of extant Nomascus that they may represent an extinct species.
Introduction
Based on molecular evidence, hylobatids originated during the early Miocene (Fabre et al., 2009; Chan et al., 2010, 2012; Matsudaira and Ishida, 2010; Thinh et al., 2010a; Israfil et al., 2011; Perelman et al., 2011; Springer et al., 2012; Finstermeier et al., 2013; Carbone et al., 2014; Roos, 2016; Fan et al., 2017). However, the Neogene fossil record documenting the early evolutionary history of hylobatids is very poor (Jablonski and Chaplin, 2009; Harrison, 2016). Yuanmoupithecus xiaoyuan, based on a small collection of teeth from the late Miocene (~7–9 Ma) Yuanmou Basin in Yunnan, is the only known purported stem hylobatid (Harrison et al., 2002; Pan, 2006; Harrison, 2010, 2016). Otherwise, fossil hylobatids are known only from Pleistocene localities in China, Laos, Thailand, Vietnam, and insular Southeast Asia (for a review, see Harrison, 2016). These Pleistocene finds consist primarily of isolated teeth, making it difficult to determine their taxonomic and phylogenetic affinities, although they can be generally assigned to extant genera (i.e., Hylobates, Hoolock, Nomascus, and Symphalangus; Harrison, 2016). However, the discovery of Bunopithecus sericus from the Pleistocene site of Yanjinggou in Chongqing (Matthew and Granger, 1923; Mootnick and Groves, 2005; Ortiz et al., 2015; Harrison, 2016) and the recent report of Junzi imperialis from an imperial tomb in Chang’an, southern Shaanxi (Turvey et al., 2018) demonstrate that now-extinct genera of hylobatids occurred in central and eastern China during the Pleistocene and Holocene.
Fossil hylobatids from China have been recovered from numerous Early to Late Pleistocene sites in Yunnan, Guangxi Zhuang Autonomous Region (ZAR), Hainan, Sichuan, Guizhou, Guangdong, and Hunan (Gu et al., 1996; Jablonski and Chaplin, 2009). Although fossil gibbons are relatively rare finds at these sites, they do provide critical evidence documenting the past diversity and biogeography of hylobatids. Today, gibbons in China are restricted to Tibet, Yunnan, Guangxi ZAR, and Hainan in the southwest of the country (Ji and Jiang, 2004; Geissmann, 2007; Fan and Huo, 2009; Mittermeier et al., 2013; Fan et al., 2017), but evidence from the fossil and historical records indicates that gibbons were much more widely distributed across southern China in the past (van Gulik, 1967; Groves, 1972; Gao et al., 1981; Gu, 1989; Geissmann, 1995; Gu et al., 1996; Jablonski et al., 2000; Jablonski and Chaplin, 2009; Turvey et al., 2015, 2018; Harrison, 2016).
The largest collections of hylobatids from China come from Guangxi ZAR, dating back to the Early Pleistocene (~2.0 Ma). Gu (1986, 1989) published a brief account of fossil gibbons from Guangxi ZAR collected during the 1950s. The 37 isolated teeth, mostly upper molars, came from at least eight different cave sites, as well as from traditional medicine supply companies. Based on her comparative study of the upper molars, Gu concluded that the majority of specimens resembled Nomascus concolor s.l. in retaining a lingual cingulum, whereas three upper molars lacking a lingual cingulum were considered to be more similar to Hoolock.
Recent fieldwork in the Chongzuo area of Guangxi ZAR has yielded a sample of isolated teeth of fossil hylobatids from eight cave sites, ranging in age from Early to Late Pleistocene (Figure 1). Gibbons are a rare component of the Pleistocene primate community in Chongzuo, constituting less than 1% of specimens (Takai et al., 2014). They are associated in the cave deposits with a diverse primate fauna that includes hominids (i.e., Homo, Gigantopithecus, Pongo, and an unnamed large hominoid) and cercopithecids (i.e., Pygathrix, Rhinopithecus, Trachypithecus, Macaca, and Procynocephalus). Zhang et al. (2018) provide a description and comparison of the newly discovered fossil gibbon teeth from Chongzuo (Figure 2). Based on the degree of morphological and metrical variation and a suite of distinctive features, Zhang et al. (2018) concluded that the Chongzuo gibbons can be attributed to a single species of Nomascus. However, the fossil molars differ from those of extant species of Nomascus found in China today in being slightly larger and in the relative proportions of the molars. The present study aims to further explore the morphological variation and taxonomic affinities of the newly recovered collection of fossil gibbon molars from Chongzuo using a two-dimensional (2D) morphometric approach.

Materials and Methods
Samples
The fossil hylobatid specimens from Chongzuo are housed in the collections of the Institute of Vertebrate Paleontology and Paleoanthropology (IVPP) in Beijing. Descriptions and tooth type allocations of the fossil specimens are presented in Zhang et al. (2018). The sample comprises 28 molars (24 upper molars and four lower molars; Table 1 and Figure 2). Two additional molars (one upper molar and one lower molar) were recovered but they were not included in the present study because their crowns are incomplete (Figure 2). Here we compare the Chongzuo material with a sample of extant hylobatids, comprising a total of 1289 molars represented by 347 individuals of Hylobates, Hoolock, Nomascus, and Symphalangus (Table 2 and Supplementary Table 1). Extant hylobatid data were collected at the following institutions: American Museum of Natural History (AMNH), New York, USA; National Museum of Natural History (NMNH), Washington DC, USA; Museum of Comparative Zoology (MCZ), Cambridge, MA, USA; Natural History Museum (NHM), UK; Kunming Institute of Zoology (KIZ), Kunming, China; Sun Yat-sen University (SYS), Guangzhou, China; and Institute of Zoology (IOZ), Beijing, China. Only data from specimens of known provenance were collected. Provenance information was obtained from museum records and the nomenclature was adjusted to reflect the currently accepted taxonomy (Geissmann, 2007; Mittermeier et al., 2013; Roos, 2016; Rowe and Myers, 2016). Given that sex is unknown for the Chongzuo fossils, it was not included as a variable in this study. It should be noted, however, that hylobatids are not sexually dimorphic in molar size and shape (Swindler, 2002). No antimeres were included. If both the right and left sides of a given molar type were available, only the best preserved was analyzed.
Table 1
List of fossil hylobatid molars from Chongzuo, Guangxi ZAR included in this study
| Age |
Locality |
Field No. |
IVPP No. |
Elementa |
| Early Pleistocene (~2.0 Ma) |
Baikong |
CLBBD201011-1040 |
PA 1632 |
RM3 |
| Early Pleistocene (~1.2 Ma) |
Sanhe |
GCSD0605-1 |
PA 1634 |
RM1 |
| GCSD0410-001 |
PA 1635 |
RM1 |
| Middle Pleistocene (~380–310 ka) |
Daxin Hei |
DLZNH201206-30 |
PA 1636 |
LM2 |
| DLZNH201211-105 |
PA 1637 |
RM3 |
| Middle Pleistocene |
Yixiantian |
CFLSY201011-1115 |
PA 1639 |
RM1 |
| CFLSY201011-1113 |
PA 1640 |
LM1 |
| CFLSY201011-1112 |
PA 1641 |
LM1 or M2 |
| Middle Pleistocene |
Shuangtan |
CMLST0911-37 |
PA 1642 |
LM2 |
| CMLST1005-11 (west) |
PA 1643 |
LM2 |
| Late Pleistocene (~110 ka) |
Zhiren |
CLM0704-0116 |
PA 1644 |
LM1 or M2 |
| CZ0408a |
PA 1645 |
LM1 or M2 |
| CZ0408g-13 |
PA 1646 |
LM2 |
| Late Pleistocene |
Yugong |
CLBBG201112-350 |
PA 1647 |
LM2 |
| CLBBG201112-583 |
PA 1648 |
RM1 |
| Late Pleistocene |
Baxian |
RTK201306-391 (RTK6) |
PA 1651 |
RM2 |
| RTK201306-502 (RTK7) |
PA 1652 |
RM1 or M2 |
| RTK201306-501 (RTK7) |
PA 1653 |
RM3 |
| RTK201306-500 (RTK7) |
PA 1654 |
RM2 |
| RTK201306-499 (RTK7) |
PA 1655 |
LM2 |
| RTK201306-498 (RTK7) |
PA 1656 |
LM1 or M2 |
| RTK201306-497 (RTK7) |
PA 1657 |
LM1 or M2 |
| RTK201306-496 (RTK7) |
PA 1658 |
LM1 |
| RTK201306-495 (RTK7) |
PA 1659 |
LM2 |
| RTK201306-494 (RTK7) |
PA 1660 |
RM2 |
| RTK201306-493 (RTK7) |
PA 1661 |
RM2 |
| RTK201306-492 (RTK7) |
PA 1662 |
RM3 |
| RTK201306-491 (RTK7) |
PA 1663 |
RM3 |
a Abbreviations: L= left; R = right.
Table 2
Samples of upper and lower molars of extant hylobatids used in this study
| Genus |
Total individuals |
Total molars |
M1 |
M2 |
M3 |
M1 |
M2 |
M3 |
| Hoolock |
99 |
333 |
67 |
74 |
46 |
51 |
57 |
38 |
| Hylobates |
163 |
663 |
103 |
131 |
99 |
100 |
132 |
98 |
| Nomascus |
44 |
147 |
29 |
32 |
22 |
20 |
22 |
22 |
| Symphalangus |
41 |
146 |
20 |
27 |
20 |
23 |
32 |
24 |
| Total |
347 |
1289 |
219 |
264 |
187 |
194 |
243 |
182 |
All analyses were conducted on high-resolution images of the occlusal surface of teeth taken with either a Canon Digital Rebel XT camera with a 75–300 mm lens (AO) or a Nikon D1H camera with an A/F micro-Nikkor 105 mm lens (KH). The smallest aperture possible was used to maximize depth of field. Following protocols described elsewhere (Bailey, 2002; Pilbrow, 2003), each tooth was oriented independently, so that the buccal, and where possible, distal portion of the cervical line was perpendicular to the optical axis of the camera. A millimeter scale placed at the same horizontal plane as the cusp apices was included in each image for calibration. Both the camera and scale were leveled using standard bubble devices. Digital images of the molars were subsequently imported into Adobe® Photoshop CC 2017 to align the longitudinal groove with the y-axis and the main buccolingual groove with the x-axis. Right teeth were mirror-imaged to correspond to the left side and treated as such for landmark digitizing and analyses. When necessary, interproximal wear was corrected following Wood and Engleman (1988).
The affinities of the fossil molars were investigated using elliptical Fourier analysis (EFA) of the crown outline. EFA allows quantification of the shape of a 2D closed curve and is independent of size and position (Kuhl and Giardina, 1982). The method consists of the decomposition of the outline of an object into a series of harmonically related trigonometric curves called harmonics that can be used in multivariate analyses. Each harmonic is described by four Fourier coefficients (sines and cosines), two for each x- and y-axis (for further details of the method, see Kuhl and Giardina, 1982; Ferson et al., 1985; Carlo et al., 2011). EFA has proven to be a powerful tool for the taxonomy of diverse organisms (e.g., Rohlf and Archie, 1984; Ferson et al., 1985; Crampton, 1995; Schmittbuhl et al., 2007; Ledesma et al., 2010; Carlo et al., 2011), including hominoids (Ferrario et al., 1999; Bailey and Lynch, 2005; Ludeman et al., 2015). To perform the EFA, 60 equidistant semilandmarks were collected on the crown outline of the upper and lower molars using tpsDig 232 (Rohlf, 2016), which allows the automatic placement of coordinates along the 2D contour of an object. The first point of each tooth was placed on the median groove separating the two main buccal cusps (for upper molars) and lingual cusps (for the lower molars), and coordinate data were subsequently imported into PAST (Hammer et al., 2001) to perform the EFA principal component analysis (PCA) and to obtain the elliptical Fourier coefficients for further multivariate analyses. Following Ludeman et al. (2015), the first 15 harmonics (i.e., 60 Fourier coefficients) were used to describe the shape outline. Given that the majority of the fossil molars from Chongzuo exhibit moderate to heavy wear (68% of the sample), worn teeth from extant counterparts were included in the EFA analyses as long as the accuracy in tracing the crown outline was not compromised. Previous studies have reported relatively low and non-significant rates of intra- and interobserver error in tooth and landmark orientation (Pilbrow, 2003; Bailey et al., 2004; Gómez-Robles et al., 2015). All landmark data were collected by AO for consistency.
We also collected the maximum crown area of each molar using ImageJ (Schneider et al., 2012). Size variables have been shown to differentiate hylobatid molars at the generic level (Frisch, 1965; Swindler, 2002; Ortiz et al., 2015), with an overall increase in size in the following order: Hylobates, Nomascus, Hoolock, and Symphalangus. However, size alone is an unreliable criterion for discriminating fossil gibbons because it is well documented that Asian catarrhine primates have undergone dental size increase and diminution during the Pleistocene (Hooijer, 1960, 1961, 1962; Harrison, 1996; Harrison et al., 2014; Zhang et al., 2015). Furthermore, the wear on some fossil teeth, partially or completely obliterating the intercuspal fissures, greatly reduced the number of specimens from which cusp areas could be collected, and therefore, these variables were not included in the analyses.
Gu (1989) reported linear mesiodistal and buccolingual dimensions for the Pleistocene hylobatid teeth previously recovered in Guangxi. Most of these teeth were classified as either M1/M2 or M3. Gu’s (1989) published data were used to compare these fossils with the Chongzuo specimens. Data from Bunopithecus sericus (AMNH 18534) were also included. Maximum mesiodistal length and buccolingual breadth (to the nearest 0.1 mm) of molars in our extant and fossil sample were measured either from digital photographs or using Mitutoyo digital calipers on the actual specimens. A paired t-test revealed no significant differences in molar crown area between data derived from digital photographs and from calipers for which both datasets are available (t = −0.457, df = 18, P = 0.653).
Statistical analyses
Each molar type was analyzed separately. Six teeth could only be identified as M1/M2 (vs. M3) or M1/M2 (vs. M3) (see Zhang et al., 2018). Thus, we also performed a separate analysis combining the first and second molars for the fossil and recent hylobatid material. We first carried out EFA PCAs to assess whether all fossil teeth plot together based on crown shape outline. Subsequently, we performed a canonical variate analysis (CVA) of the first 15 harmonics using ‘genus’ as the classifying variable to determine group shape outline differences and the position of the fossil teeth in the morphospace. Following Zhang et al. (2018), all fossil hylobatid teeth from Chongzuo were treated as a single group, given the uniformity of the metrical and morphological features of the fossil sample. CVAs and other discriminant analyses provide a posterior probability value for group membership, where a higher number indicates increased probability. We also calculated the Mahalanobis distances to determine the distances in crown shape among the four extant genera and the fossil group. To do so, we reduced the dimensionality of our data by using the first three EFA principal components, which explain ~95% of the total outline shape variation. The Mahalanobis distances were calculated in R (R Core Team, 2015) using the package asbio version 1.5. All additional statistical analyses were conducted in JMP® Pro 13 (SAS Institute Inc., 2016) and PAST (Hammer et al., 2001).
Results
Supplementary Table 2 provides the descriptive statistics for the maximum occlusal area of the molars of four extant hylobatid genera with comparisons to the fossil molars. As noted above, Symphalangus has the largest molars, followed in decreasing order by Hoolock, then Nomascus, and finally Hylobates. Confidence intervals at the 95% confidence level (± 2SD) indicate that the absolute size of the fossil molars is more frequently significantly different from Symphalangus and Hylobates, although, in general, results based on this variable did not allow any conclusive statement to be made regarding the affinities of the fossil specimens. Similar results were obtained when we compared mesiodistal length (MD) with buccolingual breadth (BL) molar dimensions using bivariate plots (Supplementary Figure 1). Although the fossil teeth from Chongzuo are most distinct from Symphalangus and Hylobates, they fall within the overlap range of Hoolock and Nomascus. In most cases, the Chongzuo specimens also overlap in MD and BL dimensions with the Pleistocene hylobatid teeth reported by Gu (1989). A notable exception is the M3, which appears to be more elongated (relative to its breadth) in Gu’s (1989) specimens.
Plots of the first two EFA principal components are presented in Supplementary Figures 2–8. In all cases, the first component explains more than 90% of the variance. The EFA PCAs show extensive overlap among extant hylobatid groups and no clear indication of the affinity of the Chongzuo fossils to any one group. However, it is important to point out that all fossil teeth identified as M1s, most M2s, and all M3s are located in negative PC1 and negative PC2 morphospace. Their shape tends to be associated with a comparatively small and buccolingually compressed metacone that does not protrude buccally. The greatest breadth occurs on the mesial aspect of the teeth, as opposed to those located on positive PC1 and PC2, which show the greatest breadth distally. The Chongzuo lower molars tend to be located on positive PC1 and negative PC2. They are mesiodistally elongated, with a centrally positioned hypoconulid and maximum breadth located on the talonid. Among all extant groups analyzed, the Chongzuo lower molars appear to be most distinct from Hylobates. Although Hylobates outline shape is notably variable, the lower molars in this genus tend to be less elongated, with a small hypoconulid and a maximum breadth across the trigonid. The hypoconulid in Hylobates is generally centrally or buccally oriented. A more buccal orientation of the hypoconulid results in a more skewed crown contour.
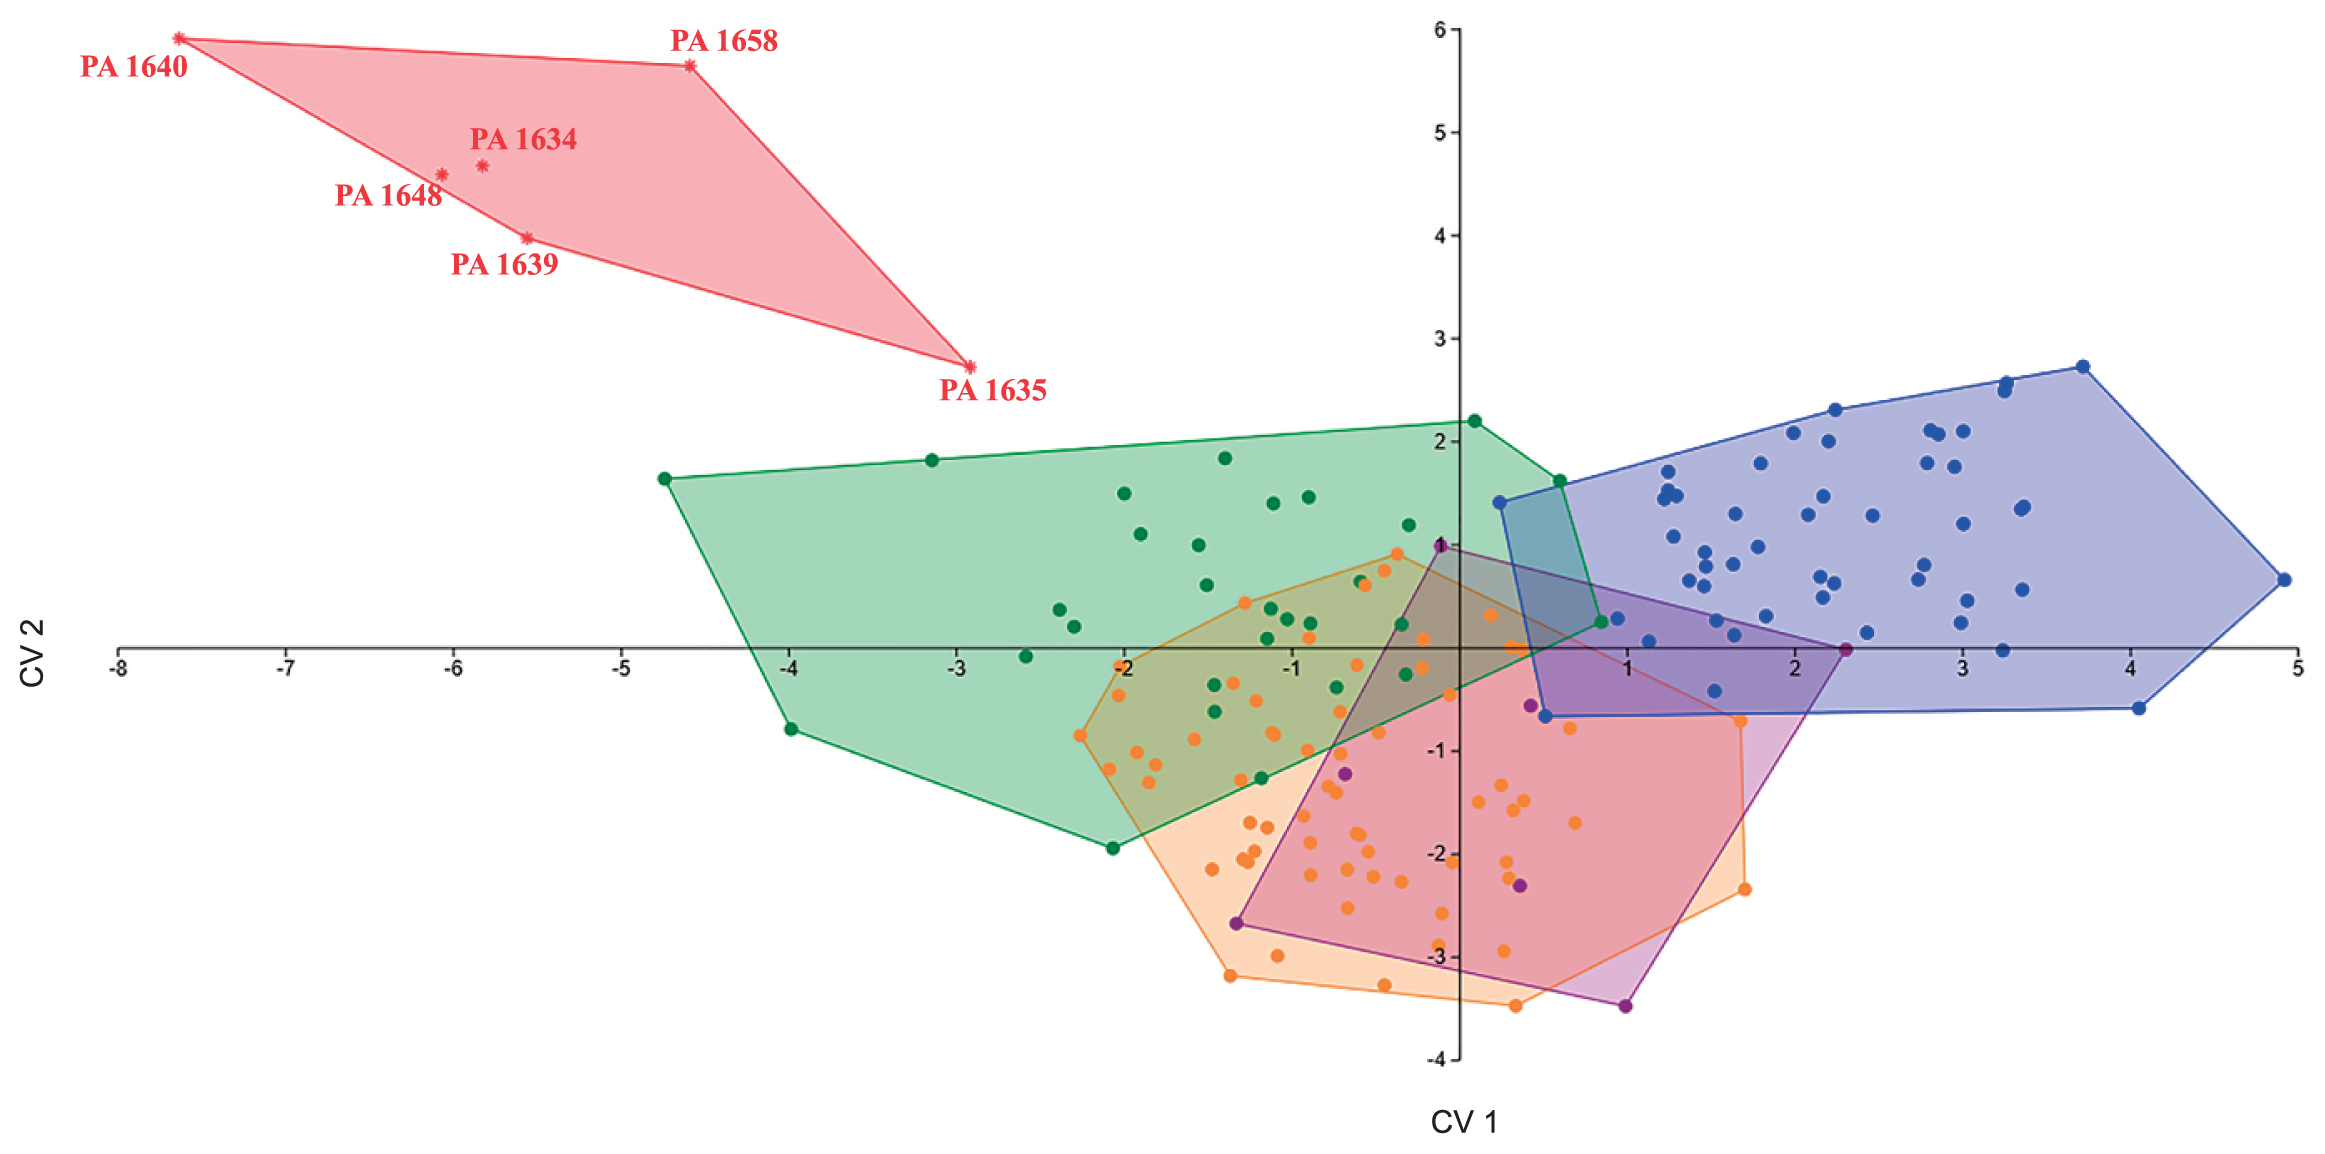
As detailed in Table 3, the EFA of the crown outline for extant taxa provides a classification accuracy (without jackknifing) ranging between 72.88% (M1/M2) and 93.94% (M3) for the upper molars and between 85.35% (M1/M2) and 92.48% (M3) for the lower molars. With jackknifing, the likelihood of individuals being accurately classified ranges between 52.71% (M2) and 66.88% (M1) for the upper molars, whereas that for the lower molars is between 54.14% (M3) and 67.52% (M1/M2). Classifications for individual fossil teeth are presented in Table 4. These results are mixed and vary even within sites. Based on attributions with the highest posterior probabilities, the majority of the fossil sample (46.43%) was allocated to Nomascus. The remaining specimens were classified as Hoolock (25%), Hylobates (25%), and Symphalangus (3.57%). Figures 3–9 illustrate the plots of the first two canonical variates for individual molars using the first 15 harmonics (60 Fourier coefficients). The percentage of the variance explained by each canonical discriminant function is provided in Table 3. When treated as a group, the M1 outline shape of the fossil specimens falls outside the range of variation observed among extant hylobatids (Figure 3). However, overall, the fossil M1s fall closer to Nomascus than to other groups. Despite its distance in the morphospace, Yixiantian PA 1639 was classified as Hylobates based on posterior probabilities of crown outline data. The Chongzuo fossils do not cluster with any extant taxon on the basis of M2 crown shape, and all teeth fall outside the range of variation of extant hylobatids. In general, however, M2 crown shape does not appear to be particularly useful for assessing the taxonomic affinities of hylobatids, showing a high degree of overlap among extant genera (Figure 4). As illustrated in Figure 5, M3 outline shape variation of the fossil group falls almost entirely within the range of variation of Nomascus to the exclusion of other genera. Interestingly, however, two of the four molars comprising the fossil group were classified as Hylobates (Baikong PA 1632 and Baxian PA 1662) with higher probability. The M3 outline shape of Symphalangus is the most distinctive of the hylobatids, and the greatest degree of overlap occurs between Hoolock and Hylobates. When all M1 and M2 were pooled in an attempt to identify the morphological affinities of the fossil teeth that could not be unambiguously allocated to either M1 or M2, we found a high degree of overlap in crown shape outline among the four extant hylobatid genera. In the M1/M2 analysis, the fossils from Chongzuo fall to a great extent outside the range of variation of recent hylobatids, although some overlap was found between them and all extant taxa (Figure 6).
Table 3
Discriminant model accuracy results for hylobatid crown outline shape variation and percent of the variation accounted for by each canonical variate
| CVA outline |
M1 |
M2 |
M3 |
M1/M2 |
M2 |
M3 |
M1/M2 |
| Total |
157 |
203 |
132 |
365 |
187 |
133 |
314 |
| Model accuracy (not jackknifed) |
92.99% |
83.25% |
93.94% |
72.88% |
90.37% |
92.48% |
85.35% |
| Model accuracy (jackknifed) |
66.88% |
52.71% |
59.09% |
56.44% |
64.71% |
54.14% |
67.52% |
| Axis 1: % variation |
41.97 |
35.85 |
45.13 |
38.18 |
33.38 |
44.89 |
32.42 |
| Axis 1: eigenvalue |
3.352 |
1.587 |
4.347 |
1.0457 |
2.502 |
3.550 |
1.379 |
| Axis 2: % variation |
26.03 |
27.31 |
23.33 |
26.83 |
27.95 |
27.88 |
29.58 |
| Axis 2: eigenvalue |
2.079 |
1.209 |
2.247 |
0.735 |
2.095 |
2.205 |
1.258 |
| Axis 3: % variation |
18.23 |
22.82 |
17.84 |
20.21 |
21.28 |
13.84 |
20.81 |
| Axis 3: eigenvalue |
1.456 |
1.01 |
1.718 |
0.554 |
1.595 |
1.094 |
0.885 |
| Axis 4: % variation |
13.77 |
14.01 |
13.70 |
14.78 |
11.25 |
8.92 |
13.43 |
| Axis 4: eigenvalue |
1.099 |
0.62 |
1.319 |
0.405 |
0.843 |
0.706 |
0.571 |
Table 4
Genus classifications and posterior probabilities for each fossil tooth based on crown shape outline
| Locality |
IVPP No. |
Element |
Genusa |
Probabilitya (%) |
| Baikong |
PA 1632 |
M3 |
Hylobates |
90.05 |
| Sanhe |
PA 1634 |
M1 |
Nomascus |
99.66 |
|
PA 1635 |
M1 |
Nomascus |
100.00 |
| Daxin Hei |
PA 1636 |
M2 |
Symphalangus |
99.73 |
|
PA 1637 |
M3 |
Nomascus |
87.45 |
| Yixiantian |
PA 1639 |
M1 |
Hylobates |
79.23 |
|
PA 1640 |
M1 |
Nomascus |
99.70 |
|
PA 1641 |
M1 or M2 |
Hylobates |
73.76 |
| Shuangtan |
PA 1642 |
M2 |
Hylobates |
99.51 |
|
PA 1643 |
M2 |
Hoolock |
99.45 |
| Zhiren |
PA 1644 |
M1 or M2 |
Hoolock |
54.61 |
|
PA 1645 |
M1 or M2 |
Nomascus |
99.86 |
|
PA 1646 |
M2 |
Hoolock |
67.79 |
| Yugong |
PA 1647 |
M2 |
Nomascus |
99.97 |
|
PA 1648 |
M1 |
Nomascus |
89.39 |
| Baxian |
PA 1651 |
M2 |
Hoolock |
87.18 |
|
PA 1652 |
M1 or M2 |
Nomascus |
98.55 |
|
PA 1653 |
M3 |
Hylobates |
83.58 |
|
PA 1654 |
M2 |
Nomascus |
58.91 |
|
PA 1655 |
M2 |
Hoolock |
64.41 |
|
PA 1656 |
M1 or M2 |
Nomascus |
98.73 |
|
PA 1657 |
M1 or M2 |
Hylobates |
80.23 |
|
PA 1658 |
M1 |
Nomascus |
83.18 |
|
PA 1659 |
M2 |
Hoolock |
74.35 |
|
PA 1660 |
M2 |
Hoolock |
94.38 |
|
PA 1661 |
M2 |
Nomascus |
88.74 |
|
PA 1662 |
M3 |
Hylobates |
98.36 |
|
PA 1663 |
M3 |
Nomascus |
99.82 |
a Highest probability provided.


Although M2 crown outline more clearly aligns the fossil specimens with Nomascus (Figure 7), results for M3 show that the Baxian PA 1653 crown shape falls closer to Hylobates (Figure 8). When M1 and M2 are analyzed together, Shuangtan PA 1643 is classified as Nomascus to the exclusion of other taxa, and Baxian PA 1652 falls within Nomascus and near the positive-Y limit of the range of Hoolock (Figure 9). The M2 and M3 of Bunopithecus from the Pleistocene of Yanjinggou, Chongqing, China (Matthew and Granger, 1923; Ortiz et al., 2015) were also included in the outline shape analyses to assess its relationship in morphospace with other Pleistocene fossils. As reported by Ortiz et al. (2015), Bunopithecus lower molars fall either outside the range of variation of extant hylobatid genera, but closest to Hoolock (for M2), or within the range of overlap of Hoolock and Nomascus crown shape variation (for M3). The results of the present analysis show that Bunopithecus is morphologically distant from the cluster represented by the fossil specimens from Chongzuo (Figure 7, Figure 8).
Mahalanobis distances of the crown shape outline among groups are presented in Table 5 and Table 6 for upper and lower molars, respectively. The shape of M1, M2, and M1/M2 combined of the Chongzuo hylobatids shows closest affinities to Nomascus, whereas that of M3 is closer to Hylobates. This latter distance for M3 is hard to reconcile with the position in the morphospace of the fossils when CV1 vs. CV2 were plotted using the first 60 Fourier coefficients (see Figure 5). For the lower molars, the fossils from Chongzuo are closest to Hoolock relative to the other extant genera in M2 and M3, but when M1/M2 are combined, the Chongzuo material is closer to Nomascus. In general, the pairwise distances between the fossil dataset and extant hylobatids are higher than those among the extant genera.
Table 5
Mahalanobis distances among hylobatid taxa for upper molars
| M1 |
Fossils (n = 6)a |
Hoolock |
Hylobates |
Nomascus |
| Hoolock |
8.402 |
|
|
|
| Hylobates |
6.074 |
0.776 |
|
|
| Nomascus |
4.019 |
2.460 |
0.666 |
|
| Symphalangus |
17.776 |
7.488 |
2.964 |
3.929 |
| M2 |
Fossils (n = 9)b |
Hoolock |
Hylobates |
Nomascus |
| Hoolock |
3.428 |
|
|
|
| Hylobates |
2.389 |
0.741 |
|
|
| Nomascus |
1.924 |
1.158 |
0.088 |
|
| Symphalangus |
2.561 |
2.166 |
0.788 |
1.116 |
| M1/M2 |
Fossils (n = 20)c |
Hoolock |
Hylobates |
Nomascus |
| Hoolock |
3.790 |
|
|
|
| Hylobates |
3.102 |
0.724 |
|
|
| Nomascus |
1.920 |
1.333 |
0.151 |
|
| Symphalangus |
4.138 |
3.380 |
1.218 |
1.937 |
| M3 |
Fossils (n = 20) |
Hoolock |
Hylobates |
Nomascus |
| Hoolock |
11.690 |
|
|
|
| Hylobates |
1.355 |
1.049 |
|
|
| Nomascus |
5.595 |
1.789 |
0.498 |
|
| Symphalangus |
18.102 |
6.939 |
2.200 |
6.125 |
Bold type indicates the smallest distance between the fossil cluster and extant hylobatids.
a Only specimens unambiguously identified as M
1 included.
b Only specimens unambiguously identified as M
2 included.
c All specimens identified as M
1, M
2, or M
1/M
2 included.
Table 6
Mahalanobis distances among hylobatid taxa for lower molars
| M2 |
Fossils (n = 2)a |
Hoolock |
Hylobates |
Nomascus |
| Hoolock |
4.014 |
|
|
|
| Hylobates |
5.950 |
1.454 |
|
|
| Nomascus |
7.178 |
1.318 |
0.474 |
|
| Symphalangus |
4.904 |
5.736 |
4.857 |
4.519 |
| M1/M2 |
Fossils (n = 3)b |
Hoolock |
Hylobates |
Nomascus |
| Hoolock |
0.915 |
|
|
|
| Hylobates |
2.671 |
1.396 |
|
|
| Nomascus |
0.784 |
1.467 |
0.772 |
|
| Symphalangus |
2.322 |
3.278 |
4.471 |
3.277 |
| M3 |
Fossils (n = 4) |
Hoolock |
Hylobates |
Nomascus |
| Hoolock |
0.676 |
|
|
|
| Hylobates |
1.766 |
0.719 |
|
|
| Nomascus |
1.166 |
0.161 |
0.901 |
|
| Symphalangus |
2.013 |
3.982 |
5.653 |
5.463 |
Bold type indicates the smallest distance between the fossil cluster and extant hylobatids.
a Only specimens unambiguously identified as M
2 included.
b All specimens identified as M
1, M
2, or M
1/M
2 included.
Discussion and Conclusions
Zhang et al. (2018) suggested that the hylobatid teeth from the Pleistocene cave sites of Chongzuo did not exceed the range of intraspecific morphological and metrical variation seen in extant species of gibbons, and included all of the specimens in a single species. Further, Zhang et al. (2018) assigned this species to Nomascus based on a suite of morphological features shared uniquely with extant members of this genus. Shared features include M3 subequal in length to M1, upper molars relatively broad with a high incidence of a well-developed lingual cingulum and a trace of a buccal cingulum, and relatively narrow lower molars with a vestige of a buccal cingulum. They also showed that the Chongzuo hylobatid can be distinguished from Nomascus concolor and Nomascus leucogenys in having slightly larger teeth and in the proportions of the molars.
Nomascus, with seven currently recognized species, occurs today in China, Laos, Vietnam, and Cambodia (Thinh et al., 2010b; Mittermeier et al., 2013; Roos, 2016; Rowe and Myers, 2016). However, the genus has a restricted distribution in China, being found only in the southwest of the country (N. concolor in western Yunnan, N. nasutus in southern Yunnan and southwestern Guangxi, N. leucogenys in south Yunnan, and N. hainanus on the island of Hainan; Mittermeier et al., 2013). No gibbons occur in the Chongzuo area today, and the nearest populations of Nomascus (i.e., N. nasutus) are located more than 100 km away in the Bangliang Nature Reserve, Jingxi County in western Guangxi and in northern Vietnam (Chan et al., 2008; Mootnick et al., 2012). Nevertheless, historic records indicate that Nomascus had a much wider distribution across southern China in the past (van Gulik, 1967; Gao et al., 1981; Gu, 1989; Gu et al., 1996; Jablonski and Chaplin, 2009; Turvey et al., 2015), and it is likely that gibbons were extirpated in the Chongzuo area in relatively recent times.
In order to test whether the Chongzuo hylobatids have their closest affinities with Nomascus, we conducted a morphometric analysis of the upper and lower molars and compared them with a large sample of extant hylobatids. Our comparative analysis produced mixed results, which is not surprising considering previous reports regarding the great degree of morphological and metrical overlap between species and the difficulty in differentiating hylobatid taxa on the basis of dental characters alone (Frisch, 1973; Jablonski and Chaplin, 2009). In fact, distinctions among hylobatid genera (and species) mostly relate to external features (e.g. pelage coloration and crown and facial hair distribution, throat sac, genitalia), behavior (e.g. vocalizations), and diploid chromosome number (Geissmann, 1995; Groves, 2001), whereas dental and skeletal differences are minor (Frisch, 1965; Maier, 1984; Groves, 2001). The morphological overlap among hylobatid genera, evinced in our EFA PCAs of crown shape, has also been reported in previous multivariate analyses using PCA of hylobatid craniodental variation (Ortiz et al., 2015, 2017; Fan et al., 2017; Turvey et al., 2018). Consequently, conclusions regarding hylobatid affinities are generally centered on CVAs, a multivariate analysis that maximizes the differences between groups.
Despite the mixed results, we consider that the balance of evidence obtained from the range of analyses performed provides support for Zhang et al.’s (2018) conclusion that the Chongzuo teeth can be attributed to Nomascus. The linear measurements, maximum crown area, and cusp areas of the fossils correspond most closely with Nomascus and, to a lesser extent, with Hoolock. The Mahalanobis distances for crown outline also show a clear trend towards smaller morphological distances between the Chongzuo hylobatids and Nomascus (M1, M2, M1/M2, and M1/M2), followed by Hoolock (M2 and M3) and Hylobates (M3), respectively. The CVAs for M3, M2, and M1/M2 performed on the Fourier coefficients reveal that the Chongzuo hylobatids fall within the range of variation of extant Nomascus to the exclusion of all other hylobatid genera, except for a small area of overlap with Hoolock for M2. However, the shape outlines of the Chongzuo M1, M2, and M3 are not captured by the variation observed in the comparative sample. Although the fossil M1s are closer to Nomascus, the M2s and the single M3 datapoint appear to be more similar to Hylobates. No clear pattern was found for M1/M2, although the crown shape of most Chongzuo specimens fall outside the range of variation of extant hylobatids. The posterior probabilities based on shape outline and crown/cusp areas also indicate that most of the fossil teeth can be attributed to Nomascus. It is important to note that the Chongzuo molars not classified as Nomascus were associated with the high frequency of extant Nomascus molars that were misclassified as either Hylobates or Hoolock. Morphometrically, the Chongzuo lower molars are also distinct from those of Bunopithecus sericus from the Pleistocene of central China, and the former sample clearly cannot be assigned to Bunopithecus.
Pairwise Mahalanobis distances between extant taxa are relatively small. The largest values are generally observed between Symphalangus and the other hylobatid genera. The large Mahalanobis distances separating the fossil teeth from extant groups (vs. the small distances derived from pairwise generic comparisons of our extant sample) and the position of the Chongzuo molars in the morphospace for the M1, M2, and M1/M2, implies that the Chongzuo hylobatid teeth are distinct from those of extant taxa, and that they probably represent an extinct species of Nomascus. However, it is important to note that our comparative study did not include specimens of Nomascus nasutus (because they are rare in museum collections), which is the species located geographically closest to Chongzuo, and it is possible that this species may show a greater resemblance to the fossil sample.
Acknowledgments
This research was supported by the Strategic Priority Research Program of Chinese Academy of Science (grant no. XDB26000000), the State Key Laboratory of Palaeobiology and Stratigraphy, Nanjing Institute of Geology and Palaeontology, Chinese Academy of Sciences (grant no. 173132), the Natural Science Foundation of China (grant no. 41702001), and the Natural Science Foundation of Hebei Province (grant no. D2018403098). We thank the following institutions for providing access to skeletal collections: the Natural History Museum (London, UK), the American Museum of Natural History (New York, USA), the National Museum of Natural History (Washington, DC, USA), the Museum of Comparative Zoology (Cambridge, MA, USA), the Kunming Institute of Zoology (Kunming, China), Sun Yat-sen University (Guangzhou, China), and the Institute of Zoology (Beijing, China). Reiko Kono and Eric Delson provided critical comments that helped improve the manuscript.
References
- Bailey S.E. (2002) Neandertal dental morphology: implications for modern human origins. Ph.D. dissertation, Arizona State University.
- Bailey S.E. and Lynch J.M. (2005) Diagnostic differences in mandibular P4 shape between Neandertals and anatomically modern humans. American Journal of Physical Anthropology, 126: 268–277.
- Bailey S.E., Pilbrow V.C., and Wood B.A. (2004) Interobserver error involved in independent attempts to measure cusp base areas of Pan M1s. Journal of Anatomy, 205: 323–331.
- Carbone L., Harris R.A., Gnerre S., Veeramah K.R., Lorente-Galdos B., Huddleston J., Meyer T.J., Herrero J., Roos C., Aken B., et al. (2014) Gibbon genome and the fast karyotype evolution of small apes. Nature, 513: 195–201.
- Carlo J.M., Barbeitos M.S., and Lasker H.R. (2011) Quantifying complex shapes: elliptical Fourier analysis of octocoral sclerites. Biological Bulletin, 220: 224–237.
- Chan B.P.L., Tan X-f., and Tan W-j. (2008) Rediscovery of the critically endangered eastern black crested gibbon Nomascus nasutus (Hylobatidae) in China, with preliminary notes on population size, ecology and conservation status. Asian Primates Journal, 1: 17–25.
- Chan Y-C., Roos C., Inoue-Murayama M., Inoue E., Shih C-C., Pei K.J-C., and Vigilant L. (2010) Mitochondrial genome sequences effectively reveal the phylogeny of Hylobates gibbons. PLoS One, 5: e14419.
- Chan Y-C., Roos C., Inoue-Murayama M., Inoue E., Shih C-C., and Vigilant L. (2012) A comparative analysis of Y chromosome and mtDNA phylogenies of the Hylobates gibbons. BMC Evolutionary Biology, 12: 150.
- Crampton J.S. (1995) Elliptic Fourier shape analysis of fossil bivalves: some practical considerations. Lethaia, 28: 179–186.
- Fabre P.-H., Rodrigues A., and Douzery E.J.P. (2009) Patterns of macroevolution among Primates inferred from a supermatrix of mitochondrial and nuclear DNA. Molecular Phylogenetics and Evolution, 53: 808–825.
- Fan P.-F. and Huo S. (2009) The northern white-cheeked gibbon (Nomascus leucogenys) is on the edge of extinction in China. Gibbon Journal, 5: 44–52.
- Fan P.-F., He K., Chen X., Ortiz A., Zhang B., Zhao C., Li Y.-Q., Zhang H.-B., Kimock C., Wang W.-Z., Groves C., Turvey S.T., Roos C., Helgen K.M., and Jiang X.-L. (2017) Description of a new species of Hoolock gibbon (Primates: Hylobatidae) based on integrative taxonomy. American Journal of Primatology, 79: e22631.
- Ferrario V.F., Sforza C., Tartaglia G.M., Colombo A., and Serrao G. (1999) Size and shape of the human first permanent molar: a Fourier analysis of the occlusal and equatorial outlines. American Journal of Physical Anthropology, 108: 281–294.
- Ferson S., Rohlf F.J., and Koehn R.K. (1985) Measuring shape variation of two-dimensional outlines. Systematic Zoology, 34: 59–68.
- Finstermeier K., Zinner D., Brameier M., Meyer M., Kreuz E., Hofreiter M., and Roos C. (2013) A mitogenomic phylogeny of living primates. PLoS One, 8: e69504.
- Frisch J.E. (1965) Bibliotheca Primatologica No. 3: Trends in the Evolution of the Hominoid Dentition. Karger, Basel.
- Frisch J.E. (1973) The hylobatid dentition. In: Rumbaugh D.M. (ed.), Gibbon and Siamang, Vol. 2: Anatomy, Dentition, Taxonomy, Molecular Evolution and Behavior. Karger, Basel, pp. 55–95.
- Gao Y., Wen H., and He Y. (1981) The change of historical distribution of Chinese gibbons (Hylobates). Zoological Research, 2: 1–8.
- Geissmann T. (1995) Gibbon systematics and species identification. International Zoo News, 42: 467–501.
- Geissmann T. (2007) Status reassessment of the gibbons: results of the Asian Primate Red List Workshop 2006. Gibbon Journal, 3: 5–15.
- Gómez-Robles A., Bermúdez de Castro J.M., Martinón-Torres M., Prado-Simón L., and Arsuaga J.L. (2015) A geometric morphometric analysis of hominin lower molars: Evolutionary implications and overview of postcanine dental variation. Journal of Human Evolution, 82: 34–50.
- Groves C.P. (1972) Systematics and phylogeny of the gibbons. In: Rumbaugh D.M. (ed.), Gibbon and Siamang, Vol. 1: Evolution, Ecology, Behavior and Captive Maintenance. Karger, Basel, pp.1–89.
- Groves C. (2001) Primate Taxonomy. Smithsonian Institution Press, Washington DC.
- Gu Y. (1986) Preliminary research on the fossil gibbon of Pleistocene China. Acta Anthropologica Sinica, 5: 208–219.
- Gu Y. (1989) Preliminary research on the fossil gibbons of the Chinese Pleistocene and Recent. Human Evolution, 4: 509–514.
- Gu Y., Huang W., Chen D., Guo X., and Jablonski N.G. (1996) Pleistocene fossil primates from Luoding Guangdong. Vertebrata PalAsiatica, 34: 235–250.
- Hammer Ø., Harper D.A.T., and Ryan P.D. (2001) PAST: Paleontological statistics software package for education and data analysis. Palaeontologia Electronica, 4: 1–9.
- Harrison T. (1996) The palaeoecological context at Niah Cave Sarawak: evidence from the primate fauna. Bulletin of the Indo-Pacific Prehistory Association, 14: 90–100.
- Harrison T. (2010) Apes among the tangled branches of human origins. Science, 327: 532–534.
- Harrison T. (2016) The fossil record and evolutionary history of hylobatids. In: Reichard U.H., Hirai H., and Barelli C. (eds.), Evolution of Gibbons and Siamang: Phylogeny, Morphology and Cognition. Springer, New York, pp. 91–110.
- Harrison T., Ji X., and Su D. (2002) On the systematic status of the late Neogene hominoids from Yunnan Province, China. Journal of Human Evolution, 43: 207–227.
- Harrison T., Jin C., Zhang Y., Wang Y., and Zhu M. (2014) Fossil Pongo from the early Pleistocene Gigantopithecus fauna of Chongzuo, Guangxi, southern China. Quaternary International, 354: 59–67.
- Hooijer D.A. (1960) Quaternary gibbons from the Malay Archipelago. Zoologische Verhandelingen, 46: 1–42.
- Hooijer D.A. (1961) The orang-utan in Niah Cave pre-history. Sarawak Museum Journal, 9: 408–421.
- Hooijer D.A. (1962) Prehistoric bone: the gibbons and monkeys of Niah Great Cave. Sarawak Museum Journal, 10: 428–449.
- Israfil H., Zehr S.M., Mootnick A.R., Ruvolo M., and Steiper M.E. (2011) Unresolved molecular phylogenies of gibbons and siamangs (Family: Hylobatidae) based on mitochondrial, Y-linked, and X-linked loci indicate a rapid Miocene radiation or sudden vicariance event. Molecular Phylogenetics and Evolution, 58: 447–455.
- Jablonski N.G. and Chaplin G. (2009) The fossil record of gibbons. In: Lappan S. and Whittaker D.J. (eds.), The Gibbons. Springer, New York, pp. 111–130.
- Jablonski N.G., Whitworth M.J., Roberts-Smith N., and Qingqi X. (2000) The influence of life history and diet on the distribution of catarrhine primates during the Pleistocene in eastern Asia. Journal of Human Evolution, 39: 131–157.
- Ji W. and Jiang X. (2004) Primatology in China. International Journal of Primatology, 5: 1077–1092.
- Kuhl F.P. and Giardina C.R. (1982) Elliptic Fourier features of a closed contour. Computer Graphics and Image Processing, 18: 236–258.
- Ledesma F.M., Van der Molen S., and Barón P.J. (2010) Sex identification of Carcinus maenas by analysis of carapace geometrical morphometry. Journal of Sea Research, 63: 213–216.
- Ludeman E.M., Wang W., Li D., Bailey S.E., Harrison T., and Bae C.J. (2015) Elliptical Fourier analysis of two hominoid teeth from Middle Pleistocene Sanxieshan Cave, Daxin, Guangxi, China. Paleoanthropology Society Meeting Abstracts. San Francisco, 14–15 April 2015, p. A18.
- Maier W. (1984) The functional morphology of the gibbon dentition. In: Preuschoft H., Chivers D.J., Brockelman W.Y., and Creel N. (eds.), The Lesser Apes: Evolutionary and Behavioral Biology. Edinburgh University Press, Edinburgh, pp. 180–191.
- Matsudaira K. and Ishida T. (2010) Phylogenetic relationships and divergence dates of the whole mitochondrial genome sequences among three gibbon genera. Molecular Phylogenetics and Evolution, 55: 454–459.
- Matthew W.D. and Granger W. (1923) New fossil mammals from the Pliocene of Sze-chuan, China. Bulletin of the American Museum of Natural History, 48: 563–598.
- Mittermeier R.A., Rylands A.B., and Wilson D.E. (2013) Handbook of the Mammals of the World, Vol. 3: Primates. Lynx Edicions, Barcelona.
- Mootnick A. and Groves C. (2005) A new generic name for the hoolock gibbon (Hylobatidae). International Journal of Primatology, 26: 971–976.
- Mootnick A.R., Chan B.P.L., Moisson P., and Nadler T. (2012) The status of the Hainan gibbon Nomascus hainanus and the Eastern black gibbon Nomascus nasutus. International Zoo Yearbook, 46: 259–264.
- Ortiz A., Pilbrow V., Villamil C.I., Korsgaard J.G., Bailey S.E., and Harrison T. (2015) The taxonomic and phylogenetic affinities of Bunopithecus sericus a fossil hylobatid from the Pleistocene of China. PLoS One, 10: e0131206.
- Ortiz A., Villamil C.I., Kimock C.M., He K., and Harrison T. (2017) Tracking hylobatid taxonomic diversity from molar morphometrics. American Journal of Physical Anthropology, 162: 306.
- Pan Y. (2006) Primates Linnaeus 1758. In: Qi G. and Dong W. (eds.), Lufengpithecus hudienensis Site. Science Press, Beijing, pp. 131–148.
- Perelman P., Johnson W.E., Roos C., Seuánez H.N., Horvath J.E., Moreira M.A.M., Kessing B., Pontius J., Roelke M., Rumpler Y., Schneider M.P.C., Silva A., O’Brien S.J., and Pecon-Slattery J. (2011) A molecular phylogeny of living primates. PLoS Genetics, 7: e1001342.
- Pilbrow V.C. (2003) Dental variation in African apes with implications for understanding patterns of variation in species of fossil apes. Ph.D. dissertation, New York University.
- R Core Team (2015) R: A Language and Environment for Statistical Computing. R Foundation for Statistical Computing, Vienna, Austria. http://www.R-project.org/
- Rohlf F.J. (2016) TpsDig Ver. 2.32. Stony Brook Morphometrics, http://life.bio.sunysb.edu/morph
- Rohlf F.J. and Archie J.W. (1984) A comparison of Fourier methods for the description of wing shape in mosquitoes (Diptera: Culicidae). Systematic Zoology, 33: 302–317.
- Roos C. (2016) Phylogeny and classification of gibbons (Hylobatidae). In: Reichard U.H., Hirai H., and Barelli C. (eds.), Evolution of Gibbons and Siamang: Phylogeny, Morphology, and Cognition. Springer, New York, pp. 151–164.
- Rowe N. and Myers M. (2016) All the World’s Primates. Pogonias Press, Charlestown.
- SAS Institute Inc. (2016) JMP® Pro Version 13. SAS Institute Inc., Cary, NC.
- Schmittbuhl M., Rieger J., Le Minor J.M., Schaaf A., and Guy F. (2007) Variations of the mandibular shape in extant hominoids: generic, specific, and subspecific quantification using elliptical Fourier analysis in lateral view. American Journal of Physical Anthropology, 132: 119–131.
- Schneider C.A., Rasband W.S., and Eliceiri K.W. (2012) NIH Image to ImageJ: 25 years of image analysis. Nature Methods, 9: 671–675.
- Springer M.S., Meredith R.W., Gatesy J., Emerling C.A., Park J., Rabosky D.L., Stadler T., Steiner C., Ryder O.A., Janečka J.E., Fisher C.A., and Murphy W.J. (2012) Macroevolutionary dynamics and historical biogeography of primate diversification inferred from a species supermatrix. PLoS One, 7: e49521.
- Swindler D.R. (2002) Primate Dentition. Cambridge University Press, Cambridge.
- Takai M., Zhang Y., Kono R.T., and Jin C. (2014) Changes in the composition of the Pleistocene primate fauna in southern China. Quaternary International, 354: 75–85.
- Thinh V.N., Mootnick A.R., Geissmann T., Li M., Ziegler T., Agil M., Moisson P., Nadler T., Walter L., and Roos C. (2010a) Mitochondrial evidence for multiple radiations in the evolutionary history of small apes. BMC Evolutionary Biology, 10: 74.
- Thinh V.N., Rawson B., Hallam C., Kenyon M., Nadler T., Walter L., and Roos C. (2010b) Phylogeny and distribution of crested gibbons (genus Nomascus) based on mitochondrial cytochrome b gene sequence data. American Journal of Primatology, 72: 1047–1054.
- Turvey S.T., Crees J.J., and Di Fonzo M.M.I. (2015) Historical data as a baseline for conservation: reconstructing long-term faunal extinction dynamics in Late Imperial-modern China. Proceedings of the Royal Society B, 282: 20151299.
- Turvey S.T., Bruun K., Ortiz A., Hansford J., Hu S., Ding Y., Zhang T., and Chatterjee H.J. (2018) New genus of extinct Holocene gibbon associated with humans in Imperial China. Science, 360: 1346–1349.
- van Gulik R.H. (1967) The Gibbon in China: An Essay in Chinese Animal Lore. Brill, Leiden.
- Wood B.A. and Engleman C.A. (1988) Analysis of the dental morphology of Plio-Pleistocene hominids. V. Maxillary postcanine tooth morphology. Journal of Anatomy, 161: 1–35.
- Zhang Y., Kono R.T., Wang W., Harrison T., Takai M., Ciochon R.L., and Jin C. (2015) Evolutionary trend in dental size in Gigantopithecus blacki revisited. Journal of Human Evolution, 83: 91–100.
- Zhang Y., Jin C., Wang Y., Ortiz A., He K., and Harrison T. (2018) Fossil gibbons (Mammalia, Hylobatidae) from the Pleistocene of Chongzuo, Guangxi, China. Vertebrata PalAsiatica, 56: 248–263.

