Abstract
The Funadomari Jomon people were hunter-gatherers living on Rebun Island, Hokkaido, Japan c. 3500–3800 years ago. In this study, we determined the high-depth and low-depth nuclear genome sequences from a Funadomari Jomon female (F23) and male (F5), respectively. We genotyped the nuclear DNA of F23 and determined the human leukocyte antigen (HLA) class-I genotypes and the phenotypic traits. Moreover, a pathogenic mutation in the CPT1A gene was identified in both F23 and F5. The mutation provides metabolic advantages for consumption of a high-fat diet, and its allele frequency is more than 70% in Arctic populations, but is absent elsewhere. This variant may be related to the lifestyle of the Funadomari Jomon people, who fished and hunted land and marine animals. We observed high homozygosity by descent (HBD) in F23, but HBD tracts longer than 10 cM were very limited, suggesting that the population size of Northern Jomon populations were small. Our analysis suggested that population size of the Jomon people started to decrease c. 50000 years ago. The phylogenetic relationship among F23, modern/ancient Eurasians, and Native Americans showed a deep divergence of F23 in East Eurasia, probably before the split of the ancestor of Native Americans from East Eurasians, but after the split of 40000-year-old Tianyuan, indicating that the Northern Jomon people were genetically isolated from continental East Eurasians for a long period. Intriguingly, we found that modern Japanese as well as Ulchi, Korean, aboriginal Taiwanese, and Philippine populations were genetically closer to F23 than to Han Chinese. Moreover, the Y chromosome of F5 belonged to haplogroup D1b2b, which is rare in modern Japanese populations. These findings provided insights into the history and reconstructions of the ancient human population structures in East Eurasia, and the F23 genome data can be considered as the Jomon Reference Genome for future studies.
Introduction
The origin of modern Japanese populations has been debated among anthropologists, archaeologists, and human population geneticists. One of the main issues lacking clarity is the origin of the Jomon people. The Jomon period lasted from about 16000 to 2900 years ago (Habu, 2004; Fujio, 2015), and the Jomon people were the prehistoric natives of the Japanese islands during that period. It has long been debated whether the ancestors of the Jomon people migrated from Southeast Asia or from the northern part of East Asia.
From morphological studies of human bones and teeth, the Jomon people are thought to have originated in Southeast Asia (Turner, 1987; Hanihara, 1991; Matsumura, 2007; Matsumura and Oxenham, 2014; Matsumura et al., 2019), whereas morphological analyses (Hanihara and Ishida, 2009) and genetic studies of contemporary Japanese populations (Nei, 1995; Omoto and Saitou, 1997) have suggested that the Jomon people originated in northern Asia. However, the genetic characteristics of the Jomon people have been indirectly inferred from modern populations in Ainu and Okinawa, who were considered to have retained more Jomon ancestry than any other populations (Hanihara, 1991).
Since the 1990s, DNA retrieved from ancient human remains offer an approach that complements morphometric analysis and modern genetic data for understanding the relationships among past populations. DNA of the Jomon people was first analyzed by Horai et al. (1989). In earlier studies, mitochondrial DNA (mtDNA) was analyzed due to technical limitations of investigating low copy number DNA of ancient samples (Adachi et al., 2009). However, mtDNA is maternally inherited as a single unit without recombination. Therefore, mtDNAs are subject to chance events, such as random genetic drift, as well as gene flow and positive selection. The amount of information we can infer about social systems, such as kinship, origin, and the formation of past populations, using only mtDNA sequence data is limited.
As methods for analyzing ancient DNA have improved, whole-genome sequencing studies have become feasible (e.g. Green et al., 2010; Rasmussen et al., 2010). Next-generation sequencing technology (NGS) has enabled reconstruction of the nuclear genome of ancient human individuals. Genome-wide analysis of single nucleotide polymorphisms (SNPs) provides a powerful tool for estimating population ancestry, and many studies (e.g. Japanese Archipelago Human Population Genetics Consortium, 2012; Lazaridis et al., 2014) have shown that SNPs can be used not only to infer the geographic origin of a specific population but also to obtain information on the formation of regional groups with great accuracy. In addition, high-quality sequences of ancient nuclear genomes have enabled the inference of population size changes, social systems such as pedigree structure, risk of disease, and physical characteristics of ancient humans (e.g. Keller et al., 2012; Olalde et al., 2014; Sikora et al., 2017; Moreno-Mayar et al., 2018).
Kanzawa-Kiriyama et al. (2017) reported the first successful partial nuclear genome sequence of the Jomon people. The genome-wide analysis of ancient DNA data has provided a new source of information regarding the origins of the Jomon people. Our findings clarified that the Jomon people are phylogenetically basal to modern East Eurasians and that their DNA was inherited by modern Japanese populations. However, the depth and breadth of the nuclear genome coverage of the DNA sample analyzed in our previous work were not sufficient to fully understand the genetic characteristics of the Jomon people.
Here, we report the high-quality nuclear genome sequence of a Jomon female and a low-coverage genome sequence of a Jomon male obtained from the Funadomari site on Rebun Island, Hokkaido, Japan. The results of morphological and mtDNA analyses of the skeletal remains excavated from this site have already been reported (Matsumura et al., 2001; Adachi et al., 2009). Although Rebun Island is located at the northernmost tip of Hokkaido, the morphological characteristics (metric and nonmetric cranial traits) and dental measurements of these skeletons are similar to those of other Jomon skeletal remains from the geographically distant Honshu and Hokkaido (Matsumura et al., 2001). Additionally, the mtDNA haplogroups were also typical for Jomon individuals (Adachi et al., 2011). To obtain more detailed information about the demographic histories of the Jomon people and their relationships with contemporary human populations, we applied multiple population genetics tests using high-confidence SNPs extracted from the Funadomari Jomon DNAs. Additionally, we used functional SNP assessments to assign possible phenotypic characteristics to our sample. Analysis of Y-chromosome polymorphisms in the Funadomari male sample has also shed light on the male genealogy of the Jomon people.
Materials and Methods
Samples
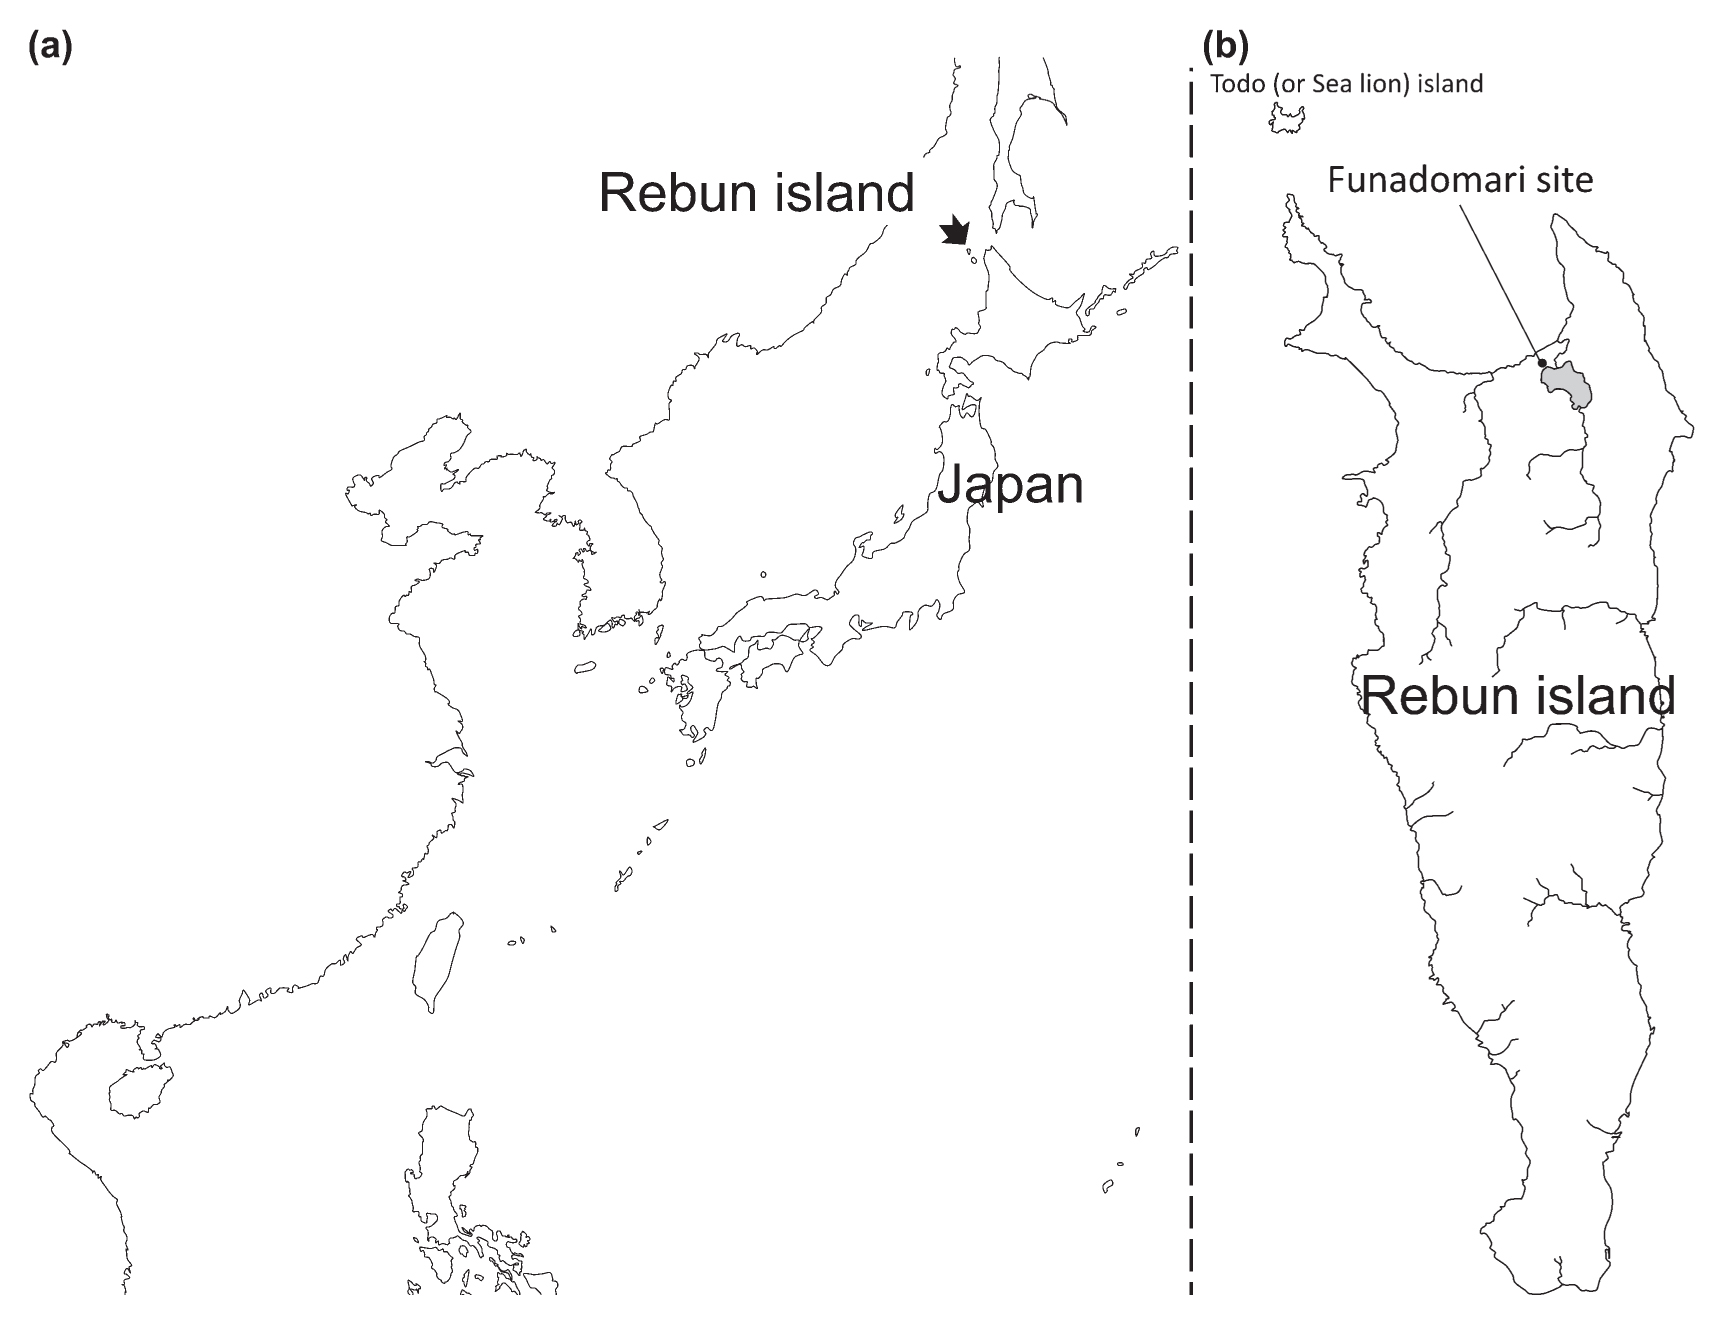
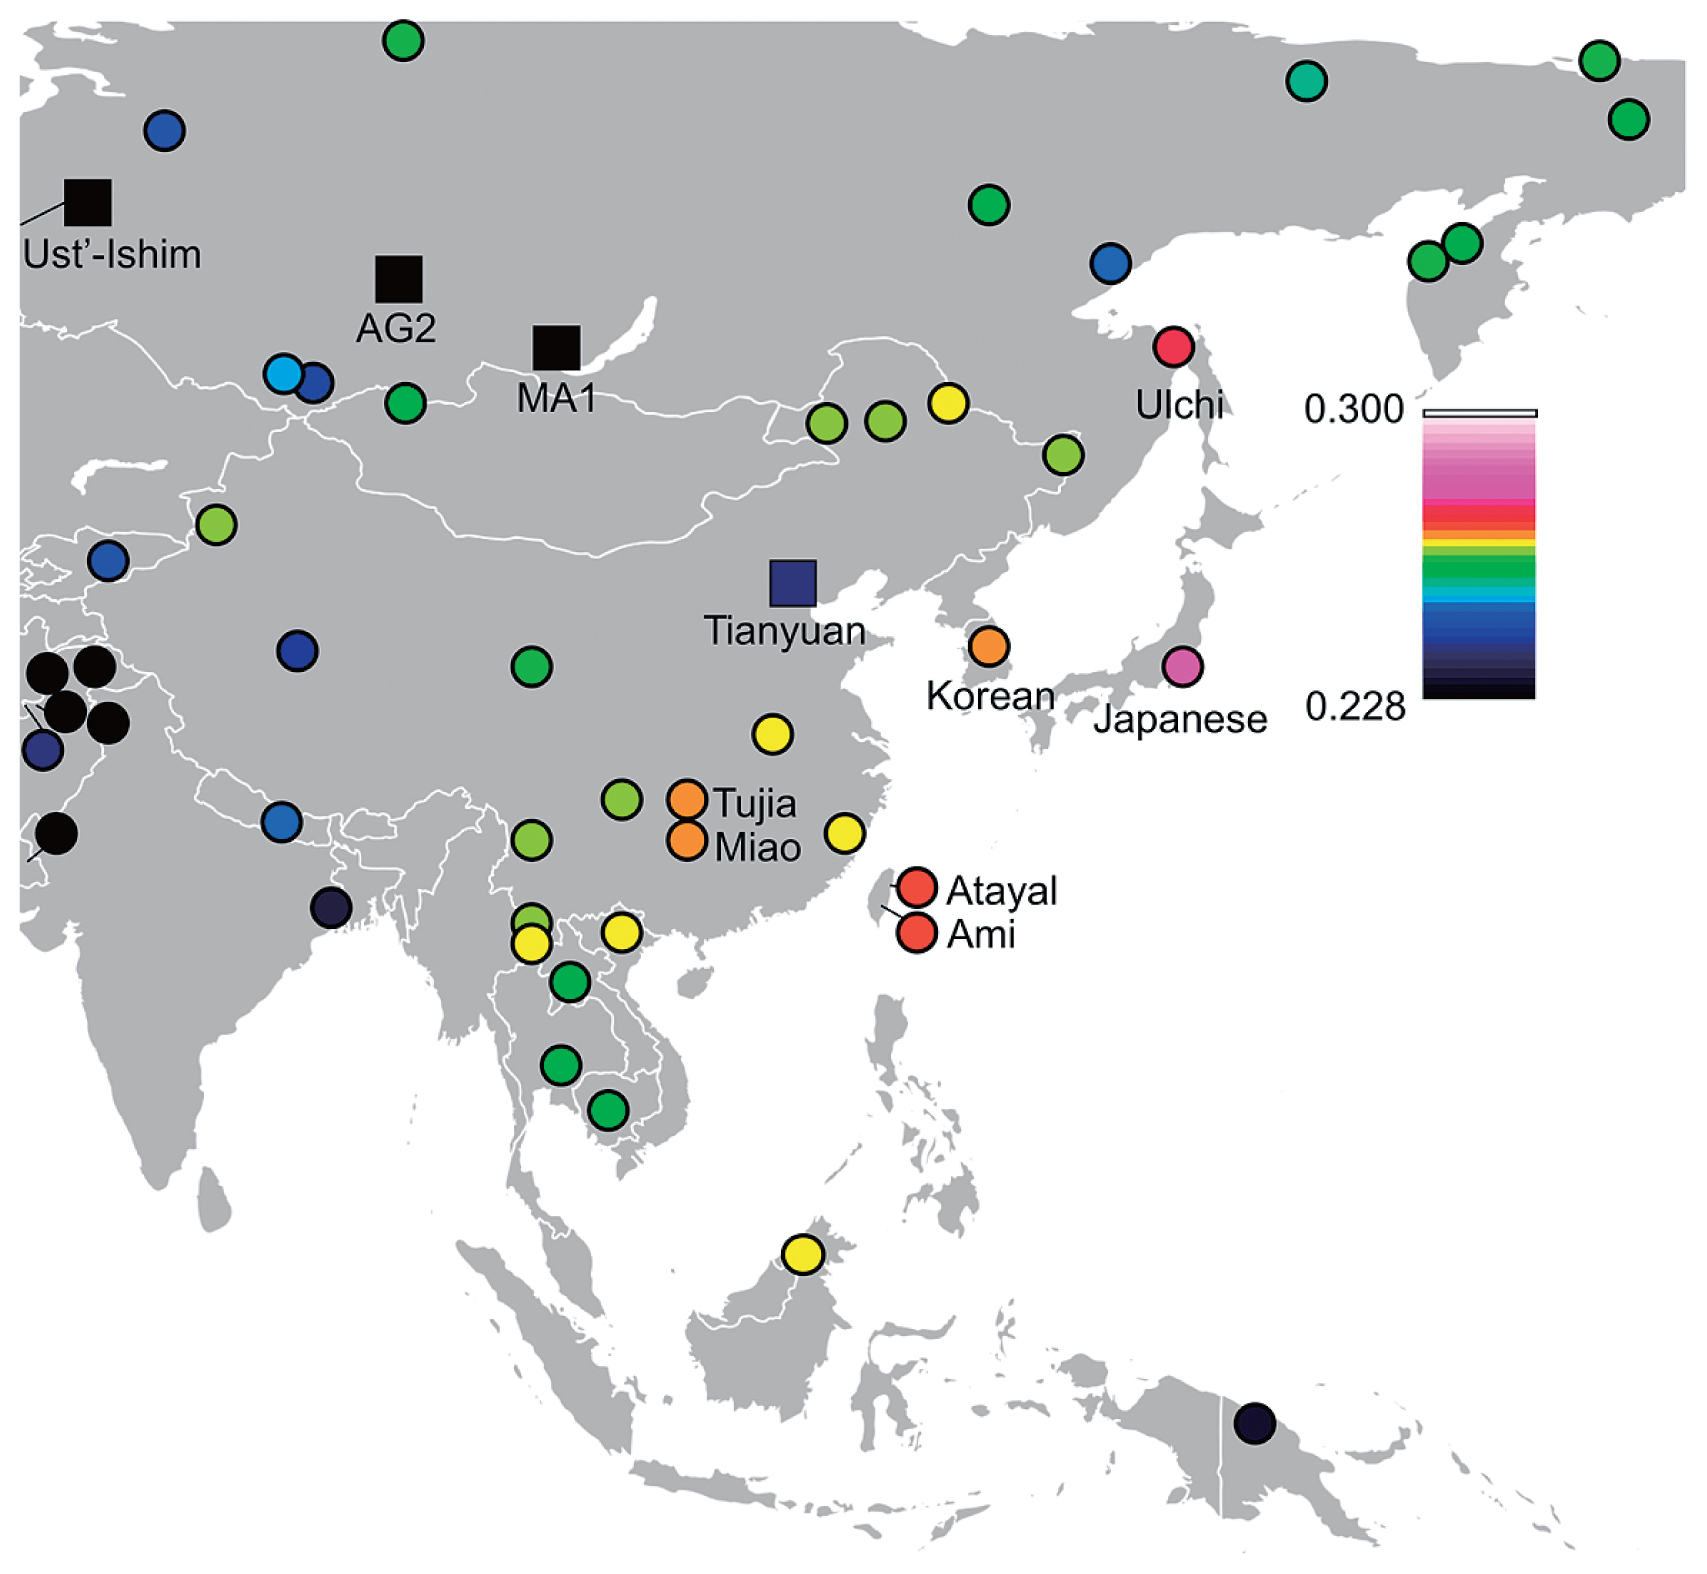
The skeletons that were analyzed in the current study were excavated in 1998 (Nishimoto, 2000) from the Funadomari shell mound, which is located in the northern part of Rebun Island (Figure 1). The two skeletons were housed at Sapporo Medical University and were dated to 3500–3800 years ago based on C14 dating of charcoal from the hearth (Nishimoto, 2000). From the stable isotope value for one of the samples (F23), we inferred the source of diet to be a mixture of marine and land animals. We calculated F marine from the proportion of marine animal (δ 13C = −12.5‰) and land animal (δ 13C = −21.0‰). The age of F23 was also dated to be 3550–3960 cal BP (Paleo Labo Co., Ltd.) (Supplementary Table 1). These values are consistent with “the late Jomon period” according to pottery-based dating (Nishimoto, 2000). We extracted DNA from the left second and right first mandible molar teeth of Funadomari No. 5 (F5) and No. 23 (F23), respectively. Their DNA was exceptionally well preserved (Adachi et al., 2009). In the previous study (Adachi et al., 2009), we used the dental pulp and the dentin around the dental cavity for DNA extraction. These DNA samples were obtained by drilling the tooth of each skeleton from the apical foramen. In the present study, we used the residual tooth powder of F5 and F23 that have been stored at −70°C at the Department of Legal Medicine, University of Yamanashi since 2009.
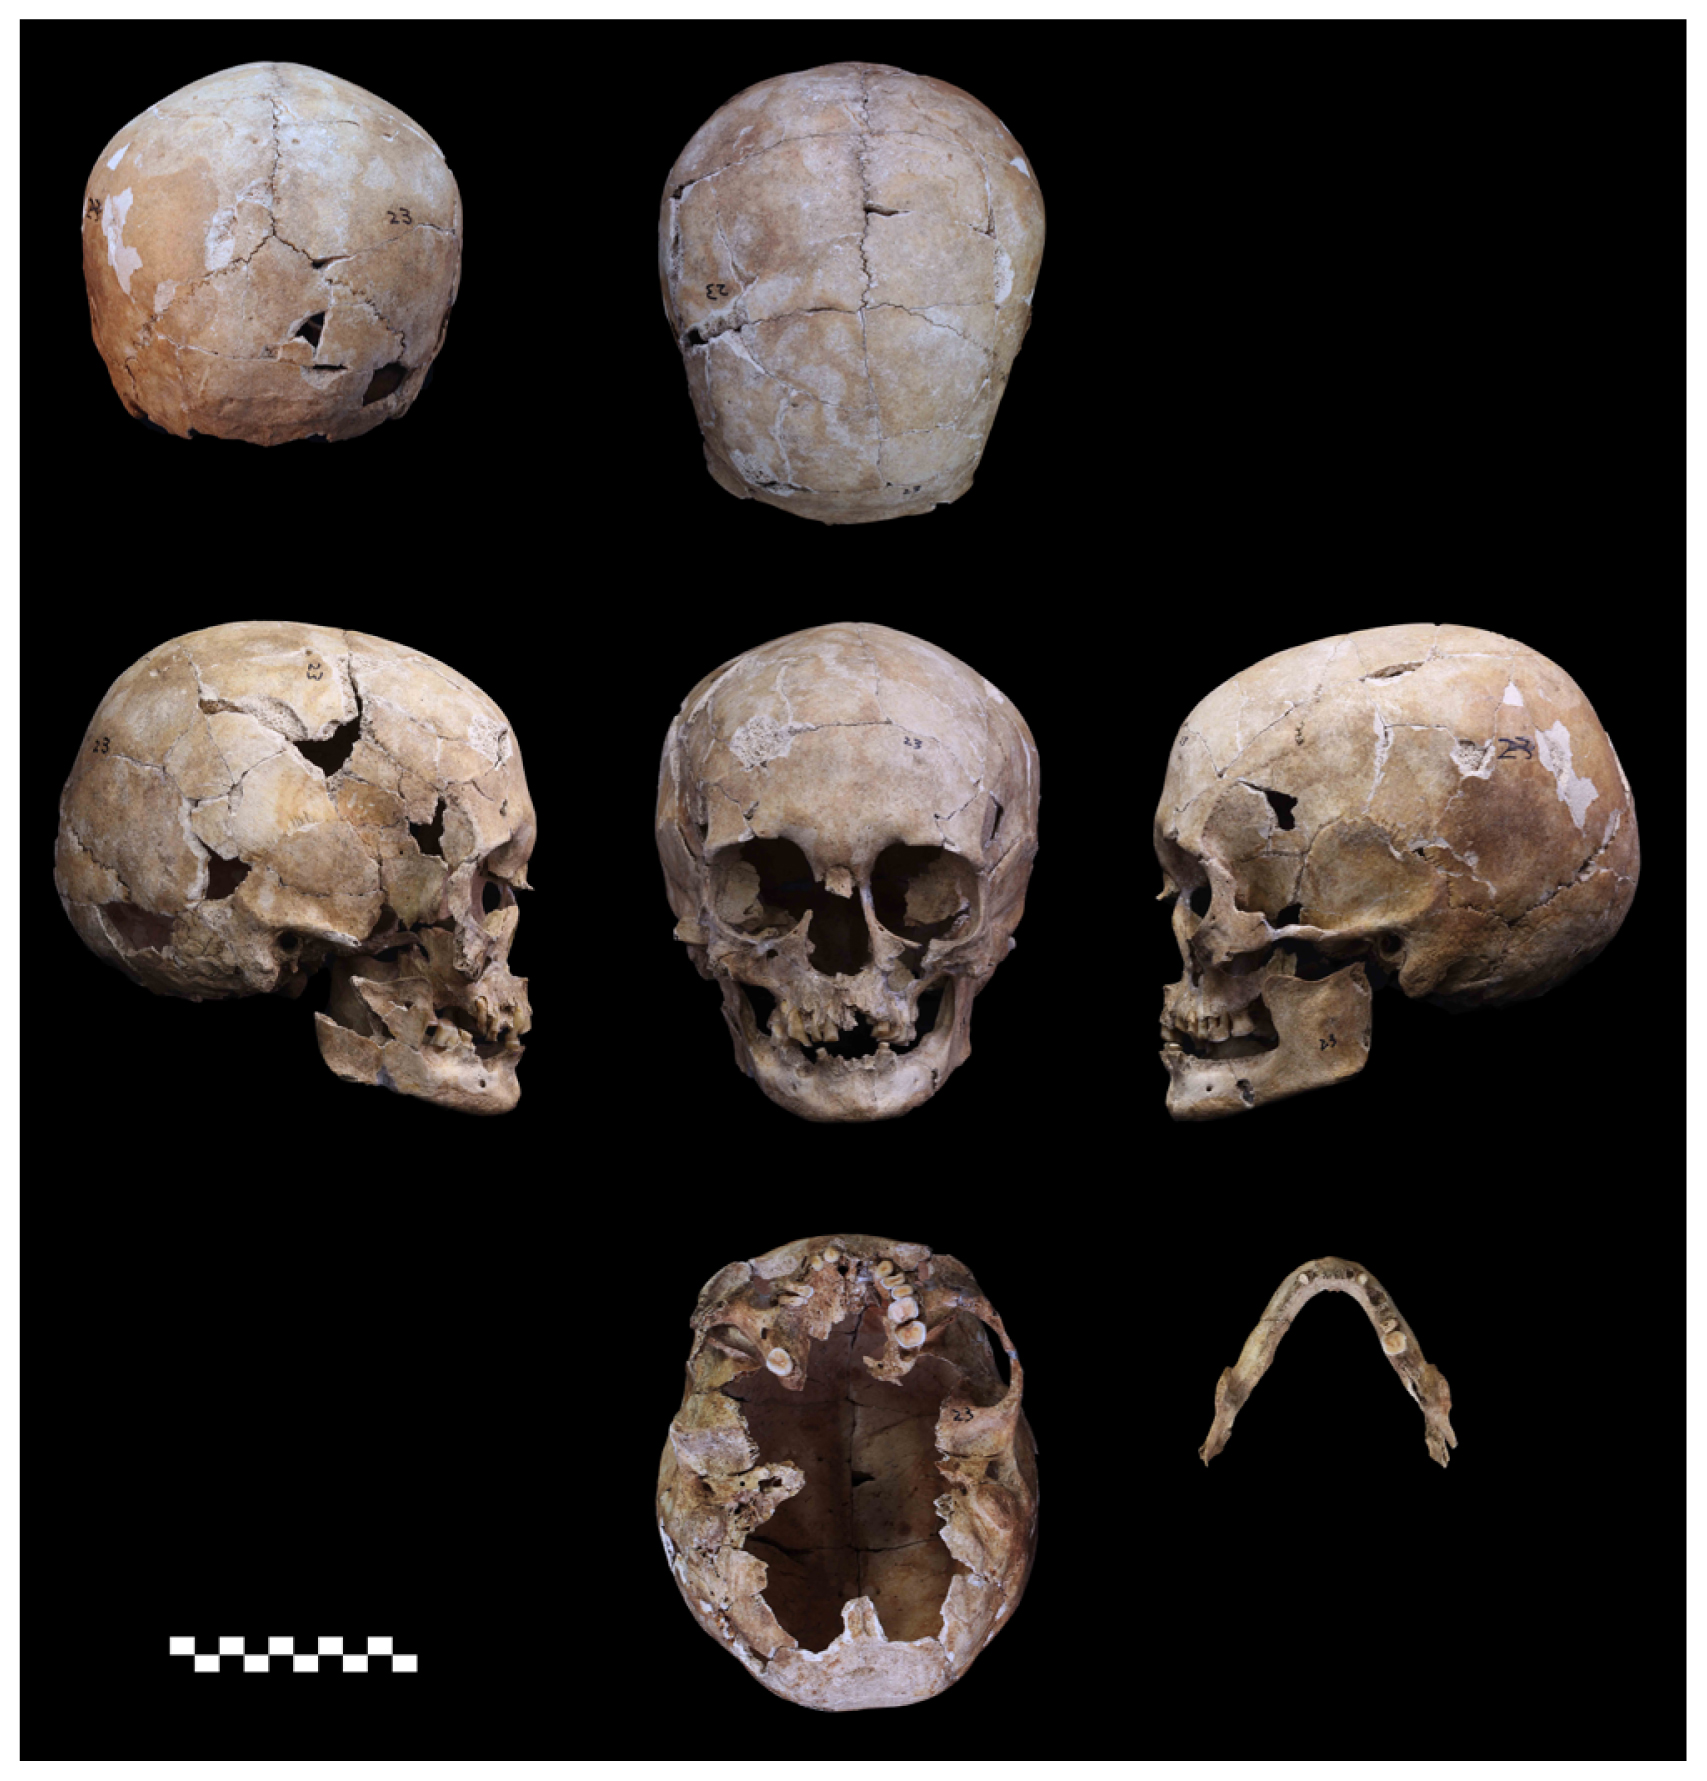
DNA from F5 and F23 (Figure 2) was extracted according to the methods described by Adachi et al. (2018) in the laboratory dedicated specifically for ancient DNA analyses at the University of Yamanashi. Briefly, the powdered sample was decalcified with 0.5 M EDTA (pH 8.0) at 56°C for 24 h, and the buffer was replaced with a fresh solution and decalcified again at 56°C for 36 h. Thereafter, the decalcified samples were lysed in 1000 μl of Genomic Lyse buffer (Genetic ID, Fairfield, IA, USA) and digested with 50 μl of 20 mg/ml proteinase K at 56°C overnight. Finally, the lysate was treated twice with 1500 μl phenol–chloroform–isoamyl alcohol (25:24:1) (Thermo Fisher Scientific, Waltham, MA, USA) and 1500 μl chloroform (Wako Pure Chemical Industries, Osaka, Japan). DNA was extracted from the lysate using a FAST ID DNA extraction kit (Genetic ID) in accordance with the manufacturer’s protocol.
Following the protocol of Shinoda et al. (2017), which was modified from the protocol of Kanzawa-Kiriyama et al. (2017), three and seven DNA libraries were prepared from DNA extracts of F5 and F23, respectively. For creating blunt-ends and adding a terminal 3′ adenine and adapter ligations, we used a GS Titanium Rapid Library Preparation kit (454 Life Science Corporation, Branford, CT, USA). The conditions for the generation of blunt-ends and addition of adenine were 20 min at 25°C, 20 min at 12°C, and 20 min at 72°C, with a hold at 4°C. For the adapter ligation, we used 1 μl of Illumina LT Set A adapter mix diluted to 10× using water or 2 μl of 10 μM short adapter designed by Shinoda et al. (2017) with 7 μl of 50% PEG-4000 (Hampton Research, Aliso Viejo, CA, USA). The short adapter was prepared by hybridizing two oligonucleotides (Short_Adapter_1: 5′-ACACTCTTTCCCTACACGACGCTCTTCCGATC-phosphorothioate-T-3′ and Short_Adapter_2: 5′-PHO-GATCGGAAGAGCACACGTCTGAACTCCAGTCAC-3′) as follows. In a polymerase chain reaction (PCR) tube, 20 μl of 500 μM CL53, 20 μl of 500 μM CL73, 9.5 μl TE (10 mM Tris–HCl, pH 8.0), and 0.5 μl of 5 M NaCl were combined. This mixture was incubated for 10 s at 95°C in a thermal cycler and cooled to 14°C at 0.1°C/s. A final concentration of 100 μM was obtained by dilution with 50 μl TE. The ligation was carried out for 3 h at 25°C. We purified the post-ligated solutions using the QIAquick PCR purification kit (Qiagen, Hilden, Germany) and eluted the ligated samples in 30 μl elution buffer (EB). When using the short-adapter, we diluted the post-ligated solution 3-fold with water and then used AMpureXP (Beckman Coulter, Brea, CA, USA) for purification. The entire volume of the purified library was used for PCR to complete the library preparation. We mixed 50 μl of the DNA library, 50 μl Multiplex PCR Master Mix (Qiagen), and 1000 nM of each multiplexing PCR primer and dispensed the mixture into two 200 μl single PCR tubes. Cycling conditions were as follows: 15 min at 95°C; 12 cycles of 30 s at 95°C, 30 s at 65°C, and 30 s at 72°C, with a final extension at 72°C for 10 min. The first PCR products were purified with an AMpureXP kit and eluted in 50 μl EB. A second-round of PCR was set up as follows: 10 μl product from the first PCR, 10 μl of 10× AccuPrime Pfx Reaction Mix, 1000 nM of each multiplexing PCR primer, 2.5 U of AccuPrime Pfx DNA polymerase (Thermo Fisher Scientific), and H2O were mixed to obtain a final reaction volume of 100 μl. We dispensed the mixture into two 200 μl PCR tubes. Cycling conditions were as follows: 95°C for 2 min; 8–12 cycles of 95°C for 15 s, 60°C for 30 s, and 68°C for 30 s; and a hold at 4°C. The second PCR products were purified with a QIAquick PCR purification kit and eluted in 50 μl EB. The purified libraries were quantified with an Agilent 2100 Bioanalyzer DNA High-Sensitivity chip (Agilent Technologies, Santa Clara, CA, USA) for sequencing.
Sequencing and sequence mapping
DNA sequencing was conducted for the DNA libraries on an Illumina 2500 platform using a paired-end run with 100 cycles at Hokkaido System Science Co., Ltd. (Sapporo, Japan). After trimming the adapter sequence with CutAdapt (Martin, 2011) (−q 25 −m 35 -a AGATCGGAAGAGC -A AGATCGGAAGAGC), the remaining paired reads were mapped to the human reference genome (hs37d5) using BWA (http://bio-bwa.sourceforge.net/index.shtml; mem -M) (Li and Durbin, 2009). The frequencies of mapped reads were examined using SAMtools (http://samtools.sourceforge.net/index.shtml), with the flagstat option (Li et al., 2009). Mapped reads with a mapping quality of 30 or more were retained, sorted, and merged. We then checked the insert size of paired reads, and exceptionally long reads were removed to exclude mismapped reads (≤400 for F5 and ≤500 for F23). PCR duplicates were removed using Picard MarkDuplicates (version 1.119; http://broadinstitute.github.io/picard/). After eliminating hard-clipped and soft-clipped reads and trimming three bases in the termini of the reads using BamUtil software (http://genome.sph.umich.edu/wiki/BamUtil), the resulting aligned reads were realigned using GATK IndelRealigner (--consensusDeterminationModel KNOWNS_ONLY -LOD 0.4) and recalibrated using GATK BaseRecalibrator. We then examined read length distributions for F5 and F23 based on the insert size.
Metagenomic analysis
We performed metagenomic analysis to check for nonhuman DNA contamination. The reads were first preprocessed with the ‘tantan’ repeat masker (Frith, 2011) using options ‘x N –r 0.0005.’ The reads were then mapped to the reference human genome build GRCh38.p11, accession GCF_000001405.37, from RefSeq (O’Leary et al., 2016) with minimap2 (Li, 2018) using options ‘–x sr.’ The reads that failed to map were extracted as the ‘nonhuman’ read set. A subset of 100000 of such reads (about 10 Mbp) from each sample was then analyzed with BLAST (https://www.ncbi.nlm.nih.gov/BLAST/) using parameters ‘blastn –task blastn–dust no –evalue 3.80e–2 –dbsize 3200000000’ (Altschul et al., 1997). The BLAST search was performed against available GenBank (NCBI Resource Coordinators, 2018) and RefSeq (O’Leary et al., 2016) genome assemblies, obtained via the GenomeSync database (http://genomesync.org/). Overall, 143139 genomes were used, totaling about 1.73 Tbp of sequence. The search was performed and analyzed with the Genome Search Toolkit (http://kirill-kryukov.com/study/tools/gstk/). The reads were taxonomically classified by determining their specificity taxa; a read was labeled as specific to a taxon if it had more significant BLAST hits to genomes within this taxon compared with its hits in all other genomes. KronaTools (Ondov et al., 2011) was used for visualizing the results.
Mitochondrial genome analysis
We used GATK HaplotypeCaller to call variant sites for mitochondrial genomes (-stand_call_conf 30 -stand_emit_conf 10). We manually compared the list of variants with SNPs reported in phylotree-Build 17 (van Oven and Kayser, 2009) to determine mtDNA haplogroups. Based on the haplogroups, the resulting list of variants was double-checked using IGV software (Thorvaldsdóttir et al., 2013). Mitochondrial genome consensus sequences were prepared using GATK FastaAlternateReferenceMaker and used for later contamination estimates.
Sex determination and Y chromosome analysis
We first determined the sex of F5 and F23 by counting the number of sequence reads mapped to X and Y chromosomes. The size of the X chromosome is 10 times larger than that of the Y chromosome in the human reference genome, meaning that if the ancient individual was male, the X:Y ratio of mapped reads would be close to 10:1.
For Y chromosome analysis, we retrieved the human Y chromosome nucleotide sites registered at the International Society of Genetic Genealogy (ISOGG) website (https://isogg.org/tree/ISOGG_YDNA_SNP_Index.html) and then prepared an mpileup file of F5 overlapping with the listed nucleotide sites. We then determined the haplogroup classification of F5 and compared the F5 Y chromosome sequence and 60505 SNP sites listed in 1000 genome project Y chromosome data (ftp://ftp.1000genomes.ebi.ac.uk/vol1/ftp/release/20130502/ALL.chrY.phase3_integrated_v2a.20130502.genotypes.vcf.gz); 24391 SNP site data were shared between them. A phylogenetic tree was generated for these sequences using MEGA7 (Kumar et al., 2016) with the following parameters: Tamura-Nei model, uniform rates, using all sites.
DNA authenticity analysis and error rate estimation
To clarify the authenticity of the mapped sequence reads, we checked the frequency of postmortem misincorporation and depurination, which are characteristic of ancient DNA, with mapDamage2.0 (Jónsson et al., 2013). After confirming the authenticity, we estimated the contamination frequency for mtDNA and for nuclear DNA sequences. For mtDNA, we followed the methods used by Kanzawa-Kiriyama et al. (2017), in which the consistency of reads mapping to the SNPs of mtDNA haplogroups and individual specific mutations was estimated. We also used Schmutzi software (cont-Deam.pl --library single) (Renaud et al., 2015), a tool that uses a Bayesian maximum as an a posteriori algorithm to estimate mtDNA contamination. For nuclear DNA, we used ANGSD software (‘MoM’ estimate from ‘Method 1’ and the ‘new_llh’ likelihood computation) (Korneliussen et al., 2014), which estimates contamination based on the X chromosome polymorphism rate in males. We followed the criteria of Fu et al. (2016), stating that libraries are effectively uncontaminated if their X chromosome contamination estimates are less than 2.5%. We also estimated the error rate based on the excess of derived alleles in ancient samples using ANGSD software (-doAncError -anc hg19ancNoChr.fa -ref hs37d5.fa). For error rate estimates, data in which 3–10 bases were trimmed from sequence termini were used.
Haplotype-based analysis
Panel construction
We estimated the haplotype phase of F23 with a statistical approach. We first downloaded seven Tibetan (of seven regional Tibetan populations, we randomly sampled one individual per population) and five Sherpa genomes from the Genome Sequence Archive (GSA: PRJCA000246) (Lu et al., 2016) and then mapped and filtered the sequences by following the workflow of Mallick et al. (2016). To obtain an accurate result, we phased the F23 genotype data with diverse population genotype data. Thus, genotypes were determined for F23 in addition to 278 samples from the Simons Genome Diversity Project (SGDP) (Mallick et al., 2016), seven and five samples of Tibetan and Sherpa, respectively (Lu et al., 2016), Altai Neanderthal (Prüfer et al., 2014), and Denisovan (Meyer et al., 2012) using the HaplotypeCaller algorithm implemented in GATK3.8 with the ‘-ERC GVCF’ option. The second method for genotype calling was conducted with gVCF format files using the GenotypeGVCF program of GATK3.8. We then applied the variant quality score recalibration (VQSR) approach to obtain the same degree of genotype call sensitivity between F23 and modern humans. VQSR was applied to the raw genotype call set using the Hapmap and 1000 Genomes Omni2.5 sites as true datasets, high-confidence SNPs from 1000 genome sites as training datasets, and dbSNP138 sites as known datasets. The variant sites were filtered at 99% sensitivity. In addition, for Altai Neanderthal and Denisovan, genotypes with genotype quality (GQ) less than 20 were masked as no call variants. We further removed the variant sites for haplotype phasing when the call rate was less than 97%, the genotype frequency deviated from the Hardy–Weinberg equilibrium (P < 0.00001), or only one heterozygous genotype was observed among the whole data set.
Identical by descent (IBD) and homozygosity by descent (HBD) detection
The segments of IBD and HBD were detected using IBD-seq (Browning and Browning, 2013) with default settings (ibdlod = 3.0, r2window = 500, and r2max = 0.15). The physical lengths of each IBD and HBD segment (in base pairs) were converted into genetic distances (in centimorgans, cM) by extrapolating the genetic map provided by HapMap (International HapMap Consortium, 2005). The lengths of IBD segments for each sample were summarized for each paired sample. These procedures were also applied to the simulated data set to see the impact of small population size on HBD length distribution. Thus, we simulated a scenario of a population with a small population size after Out-of-Africa. The population size was 20000 before 7700 generations ago and then decreased to 10000, 5000, and 200 at 7700, 2500, and 100 generations ago, respectively. The coalescent simulation was conducted with MaCS (Chen et al., 2009) to generate 10 samples (20 haploids). The genome was assumed to have the same length as hg19, and the recombination map of HapMap was used. The mutation rate was assumed to be constant across the genome (10−8/bp/generation). Differences in the distributions of IBD segments between two samples were tested by the two-sample Kolmogorov–Smirnov test using the ks.test function implemented in R version 3.4.2.
ChromoPainter and fineSTRUCTURE analysis
Local ancestry deconvolution analysis was conducted using ChromoPainter V2 and fineSTRUCTURE version 2.1.3 (Lawson et al., 2012). Haplotype phases were estimated from panel data using Eagle version 2.3.2 (Loh et al., 2016) with default settings to conduct these analyses. Clustering analysis was conducted based on the haplotypes of panel data using fineSTRUCTURE. The matrices of chunk counts were estimated by ChromoPainter for each sample as recipients using each SGDP population as donors to estimate the S-statistics of Skoglund et al. (2015), as follows:
|
S
(
D
;
R
,
F
23
)
=
(
C
R:D
-
C
F
23
:D
)
/
(
C
R:D
+
C
F
23
:D
)
, |
where CR:D is the average chunk count of samples in recipient population R copied from donor population D, and CF23:D is the chunk count of F23 copied from D.
Human leukocyte antigen (HLA) allele inference
Read sequences were extracted from BAM files of F23 together with unmapped reads. Using the resulting FASTQ files, HLA alleles were estimated with HLA-VBseq (Nariai et al., 2015) with reference sequences provided by the IMGT/HLA database (release 3.29). We selected HLA alleles with the top two highest read coverages as the candidate HLA alleles for each locus. Alignment results of the HLA genes were reconfirmed by de novo assembly. The sequence reads mapped on the HLA genes were extracted from bam files in fastq format. The HLA-filtered reads were realigned to the target HLA genes of HLA-A, -B and -C, and allelic sequences of HLA genes were phased by de novo assembly using Sequencher DNA Sequence Analysis Software version 5.0.1 (Gene Codes Corporation, MI, USA). HLA genotyping was performed by BLAST search with IMGT/HLA database. The misalignments among similar sequence reads of HLA genes were realigned for specific HLA allele sequences. The aligned reads were manually examined with IGV software to double-check the candidate HLA alleles. Allele frequencies of modern populations were obtained from the Allele Frequency Net Database (http://www.allelefrequencies.net/default.asp).
Genotype calling of F23
We used GATK UnifiedGenotyper to call genotypes for all genomic sites (-dcov 600 -stand_call_conf 30 or 50-stand_emit_conf 10 --output_mode EMIT_ALL_SITES--genotype_likelihoods_model BOTH). Next, we masked NUMT (Shinoda et al., 2017) and tandem repeat regions (Prüfer et al., 2014) to restrict data analysis to unique regions. Then, we checked the distribution of depth of coverage to determine whether the depth was sufficient for genotyping (≥10). To investigate the effects of residual deamination in the genotyping quality, we checked the allelic distribution in heterozygous sites. If each allele was sequenced randomly at each heterozygous site, we expected a binomial distribution centered in the middle.
Lazaridis et al. (2014) pointed out that, for sites likely to be heterozygous, two additional peaks would be observed at low allele frequencies due to sequencing errors, contamination, and deamination in some ancient samples, which are originally homogeneous. Therefore, for heterozygote sites, -stand_call_conf 50 was used, and allelic balances greater than 0.2 were removed (Rasmussen et al., 2014). We also expected that segmental duplications and copy number variants (CNVs) would cause the depth and heterozygote frequency to be artificially high. We removed sites with a depth higher than 79 (2.13% of total covered sites) and lower than 10 (4.00% of total covered sites). In total, 6.13% of covered sites were removed.
Phenotyping of anthropological traits and detection of pathogenic mutations
Phenotypes of F23 for some anthropological traits (alcohol tolerance, earwax type, hair thickness, shovel-shaped incisors, iris color, and skin reflectance) were inferred from genotypes of the associated SNPs, as reported in previous studies (Harada et al., 1981; Edenburg and Bosron, 1997; Yoshiura et al., 2006; Motokawa et al., 2007, 2008; Fujimoto, 2008; Kimura et al., 2009; Yamaguchi et al., 2012). The height tendency of the F23 female was also estimated from genotypes of SNPs reported as genetic factors for adult height in a recent meta-analysis in East Asians (He et al., 2015). Seventy-five SNPs with P < 1 × 10⁻⁵ in stage 1 and combined P < 5.0 × 10⁻⁸ were used for height estimation. We used effect size in stage 2 because of the smaller SE and assumed that a person without any positive and negative effect alleles was of average height (Z = 0). In addition, ABO and Rh blood types were estimated using BOOGIE (Giollo et al., 2015).
Clinically significant variants were detected using Clin-Var entries based on the ANNOVAR annotation tool (Landrum et al., 2016; Wang et al., 2010). For detection of pathogenic rare amino acid substitutions, we used ClinVar to obtain information about relationships among variations and human health and data for 2049 Japanese individuals from the Integrative Japanese Genome Variation Database (Yamaguchi-Kabata et al., 2015) (https://ijgvd.megabank.tohoku.ac.jp/about/) and for 1208 Japanese individuals from the Human Genetic Variation Database (Higasa et al., 2016) (http://www.genome.med.kyoto-u.ac.jp/SnpDB/index.html), Exome Aggregation Consortium version 0.3.1 (Lek et al., 2016) (http://exac.broadinstitute.org), and 1000 Genomes Project database Phase 3 (ftp://ftp.1000genomes.ebi.ac.uk/vol1/ftp/) to narrow down rare variants. The functional effects of the variants were evaluated using combined annotation-dependent depletion (CADD) for scoring the deleteriousness of non-coding variants as the clinical validity (Kircher et al., 2014) and Protein Variation Effect Analyzer (PROVEAN) to predict whether an amino acid substitution or indel had an impact on the biological function of a protein (Choi et al., 2012).
Data preparation for modern and other ancient human genomes
Seven data sets from the 1000 Genomes Project Consortium (2012), the SGDP (Mallick et al., 2016), genomes of Tibetan and Sherpa (Lu et al., 2016), genotypes of fully public Affymetrix Human Origins present-day individuals and ancient individuals analyzed by Lazaridis et al. (2016) and Skoglund et al. (2016) (the Pacific dataset), genotypes of three modern Japanese populations (Japanese Archipelago Human Population Genetics Consortium, 2012), and data from the HUGO Pan-Asian SNP Consortium et al. (2009) were used (Table 1). For filtering the SGDP dataset, we used SGDP-lite version 3 (http://sharehost.hms.harvard.edu/genetics/reich_lab/cteam_lite_public3.tar), for which nine filter levels were assigned for the variant call. We chose filter level 1, which is believed to be useful for most applications and achieves a good balance between sensitivity and low error rate and retains only the transversion sites. We used cTools (https://github.com/DReichLab/cTools>) for the filtering, retained only variant sites and merged the data with 1000 Genomes Project data. We used LiftOver (http://hgdownload.cse.ucsc.edu/admin/exe/macOSX.x86_64/liftOver) to convert hg18 coordinates to hg19 coordinates for the data from the Japanese Archipelago Human Population Genetics Consortium (2012).
Table 1
List of datasets and populations used in the current study
| Dataset |
Array or whole genome |
Regions or contries |
Populations |
Reference |
| Funadomari Jomon |
Genome |
Japan |
3500–3800 YBP Hokkaido Jomon (DRA008031) |
This paper |
| Sanganji Jomon |
Genome |
Japan |
3000 YBP Tohoku Jomon |
Kanzawa-Kiriyama et al. (2017) |
| Mal’ta MA1 |
Genome |
South central Siberia |
24000 YBP south-central Siberian |
Raghavan et al. (2013) |
| Tianyuan |
Genome |
East Asia |
40000 YBP East Asian |
Yang et al. (2017) |
| 1000 Genomes |
Genome |
Africa |
LWK (Luhya in Webuye, Kenya) |
The 1000 Genomes Project Consortium (2012) |
|
|
Europe |
CEU (Utah Residents (CEPH) with Northern and Western European Ancestry) |
|
|
|
East Asia |
JPT (Japanese in Tokyo, Japan), CHB (Han Chinese in Beijing, China), CHS (Southern Han Chinese), CDX (Chinese Dai in Xishuangbanna, China), KHV (Kinh in Ho Chi Minh City, Vietnam) |
|
| SGDP (Simons Genome Diversity Project) |
Genome |
Africa |
BantuHerero, BantuKenya, BantuTswana, Biaka, Dinka, Esan, Gambian, Ju hoan North, Khomani San, Luhya, Luo, Mandenka, Masai, Mbuti, Mende, Somali, Yoruba |
Mallick et al. (2016) |
|
|
Australasia |
Australian, Bougainville, Hawaiian, Maori, Papuan |
|
|
|
Caucasus |
Abkhasian, Adygei, Armenian, Chechen, Georgian, Lezgin, North Ossetian |
|
|
|
Central America |
Mayan, Mixe, Mixtec, Pima, Zapotec |
|
|
|
Central Asia, Siberia |
Aleut, Altaian, Chukchi, Eskimo Chaplin, Eskimo Naukan, Eskimo Sireniki, Even, Itelman, Kyrgyz, Mansi, Tajik, Tlingit, Tubalar, Ulchi, Uygur, Yakut |
|
|
|
East Asia |
Ami, Atayal, Burmese, Cambodian, Dai, Daur, Dusun, Han, Hezhen, Igorot, Japanese, Kinh, Korean, Lahu, Miao, Mongola, Naxi, Oroqen, She, Thai, Tu, Tujia, Xibo, Yi |
|
|
|
Europe |
Albanian, Basque, Bergamo, Bulgarian, Crete, Czech, English, Estonian, Finnish, French, Greek, Hungarian, Icelandic, Norwegian, Orcadian, Polish, Russian, Saami, Sardinian, Spanish, Tuscan |
|
|
|
North Africa |
Mozabite, Saharawi |
|
|
|
South America |
Chane, Karitiana, Piapoco, Quechua, Surui |
|
|
|
South Asia |
Balochi, Bengali, Brahmin, Brahui, Burusho, Hazara, Irula, Kalash, Kapu, Khonda_Dora, Kusunda, Madiga, Makrani, Mala, Pathan, Punjabi, Relli, Sindhi, Yadava |
|
|
|
West Asia |
BedouinB, Druze, Iranian, Iraqi Jew, Jordanian, Palestinian, Samaritan, Turkish, Yemenite Jew |
|
|
|
Ancient human |
Ust’-Ishim (45000 YBP Siberian) |
|
|
|
Archaic human |
Altai Neanderthal, Denisovan |
|
| Tibetan/Sherpa |
Genome |
East Asia |
Tibetan (AAGC022053, AAGC022056, AAGC022062, AAGC022070, AAGC022079, AAGC022109, AAGC022067), Sherpa (AAGC022072, AAGC022073, AAGC022074, AAGC022075, AAGC022076) |
Lu et al. (2016) |
| Lazaridis et al. (2016) |
Array |
Africa |
BantuKenya, Biaka, Esan, Gambian, Ju hoan North, Luhya, Luo, Mandenka, Masai, Mbuti, Mende, Somali, Yoruba |
Lazaridis et al. (2016) |
|
|
Australasia |
Australian, Papuan |
|
|
|
Caucasus |
Abkhasian, Adygei, Armenian, Chechen, Georgian, Lezgin, North Ossetian |
|
|
|
Central America |
Mayan, Mixe, Mixtec, Pima, Zapotec |
|
|
|
Central Asia, Siberia |
Aleut, Altaian, Chukchi, Even, Kyrgyz, Mansi, Tajik, Tubalar, Ulchi, Uygur, Yakut |
|
|
|
East Asia |
Ami, Atayal, Burmese, Cambodian, Dai, Daur, Dusun, Han, Hezhen, Japanese, Kinh, Korean, Lahu, Miao, Mongola, Naxi, Oroqen, She, Thai, Tu, Tujia, Xibo, Yi |
|
|
|
East Eurasian |
Dolgan, Eskimo, Itelmen, Kalmyk, Koryak, Nganasan, Selkup, Tuvinian, Yukagir |
|
|
|
Europe |
Albanian, Basque, Bulgarian, Czech, English, Estonian, Finnish, French, Greek, Hungarian, Icelandic, Norwegian, Orcadian, Russian, Sardinian, Spanish |
|
|
|
North Africa |
Mozabite, Saharawi |
|
|
|
South America |
Karitiana, Piapoco, Quechua, Surui |
|
|
|
South Asia |
Balochi, Bengali, Brahui, Burusho, Hazara, Kalash, Kusunda, Makrani, Pathan, Punjabi, Sindhi |
|
|
|
West Asia |
BedouinB, Druze, Iranian, Jordanian, Palestinian, Turkish |
|
|
|
Ancient human |
Mal’ta MA1, Afontva Gora-2 (AG2), Ust’-Ishim |
|
| Skoglund et al. (2016) |
Array |
Southeast Asia |
Malay, Vietnamese |
Skoglund et al. (2016) |
|
|
Island Southeast Asia |
Ilocano, Kankanaey, Murut, Tagalog, Visayan |
|
|
|
Ancient Lapita |
Lapita Tonga, Lapita Vanuatu |
|
| The HUGO Pan-Asian SNP Consortium |
Array |
China |
CN-CC (Zhuang), CN-GA (Han), CN-HM (Hmong), CN-JI (Jiamao), CN-JN (Jinuo), CN-SH (Han), CN-UG (Uyghur), CN-WA (Wa) |
HUGO Pan-Asian SNP Consortium et al. (2009) |
|
|
India |
IN-DR (Proto-Austroloids), IN-EL (Caucasoids (may have admixture with Mongoloids)), IN-IL (Caucasoids), IN-NI (Mongoloid features), IN-NL (Caucasoids), IN-SP (Caucasoids), IN-TB (Mon- goloid features), IN-WI (Caucasoids), IN-WL (Caucasoids) |
|
|
|
Indonesia |
ID-AL (Alorese), ID-DY (Dayak), ID-JA (Javanese), ID-JV (Javanese), ID-KR (Batak Karo), ID-LA (Lamaholot), ID-LE (Lembata), ID-ML (Malay), ID-MT (Mentawai), ID-RA (Mangga- rai), ID-SB (Kambera), ID-SO (Manggarai), ID-SU (Sunda), ID-TB (Batak Toba), ID-TR (Toraja) |
|
|
|
Japan |
JP-ML (Japanese), JP-RK (Ryukyuan) |
|
|
|
Korea |
KR-KR (Koreans) |
|
|
|
Malaysia |
MY-TM (Proto-Malay), MY-BD (Bidayuh), MY-KS (Negrito), MY-JH (Negrito), MY-KN (Malay), MY-MN (Malay) |
|
|
|
Pacific |
AX-ME (Melanesians) |
|
|
|
Philippines |
PI-AT (Ati), PI-AG (Agta), PI-MA (Minanubu), PI-MW (Mamanwa), PI-AE (Ayta), PI-IR (Iraya), PI-UI (Filipino), PI-UN (Filipino), PI-UB (Filipino) |
|
|
|
Singapore |
SG-CH (Chinese), SG-ML (Malay), SG-ID (Indian) |
|
|
|
Taiwan |
AX-AM (Ami), AX-AT (Atayal) |
|
|
|
Thailand |
TH-HM (Hmong (Miao)), TH-KA (Karen), TH-LW (Lawa), TH-MA (Mlabri), TH-MO (Mon), TH-PL (Paluang), TH-PP (Plang), TH-TK (Tai Khuen), TH-TL (Tai Lue), TH-TN (H’tin), TH-TU (Tai Yuan), TH-TY (Tai Yong), TH-YA (Yao) TW-HA (Chinese), TW-HB (Chinese) |
|
| Japanese Archipelago Human Population Genetics Consortium |
Array |
Japan |
Ainu, Ryukyuan, Japanese |
Japanese Archipelago Human Population Genetics Consortium (2012) |
We merged all datasets using the PLINK software (Purcell et al., 2007) and prepared five different merged datasets (Supplementary Table 2). F23 genotypes were then merged to each of the combined datasets. We downloaded the bam files of Mal’ta MA1, a 24000 years before present (YBP) Siberian genome (Raghavan et al., 2014) (http://www.cbs.dtu.dk/public/malta/MA1_AG2/bams/); Tianyuan, a 40000 YBP East Asian genome (Yang et al., 2017) (ENA: PRJEB20217); Devil’s Gate 1 and 2, 7700 YBP Neolithic East Asians from the Amur Basin (Siska et al., 2017) (ENA PRJEB14817); and Ikawazu Jomon IK002 and prehistoric Southeast Asians (McColl et al., 2018) (ENA PRJEB26721). We also downloaded the sra file of Chokhopani C1, a 3150–2400 YBP Nepal genome from the Annapurna Conservation Area (ACA) (Jeong et al., 2016b) (ENA SRP065070 and sample accession no. SRR3728363) and fastq files of Kostenki 14, a 38700–36200 YBP West Eurasian genome (Seguin-Orlando et al., 2014), and mapped them to hs37d5. For these genomic data and genomic data of our three Jomon individuals, F5, Sanganji131421-3, and Sanganji 131464, we called an allele by sampling a random read covering each SNP site with pileupCaller (https://github.com/stschiff/sequenceTools) used by Schuenemann et al. (2017), and merged these with the already merged datasets.
Principal component analysis (PCA)
SNPs observed in modern human populations were used to examine the genetic relationships between individuals through PCA. For genomic data, two filters, i.e., minor allele frequency <0.005 and genotype call rate <0.9, were applied using PLINK. Finally, we performed PCA using the smartpca program in the EIGENSOFT package (Patterson et al., 2006). When we included multiple ancient samples in the PCA, we used lsqproject option YES to project all the ancient samples. We used ancient samples having a genomic coverage of more than 2000 SNP coverage sites.
Phylogenetic analysis
Phylogenetic relationships between ancient and modern humans were first estimated using the neighbor-joining method (Saitou and Nei, 1987) based on Nei’s (1972) minimum distances. Trees were produced using SplitsTree4 software (Huson and Bryant, 2006).
For phylogenetic reconstruction with gene flow events, TreeMix (Pickrell and Pritchard, 2012) was used. Using Mbuti pygmies/Denisova as the root, trees were constructed assuming no migration and an incremental number of assumed gene flow events. Each run was performed in blocks of 500 SNPs to account for linkage disequilibrium, with sample size correction turned off.
F-statistics to detect gene flow
The f3-statistic (qp3Pop), the f4-statistic (qpDstat with f4 mode: YES), and the f4 ratio test, which are part of Admix-Tools (Patterson et al., 2012), can infer gene flows without invoking demographic models. These statistics are based on the number of shared alleles between test populations. We used |Z| > 3 as a significance cutoff.
We used the outgroup and admixture f3-statistics. The outgroup f3-statistic, f3 (Outgroup; X, Y), measures the shared genetic drift between two source populations, X and Y, compared with the outgroup population. Larger values indicate greater shared genetic drift between populations X and Y, which suggests a closer relationship. The admixture f3-statistic, f3 (Test; X, Y), detects whether the test population is explained by an admixture of populations X and Y. A significantly negative statistic implies that populations X and Y are candidates of the genetic source for the test population.
In the f4-statistic, f4 (O, X; Y, Z) measures allele frequency differences between two pairs of the group, (O, X) and (Y, Z), assuming population O as an outgroup to the three other populations. If the topology (O, X) (Y, Z) is correct, the frequency differences between Y and Z should reflect genetic drift, which is not correlated with those between O and X. Thus, the expected value of the product of frequency differences, f4, is zero. If f4 is significantly positive, X and Z share more alleles than Y and Z share, and if the f4 is significantly negative, X and Y share more alleles than X and Z share. To minimize the effects of possible biases due to small number of SNPs, only datasets with more than 50000 SNPs were used for this test.
To estimate the proportion of the Jomon ancestry in modern humans, we used the f4 ratio test, assuming the tree topology. There are at least three populations in the Japanese archipelago, the Ainu, Mainland Japanese, and Ryukyuan, who live in the northernmost, middle, and southernmost parts of the archipelago, respectively (Supplementary Figure 1). To reduce the influence of the recent admixture from Mainland Japanese into Ainu, only seven individuals who were most distant from the Mainland Japanese in the PCA plot were used in this analysis.
Testing models of phylogenetic relationships
To confirm the phylogenetic relationships and admixture events among populations illustrated by PCA, TreeMix, and F-statistics, we constructed the admix-tree using the qp-Graph program of the AdmixTools software. We chose five SGDP populations (Mbuti, Sardinian, Mixe, Han, and Japanese), MA1, and F23 for the graph construction, and we selected Mbuti, Sardinian, and Han as non-admixed populations. We then added F23, MA1, Mixe, and Japanese, sequentially. We calculated all possible admixed and non-admixed trees when we added the new population to the tree and kept the trees that produced the graph with the better Z-score (|Z| > 3) and fitting scores.
Estimating population size changes and divergence times
Changes in effective population size (Ne) over time and divergence times were estimated using the Multiple Sequentially Markovian Coalescent (MSMC) program (Schiffels and Durbin, 2014). Genotype calls by HaplotypeCaller described in the ‘Haplotype-based analysis’ section were used for MSMC analysis. For this analysis, we retained singleton variants but filtered out genotypes where genotype quality was less than 20 or where the fraction of sequence reads supporting the minor allele was less than 0.2. Haplotype phasing was conducted with Eagle version 2.3.2. Variants with depth between one-half and twice the average depth of each BAM file were used for the MSMC run. For estimation of Ne over time, four haplotypes (two individuals) representing each population were used, with the exception of F23 (one individual). Divergence times between populations were estimated in a pairwise manner, with one individual used to represent their respective population. For both of these analyses, a 30 year generation time and mutation rate of 1.25 × 10⁻⁸/site/generation were assumed. The mid-point of relative cross-coalescence rate (RCCR 0.5) was used for estimating the divergence time between populations.
Results
Mapping and DNA sequence authenticity
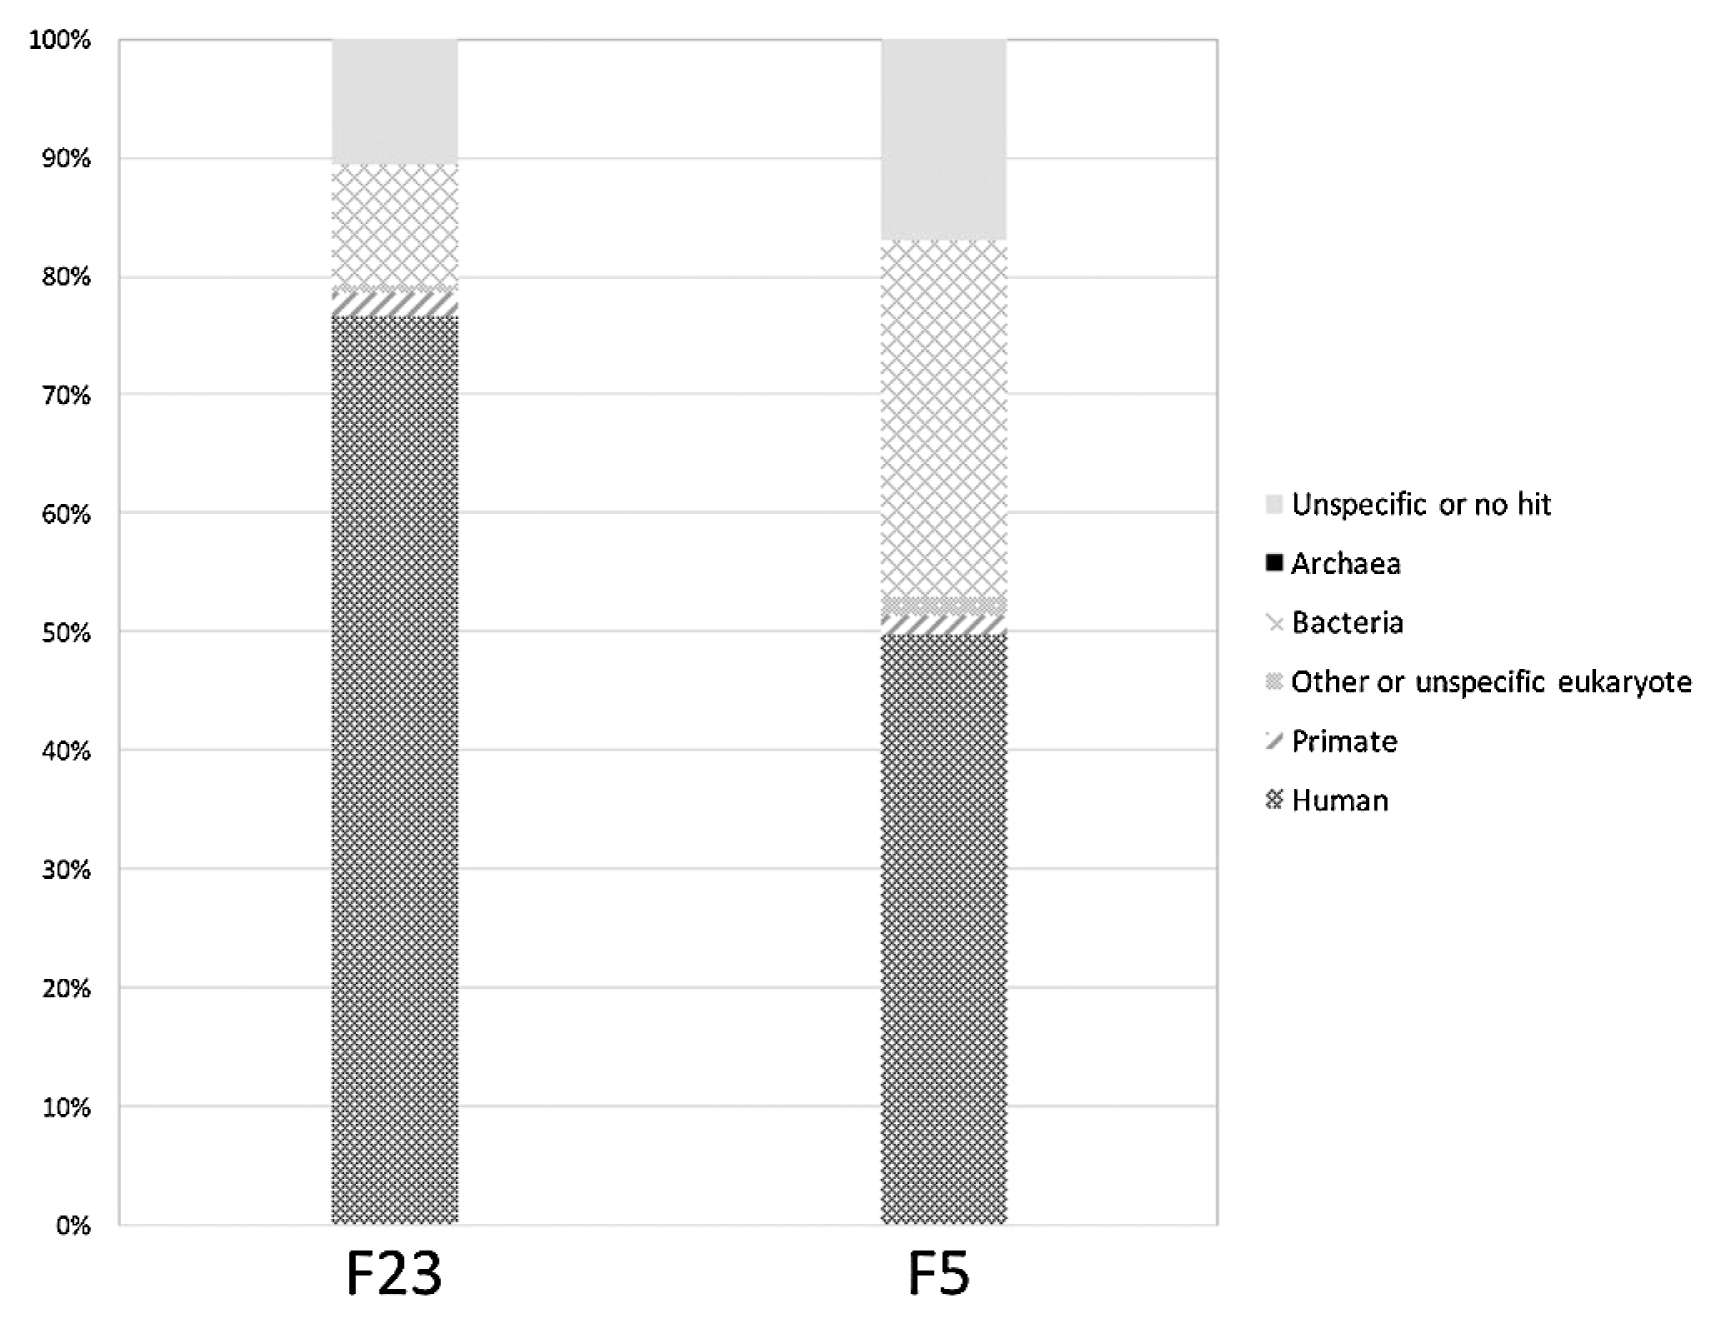
Both of our Funadomari Jomon samples showed a higher proportion of reads assigned to humans (77% and 50% in F23 and F5, respectively; see Figure 3), which are much higher than those found in most of other studies (e.g. Kanzawa-Kiriyama et al., 2017). Approximately 1.32 billion and 0.13 billion reads from DNA libraries for F23 and F5 were uniquely mapped to the human reference genome (GRCh37), and the peaks of depth were 48- and 1-fold, respectively (Figure 4a). We deposited all the short-read sequences produced for this study into the DDBJ Sequence Read Archive (SRA; http://trace.ddbj.nig.ac.jp/dra/). Sequence data are available for download through SRA (accession number DRA008031). Mapped data are available upon request.
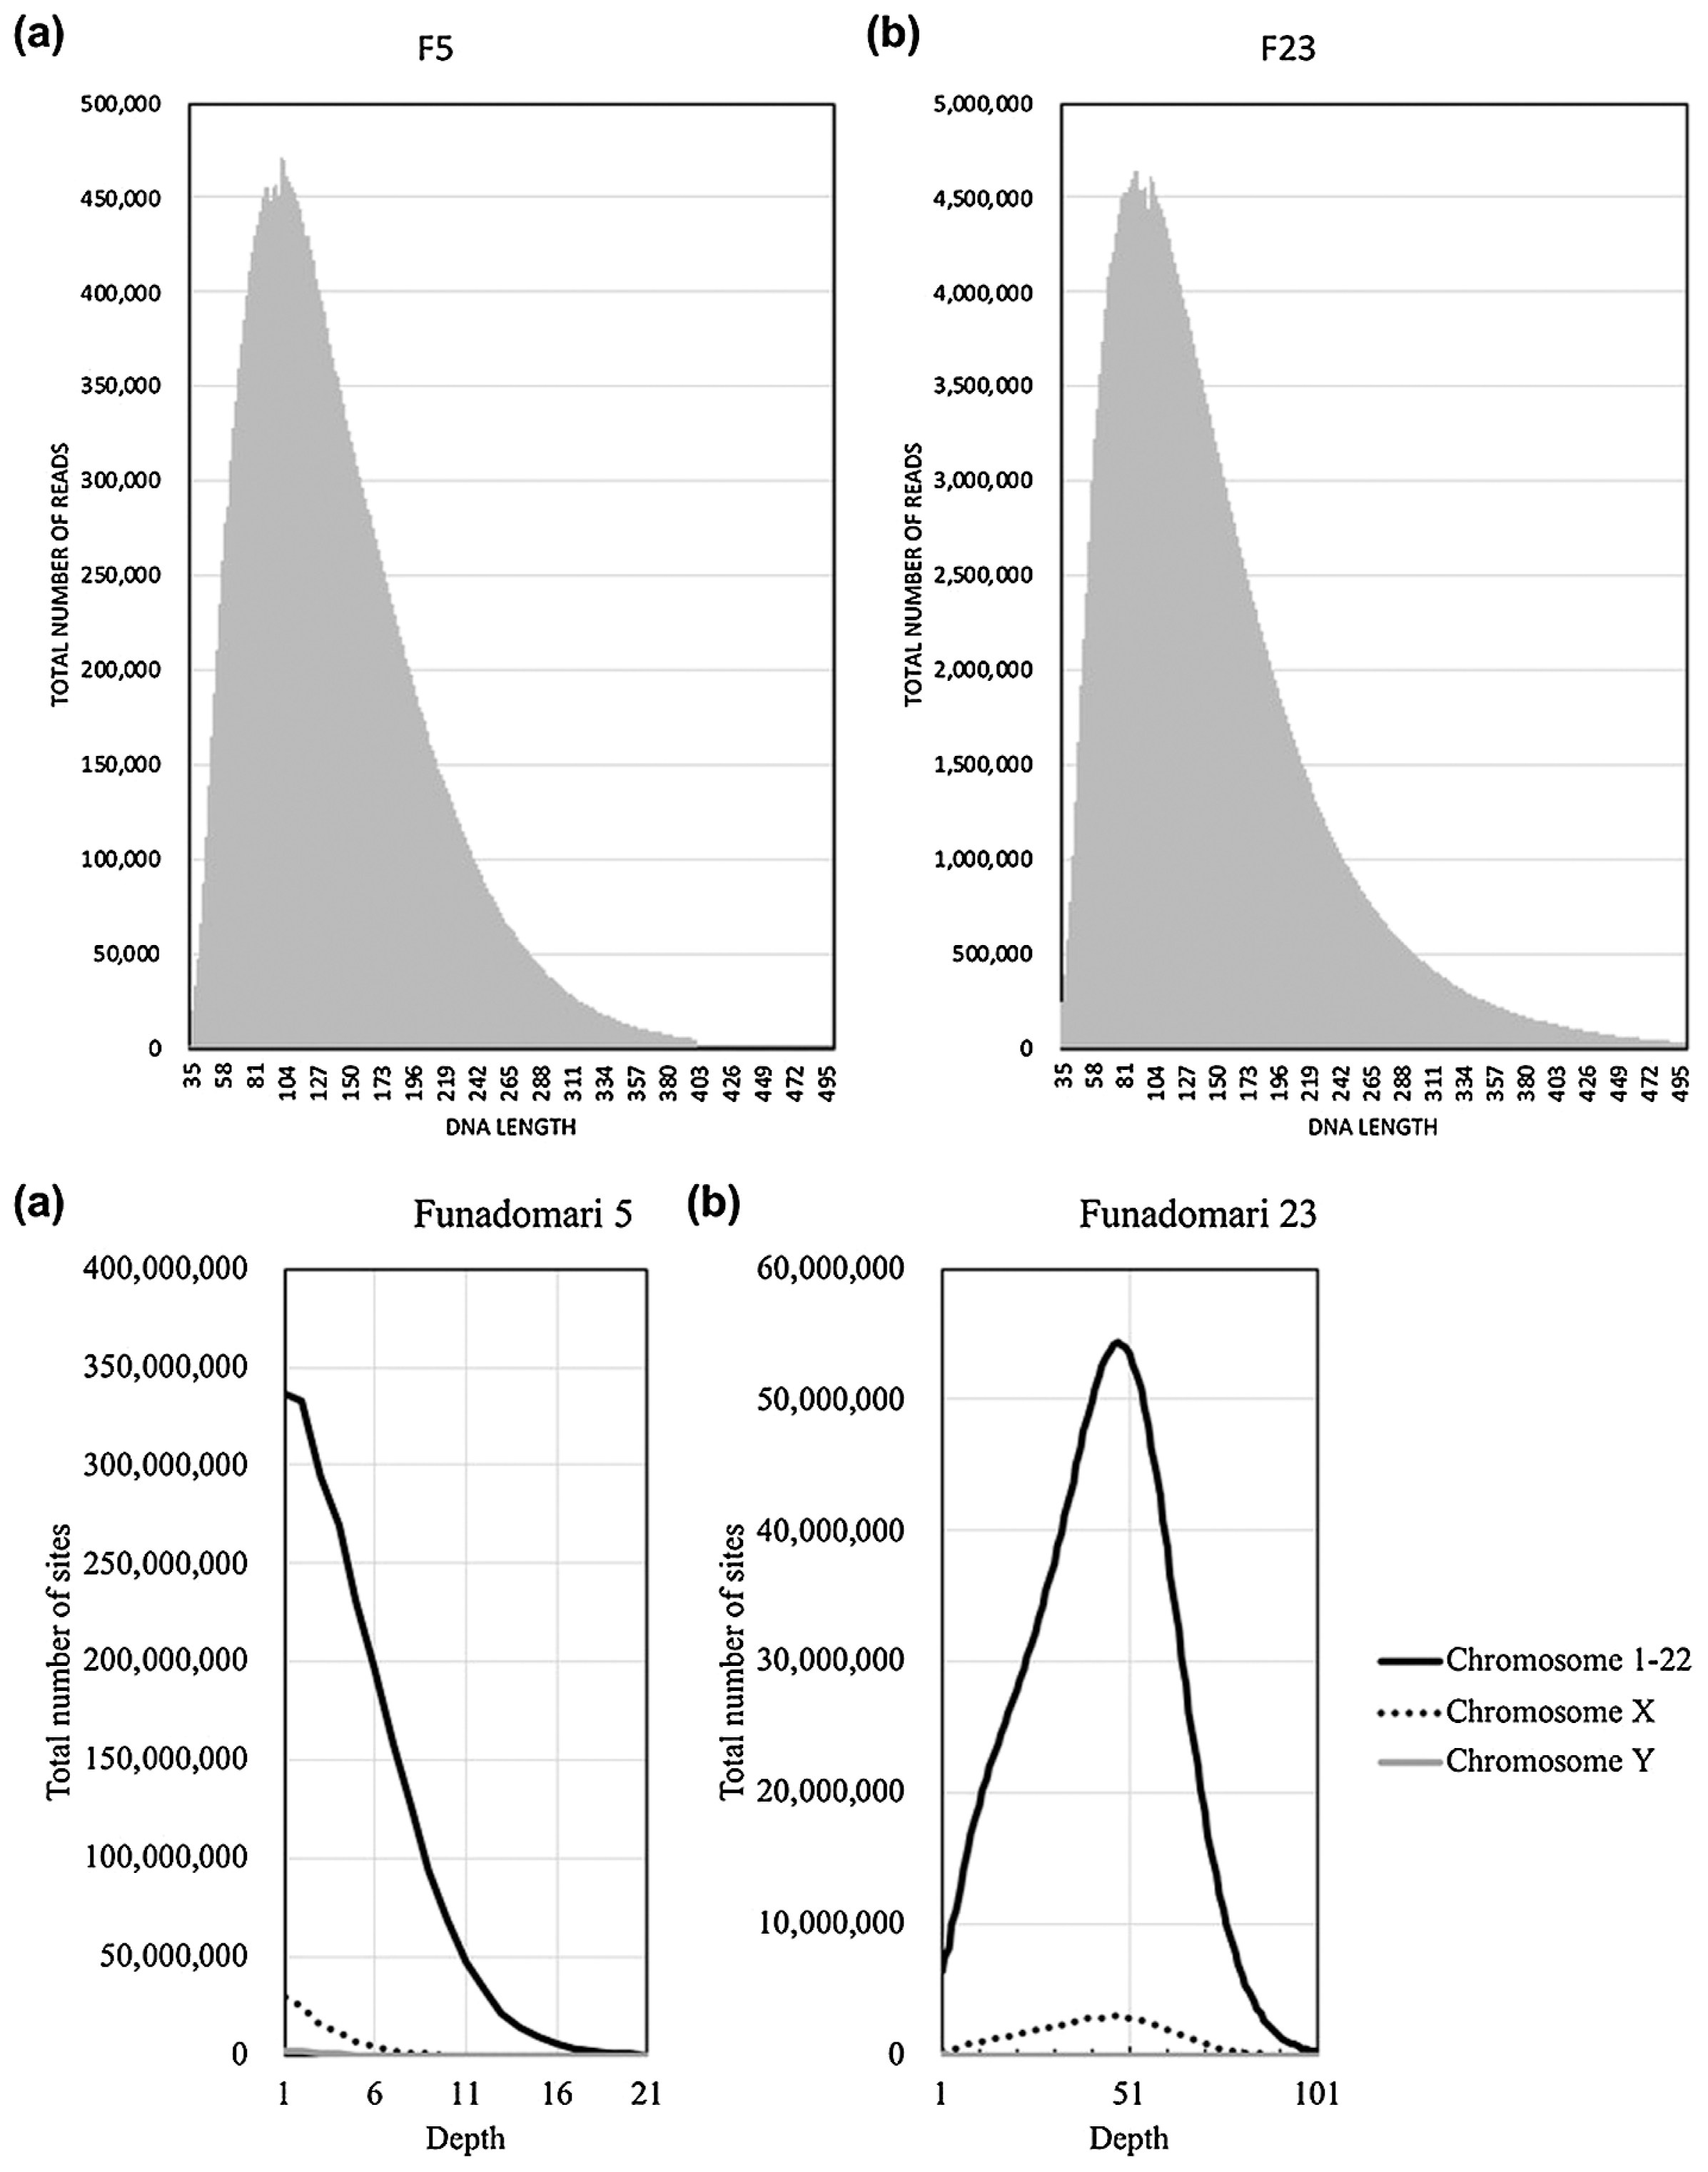
The read length distribution for each library is shown in Figure 4b. The peak insert length of mapped sequence reads for F5 and F23 was 101 bp in both individuals, which is much longer than that of Sanganji Jomons, which is around 80 bp (Kanzawa-Kiriyama et al., 2017), indicating good DNA preservation. From the ratio of sequence reads mapped to the X and Y chromosomes (Table 2), we concluded that F5 and F23 were male and female, respectively. This identification is consistent with the morphological observations of these individuals (Matsumura and Anezaki, 2000). We observed characteristic features of ancient DNA degradation, including C to T misincorporation, at high frequencies in the 3′ and 5′ ends, and an increased fraction of purines close to the sequence read termini (Supplementary Figures 2 and 3), indicating that the sequence reads most likely contained endogenous Jomon DNAs. The ratio of the misincorporation was lower than those of previous studies, indicating that the DNA preservation was good compared to that of other ancient samples, probably because of the cold environment in the Funadomari site.
Table 2
Summary of mapping, screening, sex determination, and haplotyping
| Sample |
Funadomari 5 |
Funadomari 23 |
| Total paired reads (n) |
476105876 |
2701697314 |
| Paired-mapped reads with mapq >= 30 (n) |
227587497 |
1897051428 |
| (%) |
47.8% |
70.2% |
| Final reads for statistical analysis (n) *1 |
125592485 |
1324784403 |
| Mitochondrial DNA haplogroup |
N9b1 |
N9b1 |
| Sex determination |
Male |
Female |
| Chromosome Y haplogroup |
D1b2b |
— |
| Chromosome X contamination estimates (%) |
0.37–0.63 |
— |
| Kanzawa-Kiriyama et al. (2017) mitohondrial DNA contamination estimates (%) |
0.00–0.61 |
0.15–0.47 |
| Schmutzi mitochondrial DNA contamination estimates (%) |
0 (0.0–0.5) |
0 (0.0–0.5) |
* 1: Total reads after all filtering (read length, PCR deplicates, soft-clipping and hard-clipping, realignment and recalibration).
Next, we estimated the error rates in Funadomari Jomon genome sequences. While the error rates of the F23 and F5 were 0.506% and 0.676% over all sites, respectively, the error rates in the transversion sites were only 0.023–0.038% and 0.018–0.035%, respectively (Supplementary Figure 4). F23 had high coverage, and the effects of the errors on genotype calling were negligible. We also found more transitional substitutions (A/G or C/T) in the Funadomari Jomon than in other modern humans, which appeared to be caused by postmortem changes (cytosine deamination) characteristic of ancient DNA. Treatment with uracil DNA glycosylase (UDG), which cleaves the deaminated cytosines and drives down the rate of ancient DNA error, was not performed in the current study so as to minimize the risk of contamination by reducing the experimental steps, to observe the deamination for proving the authenticity, and to use only damaged reads if the libraries had a large amount of contaminants, as Meyer et al. (2014) conducted. Contamination frequencies were less than 1% in both F5 and F23 (0.25% and 0.38%, respectively; Table 2 and Supplementary Table 3).
The postmortem changes affected genotyping quality for both single-sample genotyping and joint genotyping. Our filtering criteria filtered heterozygous sites on C/T and G/A that deviated from the binomial distribution (Supplementary Figure 5) and on high-depth sites (Supplementary Figure 6), and stabilized the depth distribution on C/T and G/A genotype calls (Supplementary Figure 7) and the transition/transversion ratio (Ts/Tv) of F23 and other ancient data (Supplementary Figure 8).
mtDNA and Y chromosome haplogroups in Funadomari Jomons
We determined complete mitochondrial genome sequences of F5 and F23 and concluded that the mtDNA haplogroups of both individuals were N9b1. The results are consistent with those of Adachi et al. (2011), which classified the mtDNA haplogroups of F5 and F23 as N9b1 with amplified product-length polymorphism analysis and the sequencing of the hypervariable region. However, they were not classified into N9b1 subhaplogroups (N9b1a, N9b1b, or N9b1c) according to phylotree.org. Although F5 and F23 shared a particular mutation (T4047C), F23 alone had the individual specific mutation, C16234T (Supplementary Table 4), suggesting that F5 and F23 did not have the same maternal lineage. Moreover, F5 appeared to have heteroplasmy at position 16319, because 28% of the total reads covering the SNP site had the derived allele G16319A. The frequency is much higher than the contamination frequency of F5, and we concluded that the reads were authentic, and not contaminants.
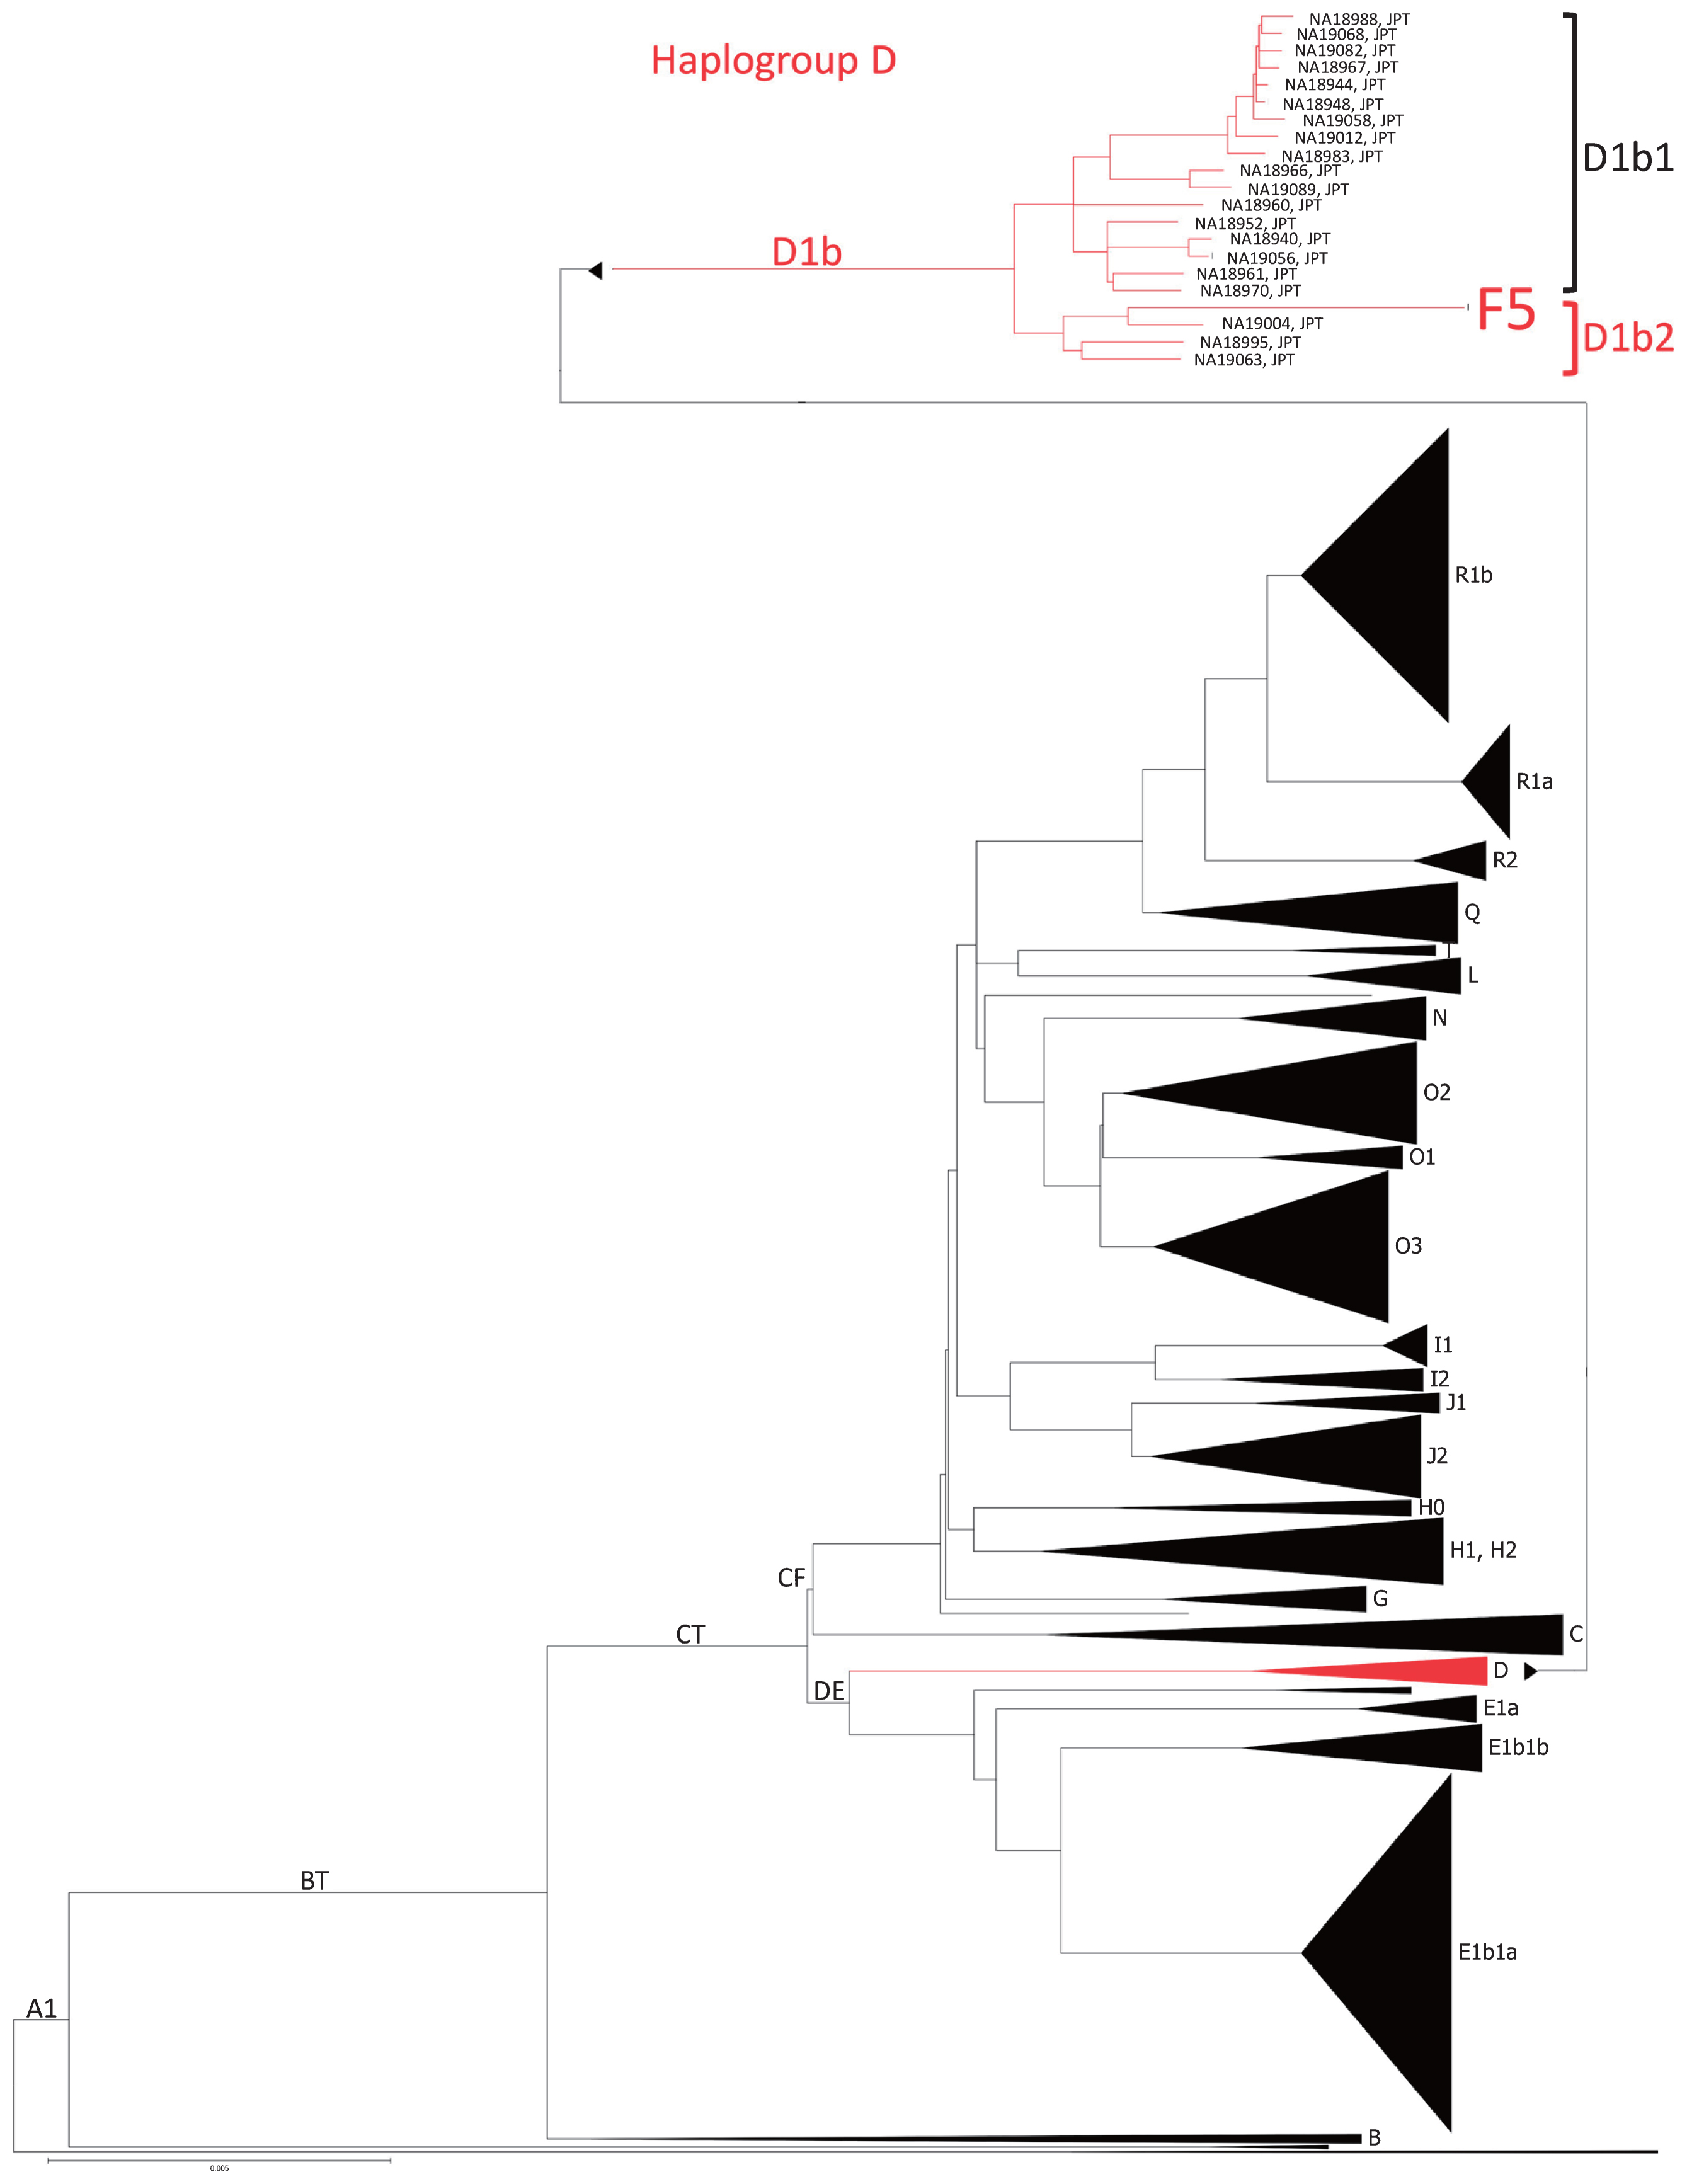
The Y chromosome of F5 belonged to haplogroup D1b2 (Supplementary Table 5). F5 had not only two of the eight D1b2a-specific mutations but also one D1b2b-specific mutation. Mutations characterizing D1b2a subhaplogroups (D1b2a1 and D1b2a2) were not observed. To clarify the phylogenetic position of F5 within the D1b2 lineage, we constructed a maximum likelihood tree using the Y chromosomes of F5 and 1233 modern human males. F5 was located in haplogroup D1b2 and clustered with NA19004 (a modern Japanese individual), who belonged to D1b2b (Figure 5). NA19004 shared some D1b2a-specific mutations with F5, indicating that some of the SNPs characterizing D1b2a may be shared between D1b2a and D1b2b. Therefore, we concluded that F5 belonged to D1b2b (Table 2).
HLA haplotypes of F23
The top two highest read coverages of alleles at HLA class I classic loci in F23 estimated by VBseq were HLA-A*23:17 (coverage: 3.07) and HLA-A*24:02:01:01 (33.55), HLA-B*15:04:01:01 (10.11) and HLA-B*15:01:01:01 (15.48), and HLA-C*03:03:28 (4.98) and C*03:03:01:01 (30.46), respectively. The coverages of depth of HLA-A and HLA-C are near to the average depth of the entire genome, and it is considered that the two loci were homozygous. After realignment of misaligned reads among HLA-B and HLA-C, the HLA-B genotype was determined as HLA-B*15:01:01:01 homozygous. Thus, the HLA class I genotypes of F23 were HLA-A*24:02:01/A*24:02:01, B*15:01:01/B*15:01:01, and C*03:03:01/C*03:03:01. Genotypes of HLA class II genes could not be determined because insufficient reads were mapped to those genes. HLA-A*24:02 is widely observed in world populations and is one of the most common HLA haplotypes in Taiwan populations and Southeast Asians. Three Japanese populations (Ainu, Mainland Japanese, and Ryukyuan) also have this haplotype at high frequencies (24.0%, 32.7%, and 33.5%, respectively) (Bannai et al., 2000; Allele Frequencies Website, http://www.allelefrequencies.net/pop6001c.asp?pop_id=2032). The most frequent HLA-A*24:02 haplotype in Ryukyuan is A*24:02:01, which is the same as that of F23 and is not frequently observed in other East Asians (Supplementary Figure 9a). The B*15:01 allele is not frequent compared with A*24:02 in modern humans, but was observed in Ainu at a high frequency (29%, Supplementary Figure 9b) (Bannai et al., 2000). The C*03:03 allele is not widespread, but more than 10% of coastal East Asians (Nivkhi, Mainland Japanese, Koreans, and Taiwan populations) and Papuans have this allele (Supplementary Figure 9c). Nakaoka et al. (2013) reported that C*03:03 is more frequently observed in Ryukyuan than in Mainland Japanese and is associated with the population substructure in Japanese populations. Nakajima et al. (2001) reported 3-locus HLA haplotypes with haplotype frequencies (HF) ≥0.5% in modern Japanese, and the haplotype of F23 was not listed in this report, suggesting that the haplotype is rare in modern Japanese populations.
Phenotypic inference of F23
We inferred 12 phenotypic traits in F23 that were validated in East Asians and were considered important to anthropological studies (Table 3, Supplementary Table 6). Six other traits observed in non-East Asians were also listed in Supplementary Table 6. Her ABO and Rh blood types were Ax02/O02 or O65 (AO) and DcE/DcE (RhD+), respectively. From the homozygous genotypes of rs3827760 (T/T) and rs10177996 (T/T) (Kimura et al., 2009), we estimated that her level of shovel-shaped incisors was slight, and tooth crown sizes were medium, consistent with the previously reported features of the Jomon people. Unfortunately, we could not verify the results of these nonmetric dental traits because of the absence of her incisors and the presence of occlusal wear of the tooth crown. Her hair thickness was inferred to be thin. The wet-type earwax of F23 (based on existence of G allele in rs17822931; Yoshiura et al., 2006) was concordant with the results showing that the frequency of the wet-type allele in the Jomon/Epi-Jomon people was higher than that in other Northeastern Asian populations (Sato et al., 2009b). Alcohol tolerance was high (variants: 47Arg in ADH1-B and 504Glu in ALDH2), and skin and iris colors were classified as moderately dark (variants: 163Arg in MC1R and His615Arg heterozygous in OCA2) and medium (His615Arg heterozygous in OCA2), respectively. The genotype score for height was moderately low (Z = −0.995), suggesting that the F23 female had a short stature compared with modern East Asians. The two amino acid change variants (92Met and 163Arg) in the MC1R gene (Motokawa et al., 2007) and three variants in the promoter region (−490C, −445G, and −226A) (Motokawa et al., 2008) were associated with an elevated risk of developing freckles and severe solar lentigines. For F23, we performed genotype calling of the Val92Met variant visually with IGV software since we failed to genotype the position using GATK because of the effects of postmortem changes (QUAL = 26.24, G = 44, A = 4, N = 2) and obtained a G/G genotype. F23 was homozygous for all five variant sites, and three risk variants were observed (163Arg, −445G, and −226A), suggesting that F23 was rather susceptible to freckles and solar lentigines. However, the association between freckling and 163Arg was not significant in a report by Yamaguchi et al. (2012). Thus, further association studies are needed to determine the risks of freckles and solar lentigines in F23.
Table 3
Inferred phenotypes of F23
ClinVar entries based on a pathogenic variant search revealed three pathogenic rare amino acid substitutions in CPT1A (NM_001031847:exon12:c.C1436T:p.P479L, NM_001876:exon12:c.C1436T:p.P479L) for carnitine palmitoyltransferase I deficiency, MYH7 (NM_000257:exon35:c. G4985A:p.R1662H) for distal myopathy and primary dilated cardiomyopathy, and PRODH (NM_001195226:exon11: c.T998C:p.L333P, NM_016335:exon12:c.T1322C:p. L441P) for proline dehydrogenase deficiency and schizophrenia (Table 4). The genotype of the CPT1A variant was homozygous, and those of the others were heterozygous. The PROVEAN scores of variants in CPT1A and PRODH were −8.25 and −6.35, respectively. The CADD scores of p.P479L in CPT1 and p.L333P/p.L441P in PRODH were 5.551 and 5.258, respectively, which were greater than the median of those of known pathogenic variants (3.498) (Mather et al., 2016).
Table 4
ClinVar pathogenic variants of F23
| Chromosome |
SNP position |
rsID |
Reference |
Alternative |
Depth |
Allelic depth |
Genotype |
Gene |
Substitution type |
Amino acid change |
Variant disease name |
Alternative allele frequency |
| 2kjpn |
1000 genomes |
ExAC AFR |
ExAC AMR |
ExAC EAS |
ExAC FIN |
ExAC NFE |
ExAC SAS |
ExAC OTH |
| 11 |
68548130 |
rs80356779 |
G |
A |
72 |
0, 72 |
A/A |
CPT1A |
nonsynonymous |
exon12:c.C1436T:p.P479L |
Carnitine palmitoyltransferase I (CPT1) deficiency |
. |
. |
0 |
8.7E-05 |
0 |
0 |
1.5E-05 |
0 |
0 |
| 14 |
23885010 |
rs370328209 |
C |
T |
54 |
24, 30 |
C/T |
MYH7 |
nonsynonymous |
exon35:c.G4985A:p.R1662H |
Myopathy, primary dilated cardiomyopathy |
. |
. |
9.6E-05 |
8.7E-05 |
0.0001 |
0 |
6.0E-05 |
0 |
0 |
| 22 |
18905934 |
rs2904551 |
A |
G |
25 |
19, 6 |
A/G |
PRODH |
nonsynonymous |
exon11:c.T998C:p.L333P, exon12:c.T1322C:p.L441P |
Proline dehydrogenase deficiency, schizophrenia |
0.0022 |
0.0066 |
0.0078 |
0.0079 |
0.0081 |
0.0043 |
0.0049 |
0.0059 |
0.0011 |
2kjpn, whole-genome sequences of 2049 healthy Japanese individuals and construction of the highly accurate Japanese population reference panel; ExAC, Exome Aggregation Consortium; AFR, African/African American; AMR, American; EAS, East Asian; FIN, Finnish; NFE, non-Finnish European; SAS, South Asian; OTH, other.
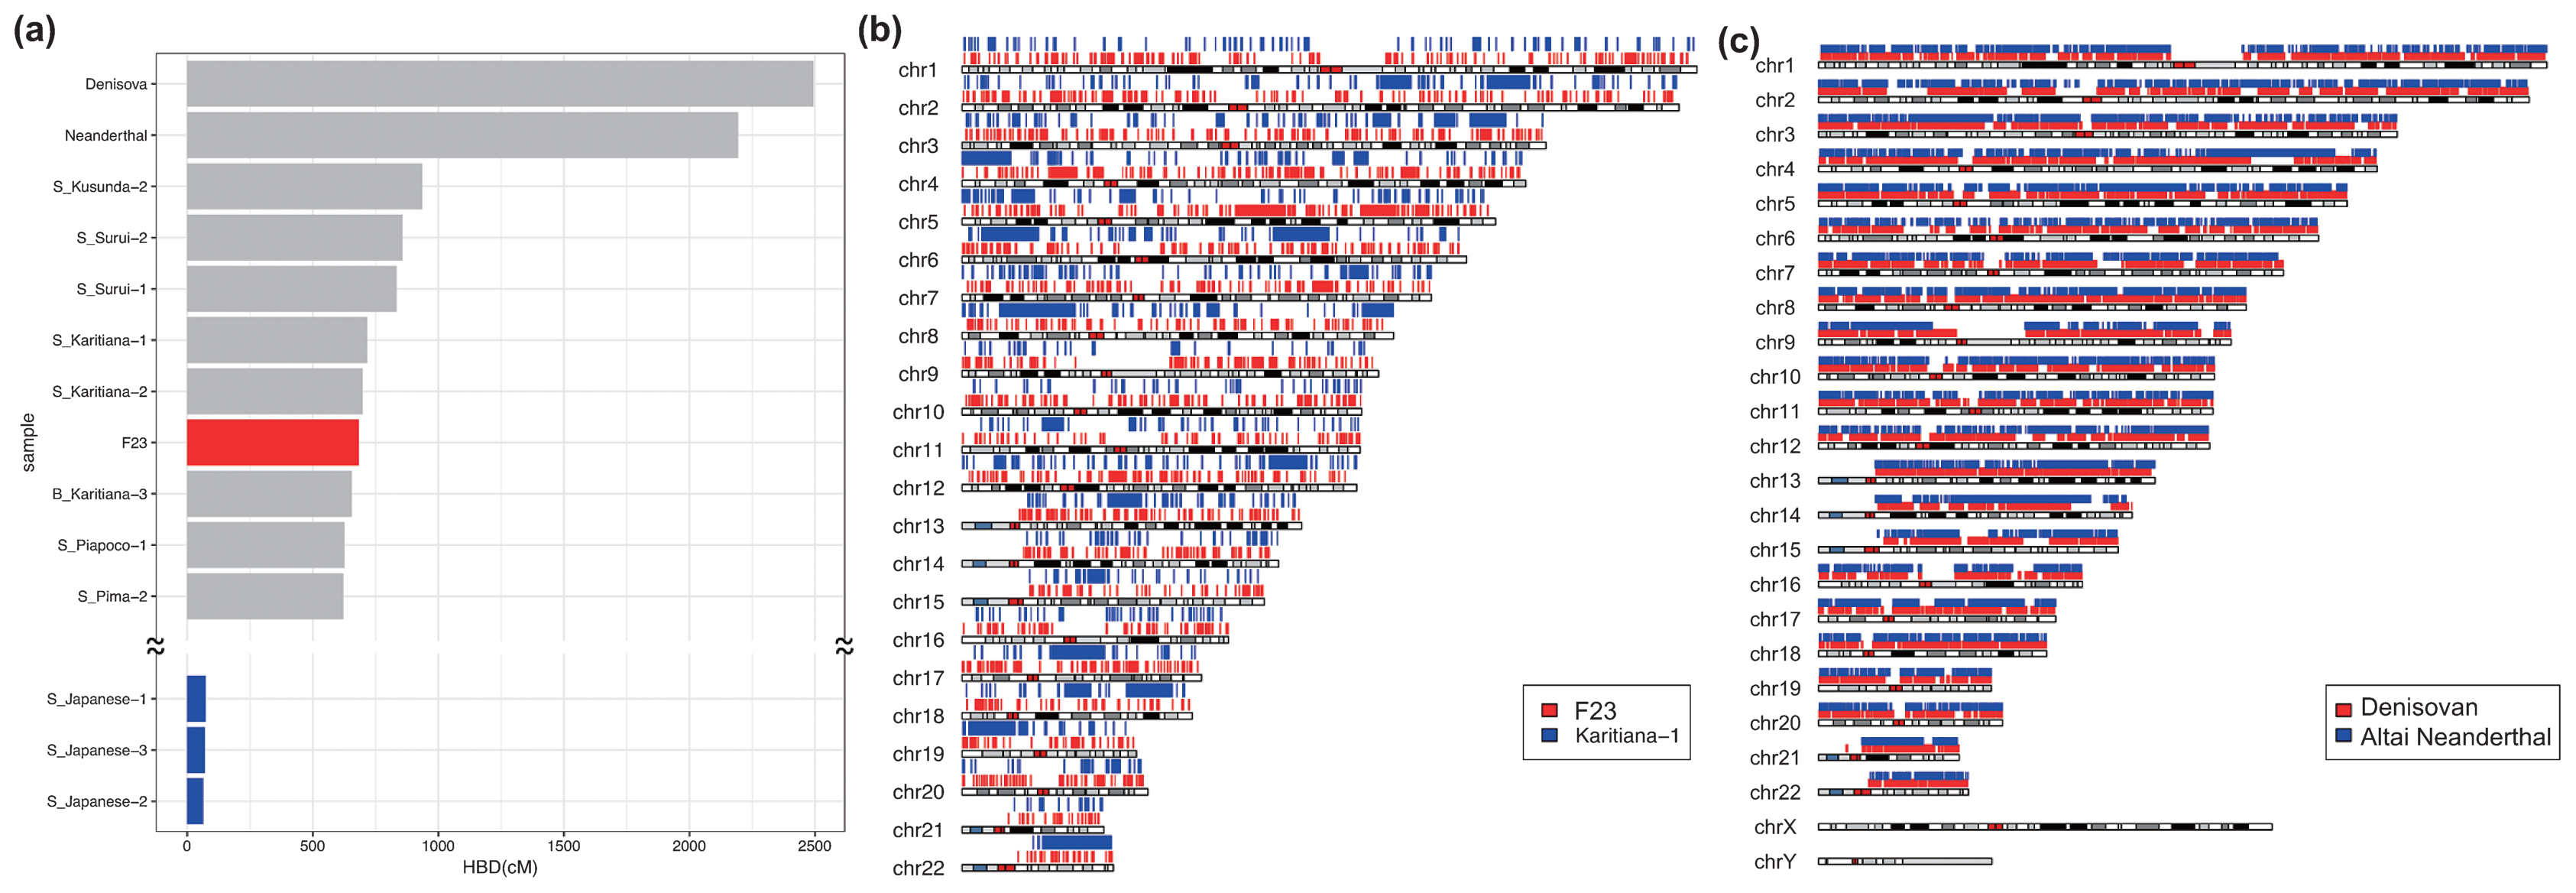
Heterozygosity and HBD are measures to infer the genetic diversity of diploid organisms. F23 had a low heterozygosity and a high HBD compared with other SGDP individuals (Supplementary Figure 10), indicating that F23 had a low genetic diversity, although she was located within the range of modern humans. We also assessed the extent of inbreeding and consanguinity from the length distribution of HBD. Some modern human populations exhibit increased levels of inbreeding in populations where consanguineous marriage practices are encouraged or in geographically isolated hunter-gatherer groups, such as those from the Amazon rainforest region (Sikora et al., 2017). Patterns of HBD among Upper Paleolithic individuals are consistent with randomly mating populations of moderate effective size (Ne~200), which suggests that close consanguineous mating was avoided (Sikora et al., 2017). For F23, we identified 1570 HBD tracks longer than 0.1 cM (Supplementary Table 7), and the sum of HBD was 885.72 cM, which was similar to the levels of Native Americans (Surui and Karitiana) and was much higher than that of most modern individuals (Figure 6a, Supplementary Table 8). However, the number of HBD fractions between 2.5 and 10 cM and longer than 10 cM was much smaller than those of Native Americans and Altai Neanderthal, who seemed to have experienced mating among close relatives (Prüfer et al., 2014), and many small HBD segments were instead observed over the genomes (Figure 6b, c). We simulated random mating in small effective population sizes to determine the length distributions of the HBD and the numbers of long (>10 cM) HBD tracks and compared them with the results from F23. The total length of HBD tracts was much longer than that of simulated data, which may be because of the small population size in northern Jomon populations, whereas the number of HBD tracks longer than 10 cM was mostly the same as that of simulated data (Supplementary Table 9); these data do not support consanguineous marriage for F23.
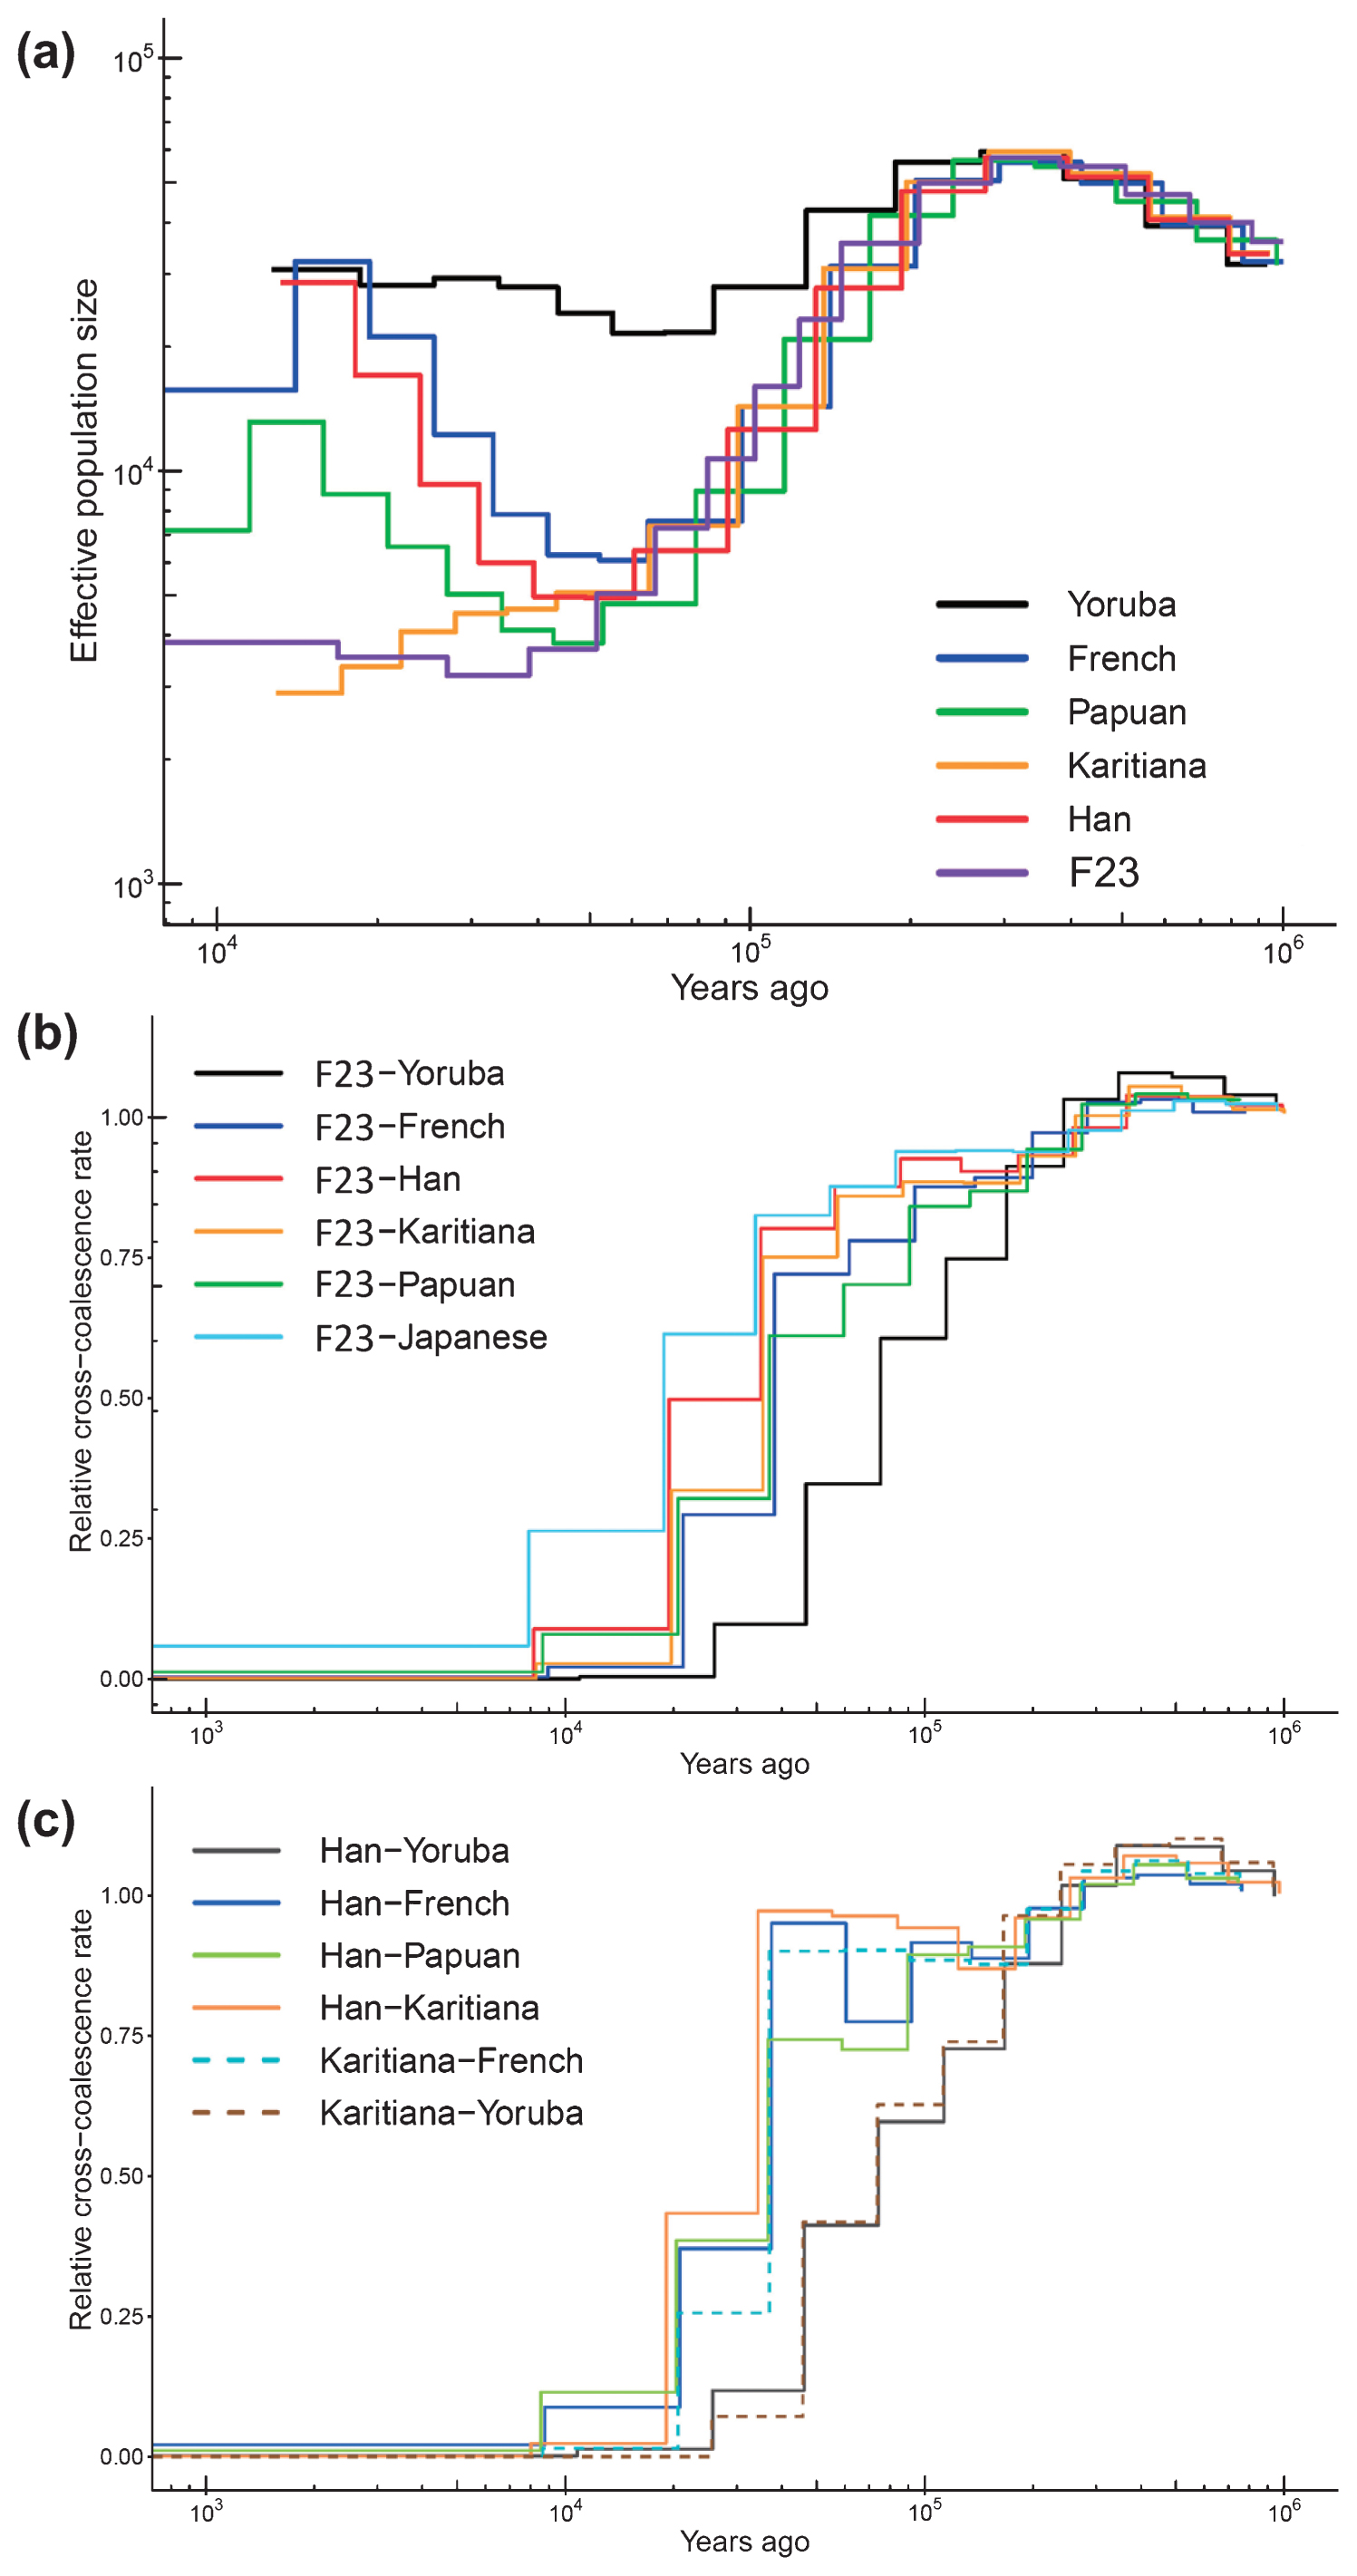
Next, we estimated long-term effective population size (Ne) changes and divergence times using the MSMC program. For F23, Ne up to 10000 YBP could be estimated because only two haplotypes were available, and the date of F23 (3500–3800 YBP) should be added compared with that of modern humans. F23 showed Ne patterns similar to those of other out-of-Africa populations up to 50000 YBP (Figure 7a). After that point, F23 Ne continued to decrease, whereas European and East Asian Ne started to increase. We also estimated the average divergence times between F23 and worldwide populations. Figure 7b, c shows the relative cross-coalescence rate (RCCR) over time for each pair of populations. If the population pairs had not diverged (i.e. belonged to the same ancestral population), the RCCR value would be close to 1. Conversely, when the population pairs had completely diverged, RCCR would be 0. The actual process of population divergence can span several thousand years; however, for simplicity, we will focus on the mid-point of population divergence (RCCR 0.5). The F23–French and Han–French divergences were quite similar, approximately 40000 YBP. This was fairly consistent with previous ancient genome studies (Seguin-Orlando et al., 2014; Yang et al., 2017). The divergence time between F23 and Han was estimated to be 18000–38000 YBP. Caution is advised when interpreting population divergences because they are only an approximation and may vary when different individuals and/or filtering methods are used.
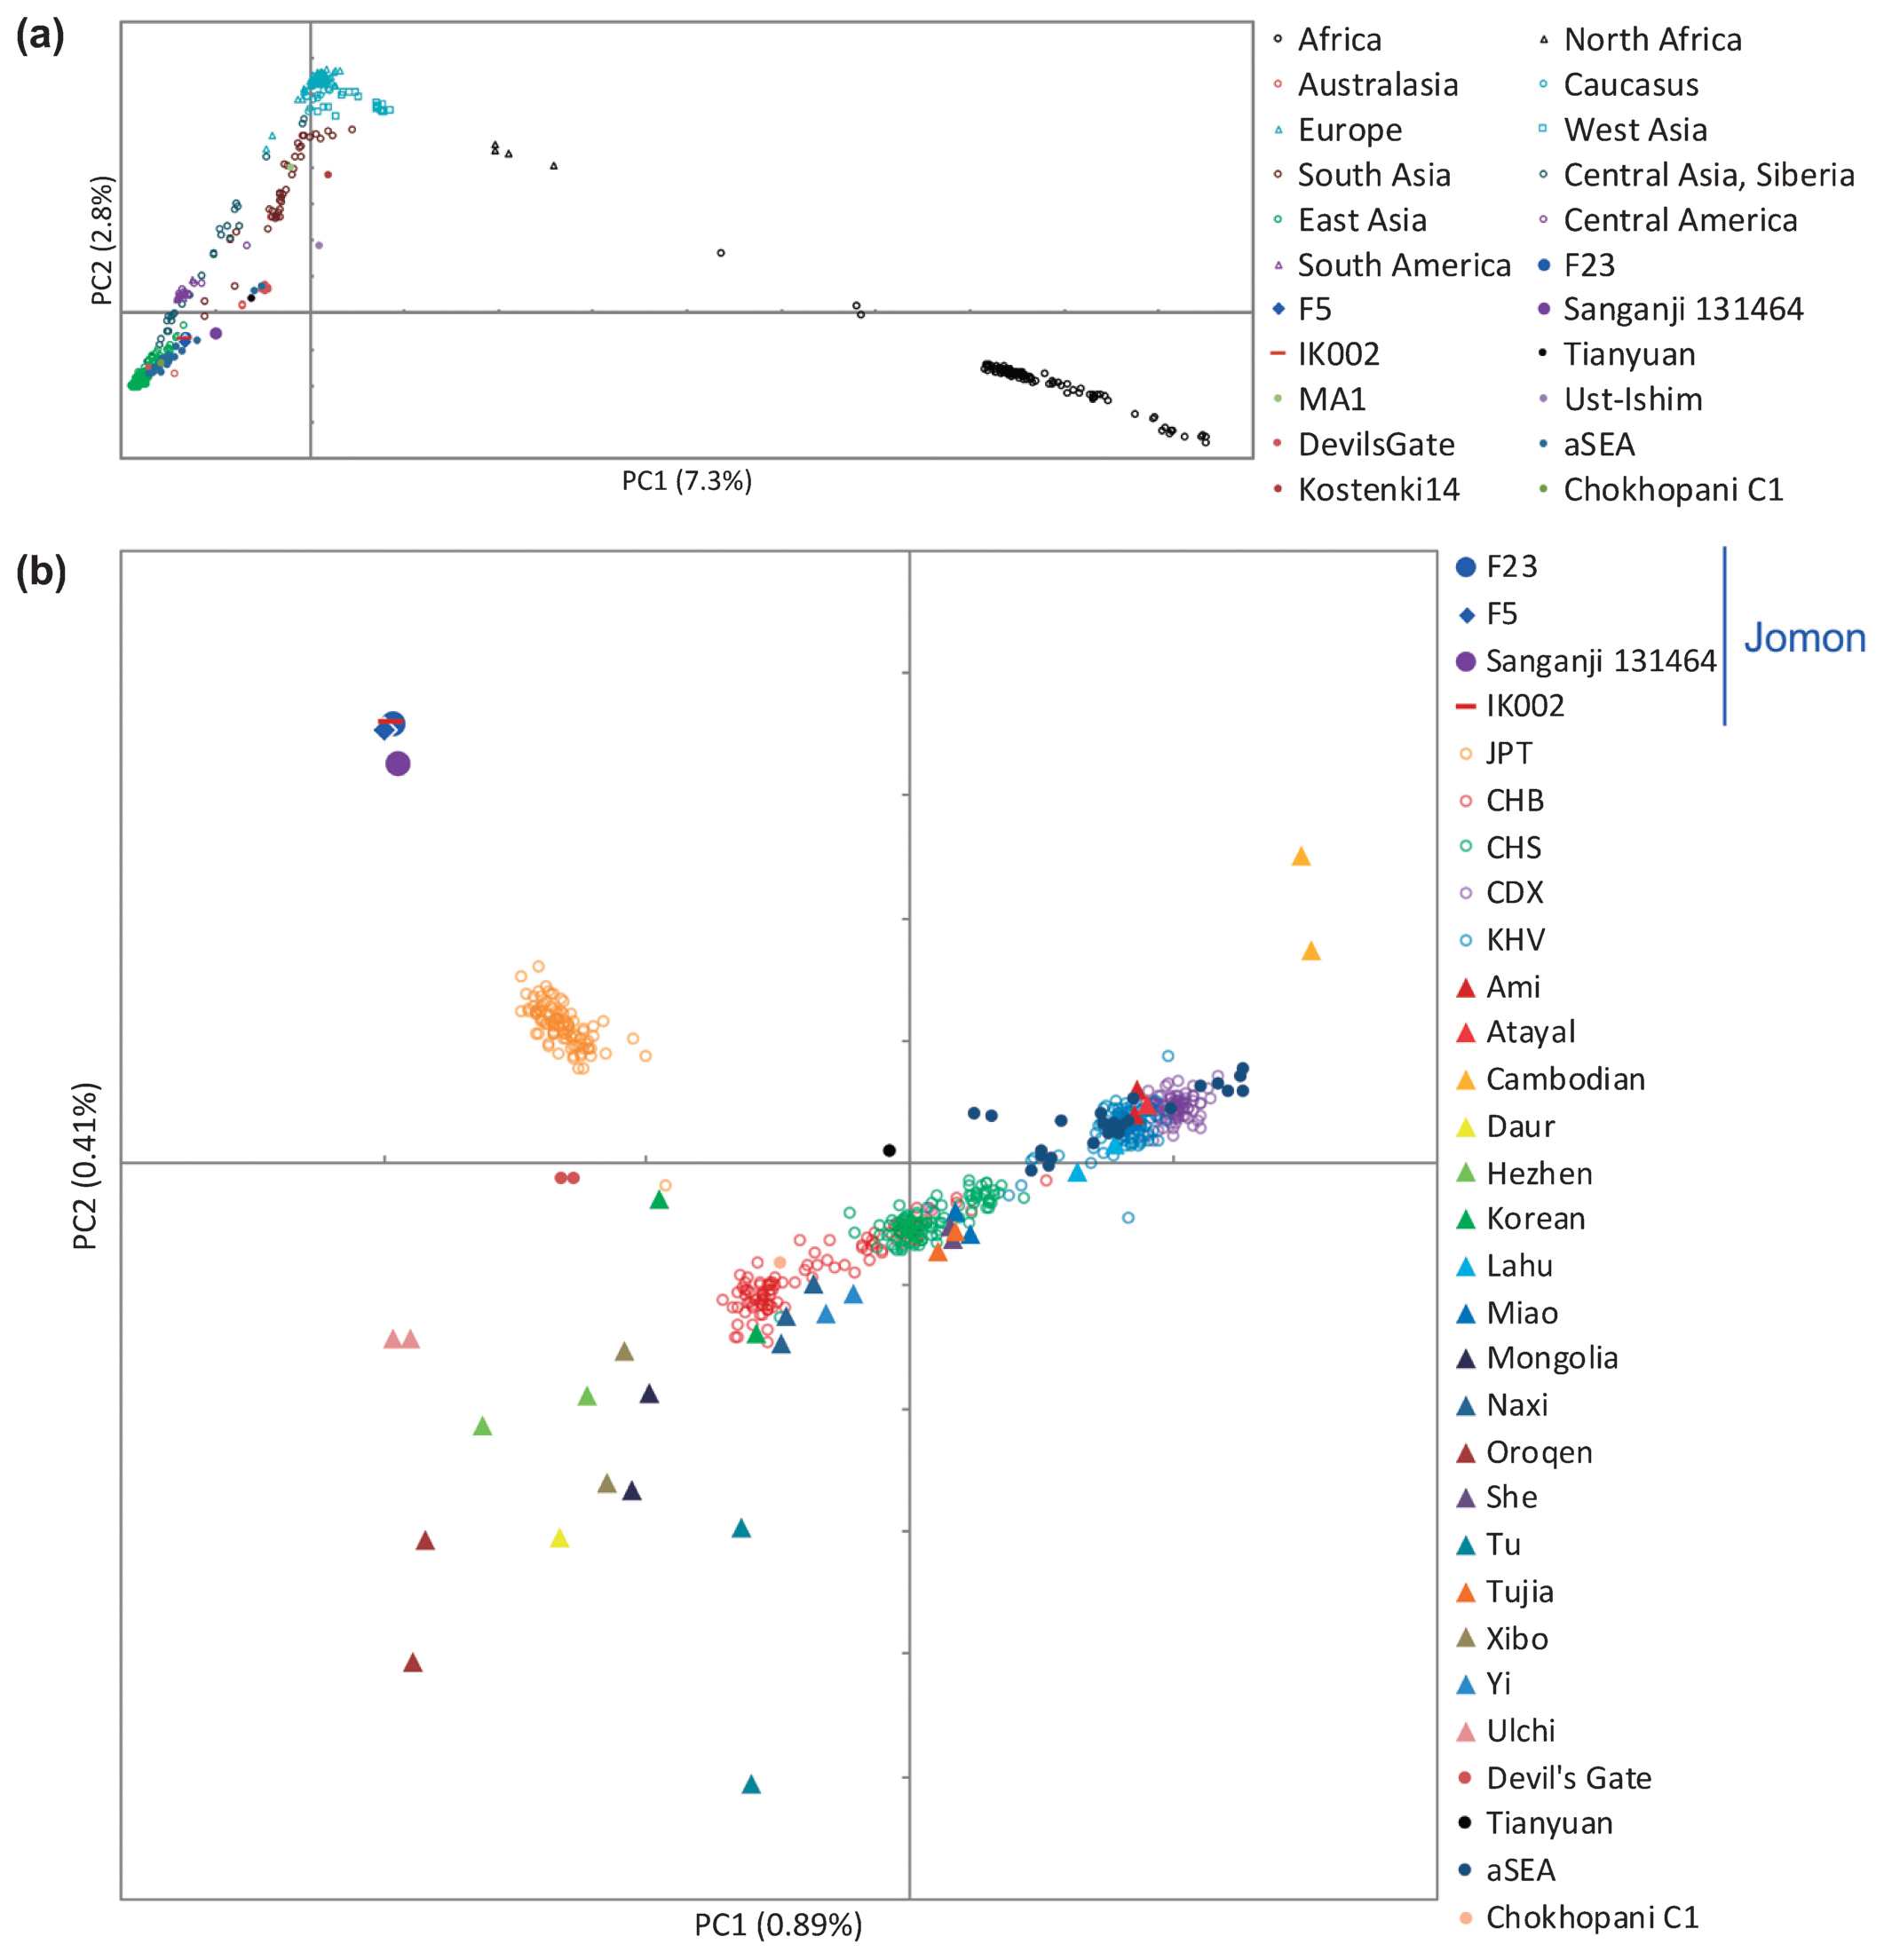
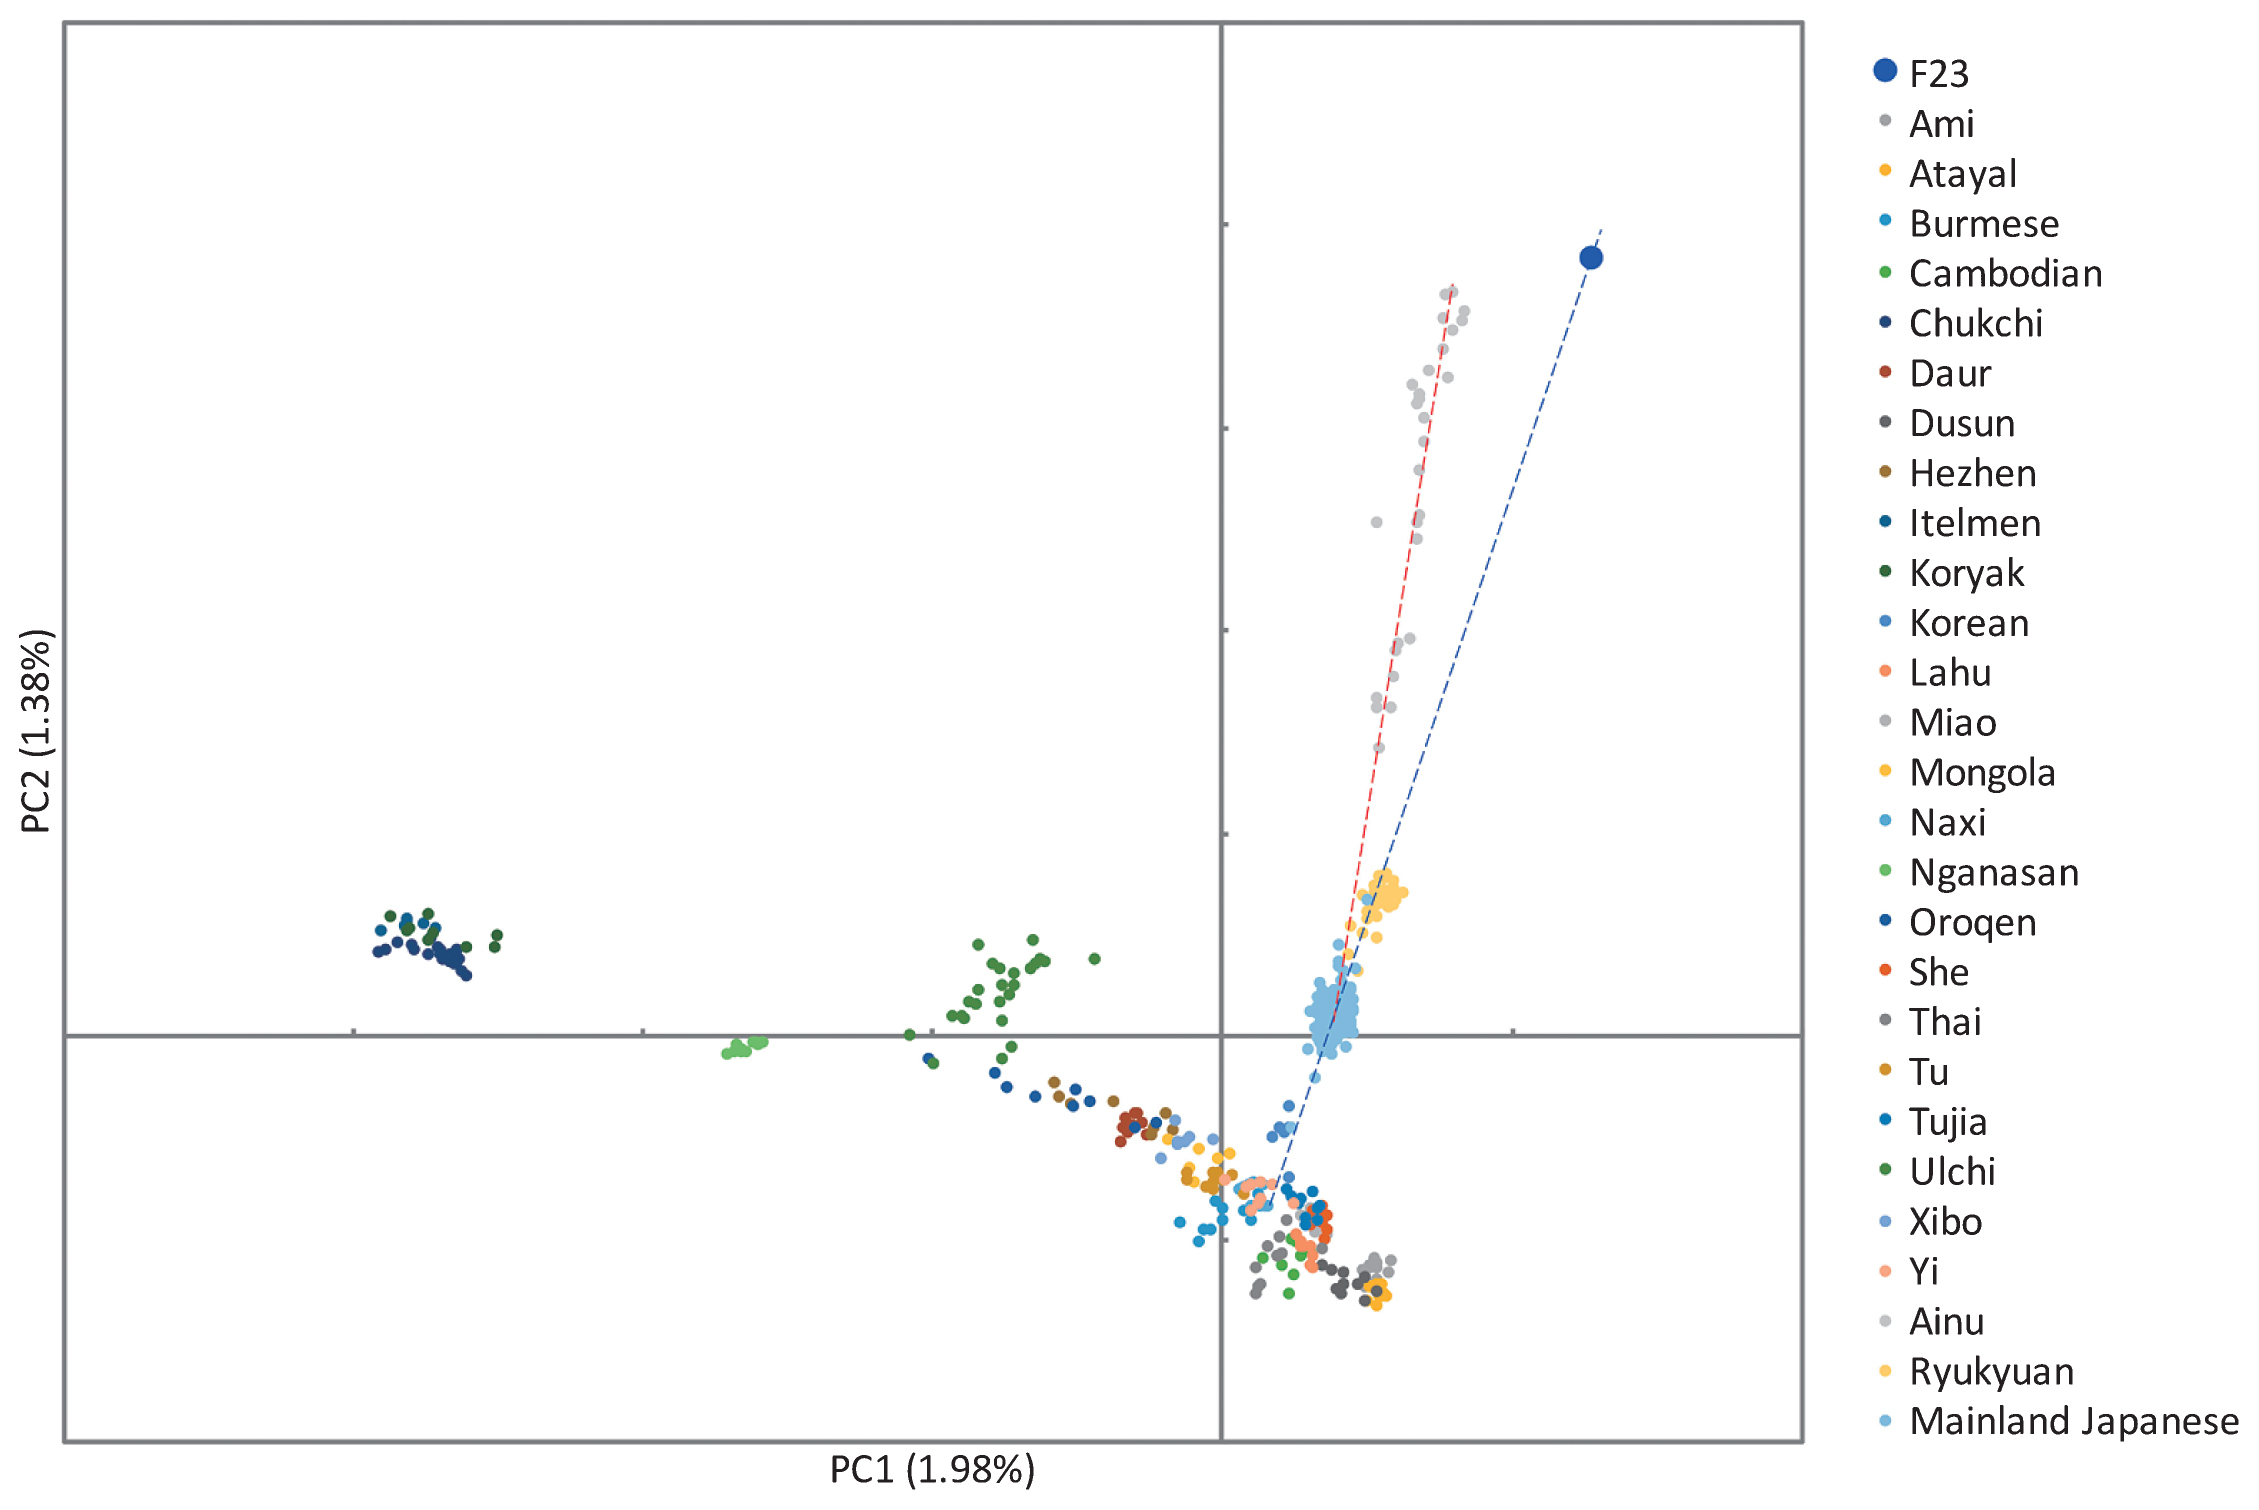
When worldwide populations were compared with F23 using PCA, Funadomari Jomons were closer to East Eurasians than to Africans, Europeans, Sahulians, and Native Americans (Figure 8a), consistent with the previously reported Sanganji Jomon genome (Kanzawa-Kiriyama et al., 2017). Next, comparison with East Asians showed that Funadomari Jomons were distinct from other modern East Eurasians. Modern Japanese individuals were situated between Jomons (Funadomari, Sanganji, and Ikawazu) and continental Northeast Eurasians (CHB, Naxi, and Yi; Figure 8b). The four Jomon individuals clustered tightly.
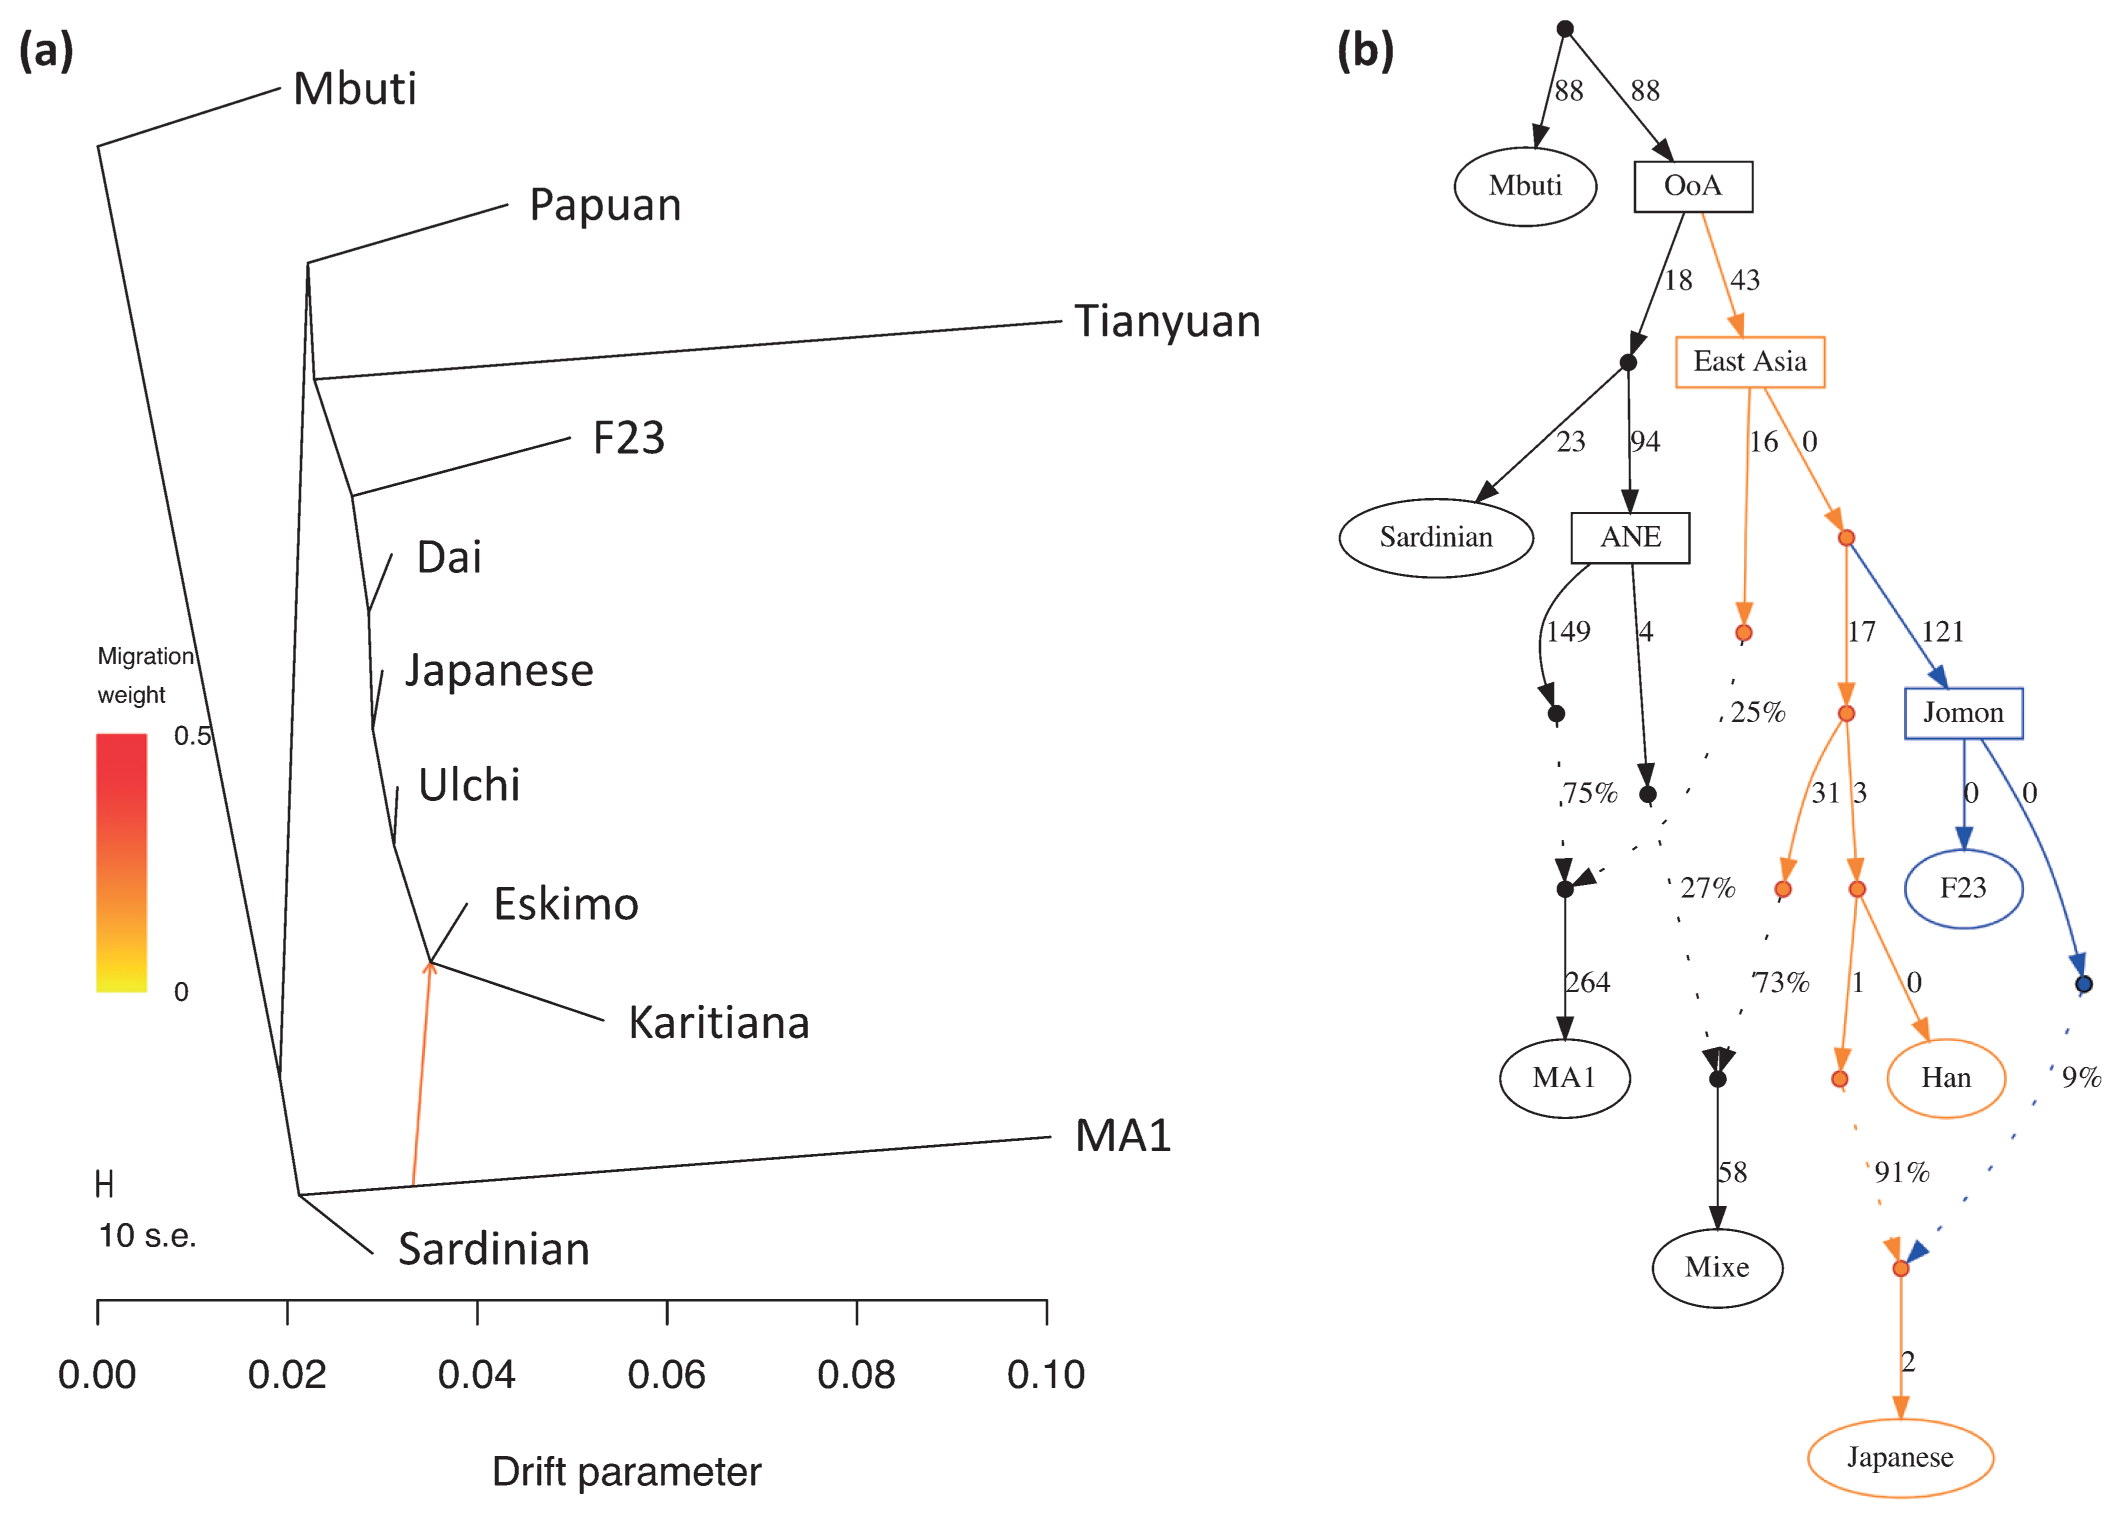
We then investigated the phylogenetic relationships between F23 and modern and other ancient human populations using pairwise Fst distances with the neighbor-joining method (Supplementary Figure 11). After the split with Papuans, F23 appeared basal to other South and East Asians, including Native Americans, consistent with the previous observation in Sanganji Jomon (Kanzawa-Kiriyama et al., 2017). Next, we used TreeMix for tree reconstruction with migration events. When one migration event was assumed, F23 diverged before the split of modern East Eurasians and Native Americans, after the separation of 40000 year old Tianyuan (Figure 9a and Supplementary Figure 12). The migration event from 24000 year old Mal’ta MA1 in south-central Siberia to the ancestor of Native Americans and Northeastern Siberians was observed, in agreement with Raghavan et al. (2014). Native Americans initially diverged from modern East Asians c. 36 ± 1.5 ka, with gene flow persisting until c. 25 ± 1.1 ka (Moreno-Mayar et al., 2018), implying that the split time of F23 from other populations was before or around 25000 YBP, which was within the range of divergence time between F23 and Han, i.e. 18000–38000 YBP, as estimated by MSMC analysis. The relative order of the population divergence time is also informative for interpreting whether the split of F23 was earlier than the ancestors of Han and Native Americans. The divergence times of Karitiana–F23 and Karitiana–Han were 39 and 38 kya, respectively, which again supports the older divergence of F23 in East Eurasia, including modern Native Americans (Figure 9a, Supplementary Figure 12) because the divergence time would be the same if the split of Karitiana–Han/F23 was earlier than that of F23–Han. In addition, the deep divergence of F23 was confirmed by f4-statistics. f4 (African, Amerindian; Han, F23) showed strong genetic affinity between Native Americans and Han compared with F23 (Supplementary Table 10), suggesting that the ancestor of Han and Native Americans maintained gene flow even after the ancestor of F23 diverged from these populations. f4 (African, Tianyuan; East Asian, F23) and f4 (African, F23; East Asian, Tianyuan) showed that Tianyuan was located in the outgroup of both Funadomari Jomons and modern East Asians (Supplementary Tables 11 and 12). TreeMix also inferred that modern Japanese carry 15.7% of Northern Jomon ancestry (Supplementary Figure 13), which is consistent with the result (12%) for the Sanganji Jomon genome (Kanzawa-Kiriyama et al., 2017).
Next, we assessed the possibility of gene flow between non-East Asians and the ancestor of Funadomari Jomons to explain the deep divergence. f4 (African, non-East Asian; East Asian, F23) showed that no modern populations, except for Sardinian, Relli, and Aboriginal Australian, who had small positive f4 values (but without statistical significance), supported the gene flow (Supplementary Table 13). The 24000 year old MA1 also did not support the gene flow (Supplementary Table 14). We also compared Funadomari Jomons with Ust’-Ishim, a 45000 year old Upper Paleolithic individual from Siberia who diverged from the Asian lineage c. 48000 years ago, soon after the initial divergence among Eurasians c. 52500 years ago (Sikora et al., 2017). Our results showed that Ust’-Ishim was equally distant to East Asians and Funadomari Jomons (Supplementary Table 15). The effects of postmortem changes are less likely to explain the deep divergence because the SGDP dataset we used in this analysis included only transversion sites, which had much smaller error rates than transition sites (Supplementary Figure 4). We also considered the possibility of reference bias in F23, but the affinity between the human reference genome (GRCh37) and F23 compared with that of other East Asians was not identified (Supplementary Table 16). Thus, it is more plausible that Funadomari Jomons had deep divergence without any gene flow with outgroups.
We then tested models of the phylogenetic relationships among F23 and Eurasians and Native Americans based on F-statistics using qpGraph. We began with the tree of Mbuti, Sardinian, and Han. When 10 different simple or admix tree models were tested to add F23 into the three-population tree, two trees were supported: (1) the simple tree, in which F23 first clustered with Han (Z = 2.073); and (2) the admix tree, in which the admixture of East Eurasian Han (86%) and West Eurasian Sardinian (14%) explained the ancestor of F23 (Z = 0.011). When we used French instead of Sardinian, both the simple tree and the admix tree became the best model (Z = −0.241 for both trees and the proportion of the admixture was 99% and 1% in the admix tree model). Next, we added MA1, Native American Mixe, and Japanese to the simple tree sequentially to verify the earlier split of F23 than Native Americans. We found that the earlier split of F23 was best fit to the model (Z = 2.073; Figure 9b) and that none of the models assuming a later split of F23 was supported. It is also unlikely that the three populations had a star-like phylogeny (|Z| = 8.606–12.691). The earlier split was reproduced, even if gene flow from West Eurasians into F23 was assumed (Supplementary Figure 14). We reproduced the same tree topology and admixture, even when French was used instead of Sardinian (Supplementary Figure 15).
Genetic affinities to coastal and marine areas of East Asians in Funadomari Jomons
We tested F-statistics using both array-based data and genomic data to examine the signature of the admixture event. Outgroup-f3-statistic tests showed that Ulchi, Taiwan aboriginal (Ami and Atayal), Taiwanese (Minnan and Hakka), Korean, Philippine (Igorot, Kankanaey, Illocano, and Urban), modern Japanese (Mainland Japanese and Ryukyuan) populations, and Devil’s Gate 1 and 2 tended to be genetically closer to Funadomari Jomons than to other East Eurasians (Figure 10, Supplementary Figure 16, and Supplementary Tables 17–19). Similarly, we computed f4-statistics and found that Funadomari Jomons shared significantly more alleles with modern Japanese, Ulchi, Korean, Taiwanese, and Urban in the Philippines than with Han Chinese (Z > 3; Supplementary Tables 20–22). The affinity between F23 as well as IK002 and ancient Southeast Asians, Ma911 and La368, as reported by McColl et al. (2018), was also identified (Supplementary Table 23). The affinity between Devil’s Gate and F23, observed in outgroup-f3-statistics, was not supported. Although Tibetan and F5 share the same Y-haplogroup, D, the affinity with F5 in Tibetan compared with other East Asians was not identified.
In contrast, Funadomari Jomons share fewer alleles with many Southeast Asians (e.g. Burmese, Cambodian, and Thai) and some Central and Northeast Asians (Daur, Mongolia, Naxi, Tu, Xibo, Yi, and Sherpa) than with the Han Chinese at significant level (Z < −3), although Funadomari Jomons formed a phylogenetic outgroup of these Asian populations. The reduced allele sharing was important for detecting ancient gene flow from outgroups into Asians and investigating Neolithic population structure. Thus, we next tested whether the reduced similarities could be explained by the gene flow between these populations and three outgroups (Papuan, Bengali, and French). Although the reduced similarities with some Northeast Asians could be explained by gene flow with the outgroup genetically close to French because Northeast Asians shares more alleles with French than Han Chinese, gene flow with the three outgroups was not identified in Southeast Asians (Supplementary Tables 24 and 25).
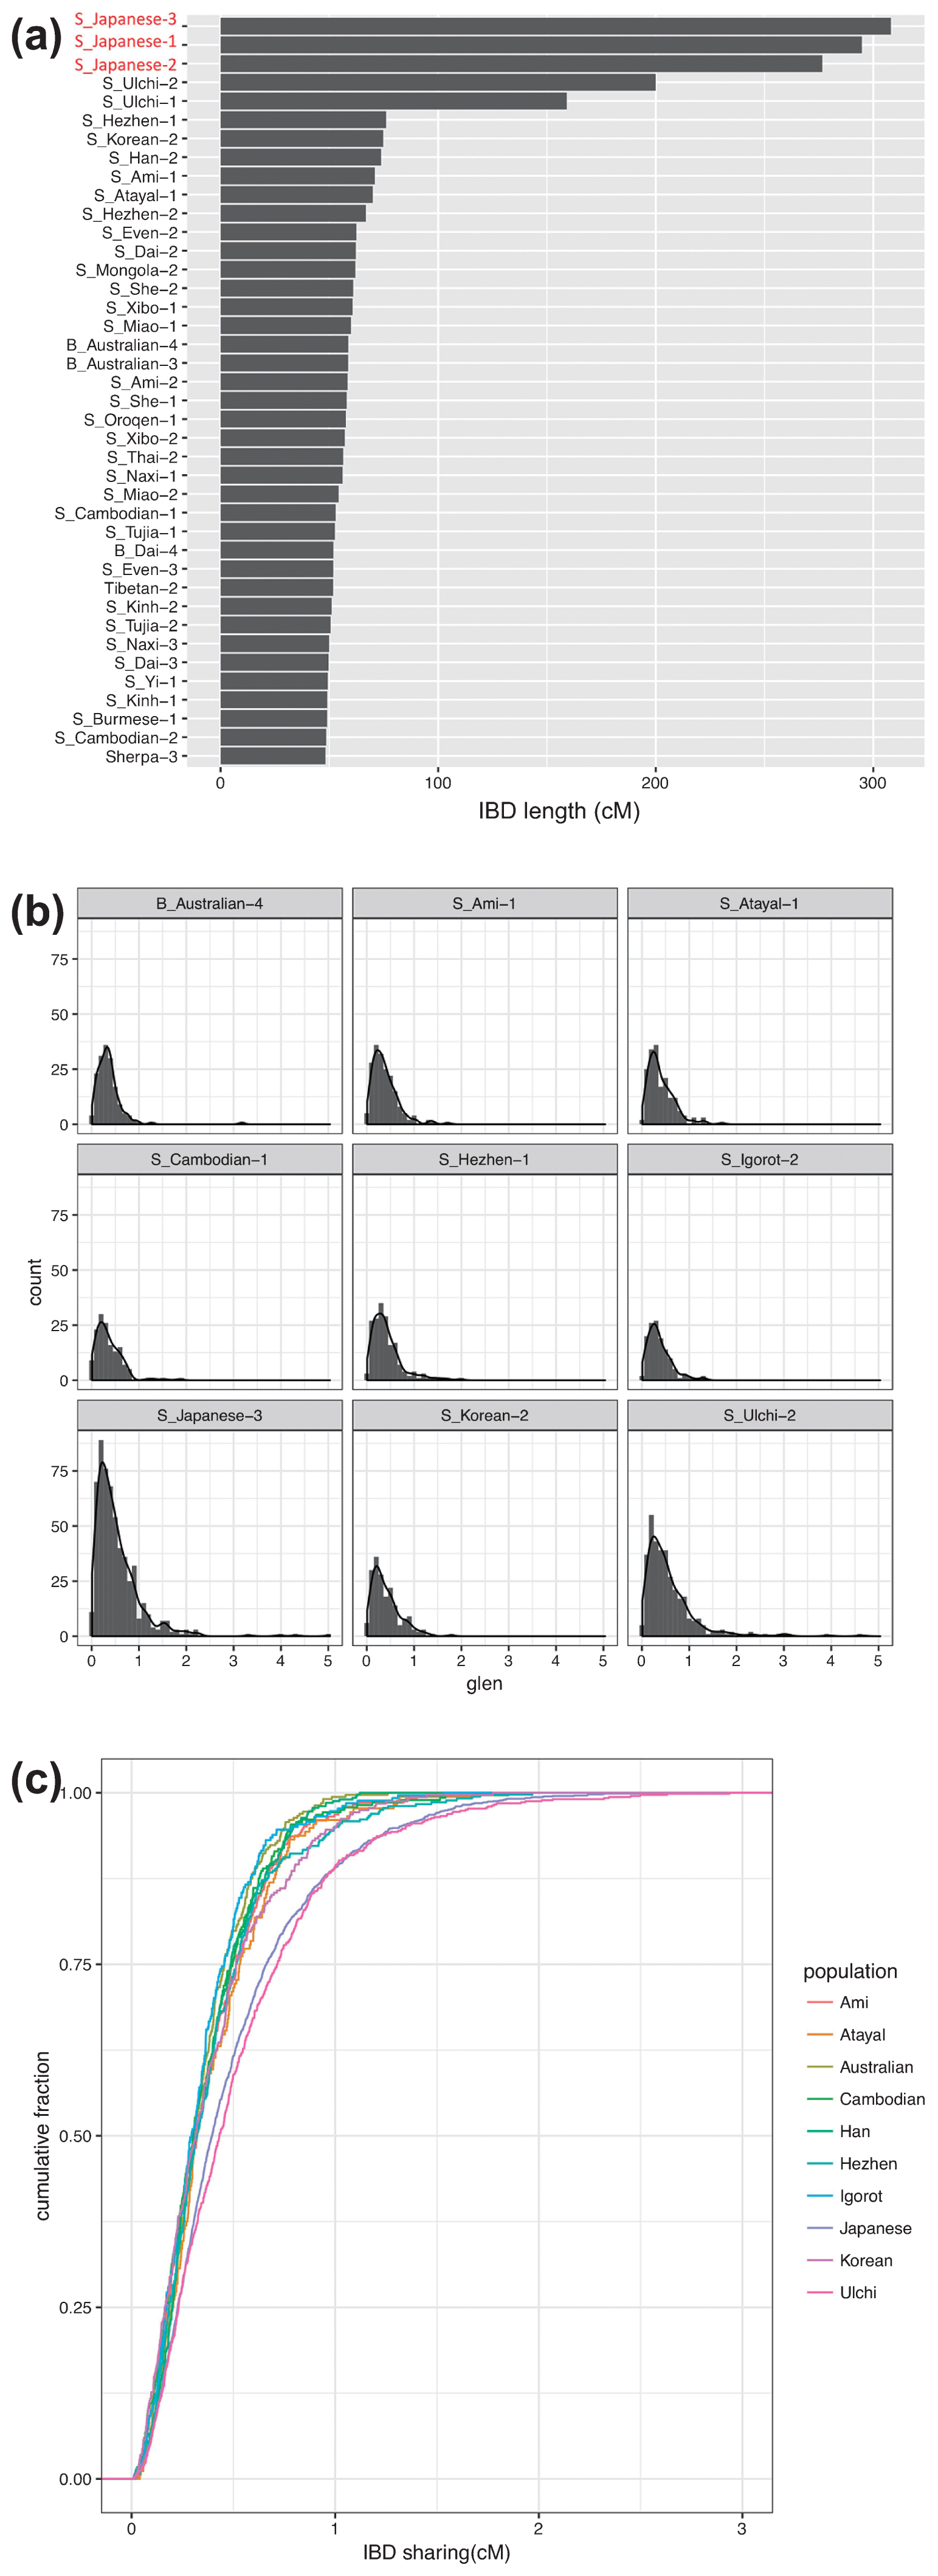
We then analyzed shared long haplotypes, i.e. IBD, between F23 and SGDP individuals to identify admixture events. The IBD sharing showed that Mainland Japanese, followed by Ulchi, Hezhen, Korean, Ami, and Atayal, who were geographically closer to the Funadomari site, shared more genomic regions with F23 than the other East Eurasian and Native Americans, which are more or less consistent with the results of PCA and F-statistics (Figure 11a, Supplementary Figure 18, and Supplementary Table 26). The IBD segments were widely distributed in the Japanese genome (Supplementary Figure 19). Analysis of the length distributions of the IBD fragments showed that Japanese and Ulchi had longer IBD segments than other East Asians (Figure 11b), and the cumulative distributions were significantly different from those of other East Eurasians, including Hezhen, Korean, Ami, and Atayal (Figure 11c), suggesting that gene flow between F23 and Japanese/Ulchi occurred more recently than that of the other four populations. We also used phased genome data, which offered more sensitivity to subtle population structure than unphased data, and again observed that F23 shared more chunks of DNA with Japanese, Ulchi, and Korean than with other East Asians (Supplementary Figures 20, 21a, 21b). Intriguingly, we found that F23 shared more haplotypes with Aboriginal Australians than with most East Asians. IBD sharing analysis (Supplementary Table 26) and f4-statistics (Supplementary Table 13) also showed the same patterns, although the signal was weak and not significant (f4 (Mbuti, Australian; Han, F23) = 0.000115, Z = 1.092). Further studies with more northeast and southwest Jomon genomes are needed to verify this affinity.
A comparison of MA1 with the Funadomari Jomon genome and modern East Asians showed that MA1 was genetically equally distant to most East Asians and to Funadomari Jomons (Supplementary Table 14), consistent with a previous study (Kanzawa-Kiriyama et al., 2017). These results suggested that the gene flow event was close to or earlier than the split of the ancestor of Funadomari Jomons and East Asians. In contrast, f4-statistics detected that some modern northern and western Europeans were genetically closer to modern East Asians than to Funadomari Jomons, although the result was not significant (Supplementary Table 13). For more detail, we used S-statistics, which is a haplotype-based analytical method that is more sensitive than f4-statistics and is considered as insensitive to ancestral polymorphisms. We observed that Saami, Finnish, and Russian shared more alleles with East Asians than with F23 (Supplementary Table 27). Similar patterns were also observed in some of other non-African populations. Bougainville from Papua New Guinea shared more alleles with East Asians than with Funadomari Jomons (Supplementary Tables 13 and 27).
Aboriginal Australian, Papuan, Andamanese Onge, and Tianyuan share more alleles with two Amazonians (Karitiana and Surui) than with other Native Americans, and it was estimated that the Amazonians could be described as a mixture of other Native Americans and 9–15% of an ancestral population related to Australian, Papuan, the Andamanese Onge, and Tianyuan (Skoglund et al., 2015; Yang et al., 2017). We again observed a significantly high level of affinity between Amerindians and Tianyuan as well as Igorot, Australian, Dusun, and Papuan (f4 test: Z > 3; Supplementary Table 28). In contrast, although Funadomari Jomons and some East Eurasians (e.g. Yi and Ami) also had positive f4-values, these relationships were not significant (Z > 3), suggesting that Funadomari Jomons and most East Asians were not related to the ancestral population contributing to Amazonians.
Modern East Asians carry ancestry from both Neanderthal and Denisovan (Green et al., 2010; Reich et al., 2010, 2011). Funadomari Jomons shared as much Neanderthal and Denisovan DNA as other Native Americans and East Eurasians (Supplementary Tables 29–32). IBD also detected shared haplotypes between Funadomari Jomons and Altai Neanderthal (1.516 cM) and between Funadomari Jomons and Denisovans (0.120 cM), similar to the shared haplotypes among other Eurasian populations (Supplementary Tables 33 and 34).
Ancestral makeup of modern Japanese Archipelago populations
Comparison of two Jomons, F23 and IK002, with worldwide populations using f4-statistics suggested that the two Jomons were equally distant to other populations, except for Ainu, who are significantly closer to F23 (Supplementary Tables 35 and 36). Then, we compared F23 with three Japanese populations (Ainu, Mainland Japanese, and Ryukyuan) and other East Eurasians using PCA, and showed that while the Ainu were genetically closest to F23, they did not exactly cluster together (Figure 12, Supplementary Figures 22 and 23). Phylogenetic trees demonstrated that F23 and Ainu form a clade located outside the East Asian cluster (Supplementary Figures 24a and 25a), or inside the cluster in which Japanese and Ryukyuan pull the clade (Supplementary Figures 24b and 25b, c). We then used admixture f3-statistics to identify other populations that may have contributed to the genetic ancestry of the Ainu. Using F23 as a source population, we found that Siberian populations, particularly Koryak and Itel’men, showed negative f3-values with significant Z-scores (Z < −3), suggesting that they had some genetic contributions in the formation of the Ainu (Supplementary Figure 26, Supplementary Table 37). We used the same method to identify populations that contributed to the genetic formation of the mainland Japanese and Ryukyuan, using F23 as a source population. Source populations that showed the most significant Z-score (Z < −3) were Korean, followed by She and Han, for both Mainland Japanese and Ryukyuan (Supplementary Tables 38 and 39).
Finally, we estimated the proportion of Jomon DNA in three Japanese populations using the f4-ratio-test. When using Korean as a source population, the Jomon ancestry proportion in mainland Japanese was 13%, slightly smaller than the values of TreeMix (15.7%) and qpGraph analyses (9%; Figure 13, Table 5). The proportions were approximately 27% and 66% for Ryukyuan and Ainu, respectively. When more northern populations were used as source populations for testing the Ainu, the Jomon ancestry proportion was decreased. In addition to Jomons, other Northeast Asian populations, such as Ulchi, Hezhen, and Mainland Japanese, as well as Kamchatka people, may have directly or indirectly contributed to the genetic diversity of the Ainu, although we could not identify the source populations in the current study.
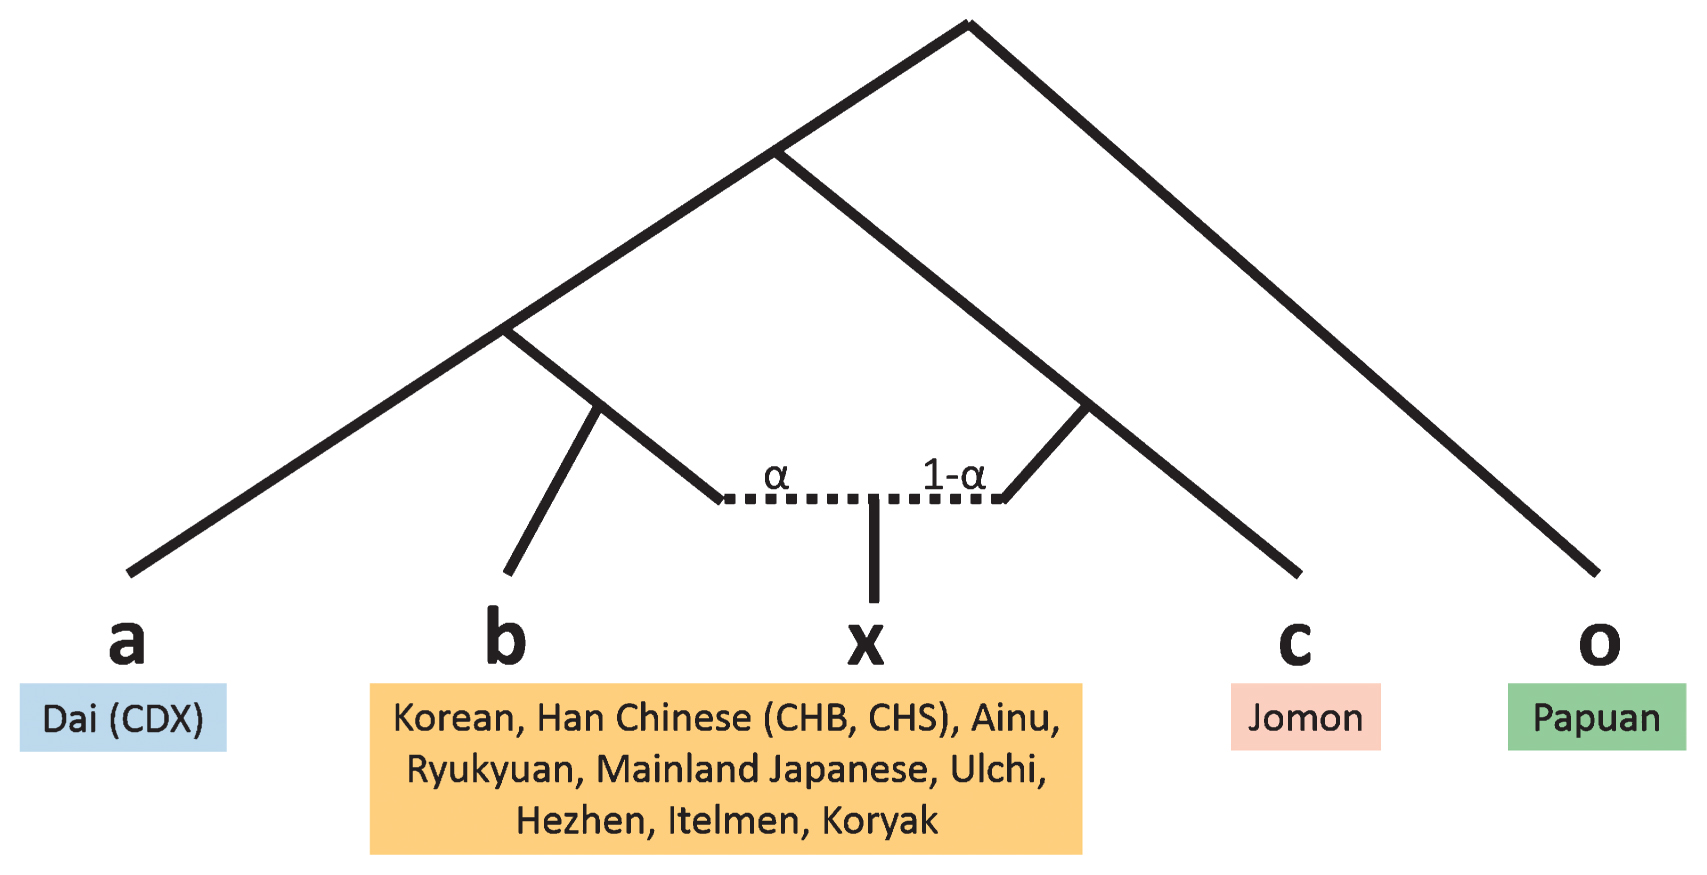
Table 5
Mixture proportions estimated with the ratio f4(CDX, Papuan; Test, F23)/f4(CDX, Papuan; other East Asian, F23) using 130K SNPs
| a |
b |
x |
c |
o |
alpha |
1–alpha |
SE |
Z-score |
| CDX |
Korean |
Mainland Japanese |
F23 |
Papuan |
0.873 |
0.127 |
0.024 |
36.76 |
| CDX |
CHB |
Mainland Japanese |
F23 |
Papuan |
0.863 |
0.137 |
0.015 |
56.33 |
| CDX |
CHS |
Mainland Japanese |
F23 |
Papuan |
0.816 |
0.184 |
0.016 |
52.48 |
| CDX |
Korean |
Ryukyuan |
F23 |
Papuan |
0.734 |
0.266 |
0.024 |
30.71 |
| CDX |
CHB |
Ryukyuan |
F23 |
Papuan |
0.726 |
0.274 |
0.018 |
39.87 |
| CDX |
CHS |
Ryukyuan |
F23 |
Papuan |
0.686 |
0.314 |
0.018 |
37.63 |
| CDX |
Korean |
Ainu |
F23 |
Papuan |
0.338 |
0.662 |
0.040 |
8.53 |
| CDX |
CHB |
Ainu |
F23 |
Papuan |
0.334 |
0.666 |
0.039 |
8.62 |
| CDX |
CHS |
Ainu |
F23 |
Papuan |
0.316 |
0.684 |
0.037 |
8.57 |
| CDX |
Ulchi |
Ainu |
F23 |
Papuan |
0.509 |
0.491 |
0.053 |
9.57 |
| CDX |
Hezhen |
Ainu |
F23 |
Papuan |
0.457 |
0.543 |
0.049 |
9.29 |
| CDX |
Itelmen |
Ainu |
F23 |
Papuan |
0.869 |
0.131 |
0.127 |
6.87 |
| CDX |
Koryak |
Ainu |
F23 |
Papuan |
0.781 |
0.219 |
0.100 |
7.80 |
| CDX |
Mainland Japanese |
Ainu |
F23 |
Papuan |
0.388 |
0.612 |
0.043 |
9.10 |
| CDX |
Ryukyuan |
Ainu |
F23 |
Papuan |
0.461 |
0.539 |
0.048 |
9.57 |
Discussion
This study is the first report of a high-quality genome sequence and Y chromosome haplotype in the Jomon people. Our data provide clear evidence of phenotypic characteristics and phylogenetic relationships among the Jomon, other anatomically modern human populations, and archaic humans. Morphological studies of bones and teeth have shown the unique characteristics of the Jomon people, namely diminutive stature (Suzuki, 1969), smaller teeth than immigrant Yayoi farmers (Brace and Nagai, 1982), prominent glabella, low and broad face with a high nasal bridge (Yamaguchi, 1992), and more frequent non-shovel-shaped teeth than modern East Asians (Matsumura, 1995). Other physiological and morphological traits of Jomon people unidentified from skeletal remains, e.g. alcohol tolerance (Koganebuchi et al., 2017), Rh-blood type, and ear wax (Omoto, 1992), have been inferred indirectly from the geographical distribution of variants in the Japanese archipelago. Recent ancient DNA studies also uncovered phenotypic traits of Jomons, such as ear-wax and ABO blood type (Sato et al., 2009b, 2010). Most of these anthropological traits were observed in F23. One allele of her ABO blood type, Ax02 allele, is rare in modern mainland Japanese (Iwasaki et al., 2000) and other populations; for example, the frequencies of Ax0201 and Ax0202 are 0.006% and 0.015%, respectively, in Germans (Lang et al., 2016). C261del and C297G variants classify her another allele, O-type, into O0201, and the subtype is more frequent in Ryukyuan than in Mainland Japanese (Nakamura, 2008).
Importantly, we detected some medically relevant variants relating to disorders. The p.Pro479Leu variant in CPT1A was homozygous in F23. Since this variant was also observed in F5, it is likely that this variant had a high allele frequency in the Funadomari Jomon population. CPT1A is essential for fatty acid metabolism, and the p.Pro479Leu variant in CPT1A is strongly associated with various disorders, such as hypoketotic hypoglycemia and high infant mortality, and with reduced insulin resistance and smaller body size, including weight, lean mass, height, and body mass index (Clemente et al., 2014; Andersen et al., 2016; Skotte et al., 2017). The frequency of this variant is about 56% in Koryak; more than 70% in indigenous arctic populations, including Southwest Alaska Yup’ik, Inuit from Greenland, and Canadian Nunavut Inuit; 90% in Chukchi; and more than 95% in Nunavik Inuit; but is absent elsewhere (Greenberg et al., 2009; Rajakumar et al., 2009; Lemas et al., 2012; Clemente et al., 2014; Zhou et al., 2015; Skotte et al., 2017). Clemente et al. (2014) showed evidence of strong selective sweeps in this variant within the last 6–23 ka in Arctic populations, despite the associated deleterious consequences, and they suggested that this was a result of a selective advantage for either a high-fat diet or a cold environment. Moreover, this amino acid change provided a metabolic advantage for high-fat diet. Hokkaido Jomon people engaged in hunting of not only land animals, such as deer and boars, but also marine fishing and hunting of fur seal, Steller’s sea lions, sea lions, dolphins, salmon, and trout (Nishimoto, 1984). In particular, many relics related to hunting of ocean animals have been excavated from the Funadomari site. A marine reservoir effect was also observed in F23 (77.6%) (Supplementary Table 1). Therefore, it seems reasonable to conclude that they depended on sea animals as a main food source. The presence of the p.Pro479Leu variant seemed to be highly related to their lifestyle. Although Funadomari Jomons shared this rare variant with modern-day arctic populations, suggesting a genetic link between Funadomari Jomons and ancient northern populations, this finding does not necessarily imply that the ancestor of Funadomari Jomons originated from northern East Eurasia since we did not find strong signals from IBD, F-statistics, and fine-STRUCTURE tests. Further studies with more Jomon genomes are needed to determine when and how the variant arose, whether selective sweep occurred independently, and whether this variant was common in (northeast) Jomon people.
Our data supported the divergence of the northern Jomon people before the split of the ancestors of Native Americans and East Asians. Moreno-Mayar et al. (2018) estimated that the Native American and East Asian split occurred more than 25000 YBP. Our MSMC results showed that the Funadomari Jomon divergence with Han occurred between 18000 and 38000 YBP. This deep divergence was consistent with the detection of mtDNA haplogroup N9b1 and Y chromosome haplogroup D1b2b. Haplogroups N9b and D1b are localized to the Japanese archipelago, and the ages of the most recent common ancestors of N9b and D1b were estimated to be 22000 (Adachi et al., 2011) and c. 19400 YBP (Hammer et al., 2006), respectively. Evidence of deep divergence supports the idea that northern Jomon people were the descendants of Upper Paleolithic humans in the Japanese archipelago, although it is still possible that Neolithic continental East Eurasians who did not contribute to any present-day East Eurasians may have migrated and become the ancestor of the northern Jomon. Yang and Fu (2018) showed that present-day East Asian populations exhibit remarkable homogeneity relative to ancient samples from other regions and suggested that there was very little diversity in Asia during the Neolithic period, or that this is difficult to find when analyzing only present-day populations. The high genetic similarity between modern populations from the Amur Basin and 7700 year old individuals from Devil’s Gate on the border between Russia and Korea implied that there may have been a high level of genetic continuity in this region during the Neolithic period (Siska et al., 2017), and the distinctive lineage of Neolithic northern Jomon people supports the existence of genetic diversity during the Neolithic period in East Asia.
We also found a considerable genetic affinity between Funadomari Jomons and coastal and marine East Asians (Japanese, Ulchi, Korean, Ami, Atayal, and Hezhen). A recent ancient mtDNA study supported the affinity between Ulchi and Hokkaido Jomon populations, who shared mtDNA haplogroups N9b (4.4% and 64.8%), M7a2 (0.6% and 1.9%), and D4h2 (2.5% and 16.7%) (Adachi et al., 2018); among these, N9b and M7a are considered as Jomon genotypes (Adachi et al., 2009). One Jomon genotype, M7a, is also shared with Korean (3.4%) and Philippines (9.4%) (Tanaka et al., 2004). There are two possible explanations for the affinities: (1) sharing the earliest migration into coastal area of East Asia; or (2) gene flow with neighbors after the divergence of the Jomon lineage from other East Asians. The latter is likely in the Japanese and Ulchi because these populations share significantly longer IBD segments with F23 than Korean and other populations. No signals of affinity between Funadomari Jomons and Devil’s Gate, who are likely ancestors of Ulchi, also supported the latter model. However, it is difficult to judge which explanation is the best fit for the history of Korean, Ami, and Atayal in the current data. More genome data from these populations are necessary.
In contrast, Funadomari Jomons exhibited less affinity with southeast Asians (e.g. Thai, Cambodian, and Burmese) than for Han Chinese, indicative of the genetic diversity and heterogeneity in Neolithic East Asians. We consider three simple models to explain the relationships between F23, Han, and Southeast Asians (Supplementary Figure 17): (a) unknown populations, who are phylogenetic outgroups of Funadomari Jomon, admixed with the ancestor of Southeast Asians; (b) a gene flow occurred between the ancestor of Funadomari Jomons and an ancient population related to the Han Chinese after the first divergence of the Hokkaido Jomon lineage; and (c) after the ancestor of Funadomari Jomons and continental Northeast Asians split from ancient Southeast Asians, the ancient Southeast Asians strongly admixed with continental Northeast Asians. Pickrell and Pritchard (2012) inferred that Cambodians could trace approximately 16% of their ancestry to a population ancestral to other extant East Asian populations, who are equally related to both Europeans and other East Asians (while the remaining 84% of their ancestry is related to other southeast Asians). If Cambodians are the admixed population between southeast Asians and an unknown Eurasian population, the first model can plausibly explain our results. However, the second and third models may still be valid and should be examined further. In addition, the genetic affinity between Jomons and two Hoabinhians from Pha Faen, Laos, and Gua Cha, Malaysia, is in contrast to these models (McColl et al., 2018). The genetic affinity with Aboriginal Australian in Funadomari Jomons compared with other East Asians also complicates our understanding of the formation of East Eurasians if the affinity is correct. Further analyses of the genomes of continental Neolithic East Eurasians and comparisons among these genomes are necessary to elucidate the detailed structure of the Neolithic population.
The deep divergence of the Funadomari Jomon lineage from other populations older than at least 18000 YBP is an indicator of the timing of gene flow between populations. Lazaridis et al. (2014) showed that Finns, Mordovians, Russians (from northwest Russia), Chuvash, and Saami were more related to East Asians than to other Europeans due to East Eurasian gene flow into the ancestors of these northeastern European populations; this event was estimated to occur 1500–2000 years ago. Friedlaender (2005) and Friedlaender et al. (2008) also suggested that Bougainville people admixed with migrants of the more recent Lapita culture 3000 years ago. These estimations are consistent with our results because these populations share more alleles with modern East Asians than with Funadomari Jomons. Yang et al. (2017) showed that 24000 year old MA1 exhibited evidence of gene flow from a population related to East and Southeast Asians. The result of this study supports that the gene flow occurred around or before the split of the Funadomari Jomon lineage.
The demographic history of the Northern Jomon people was reconstructed from the genome data in this study. Funadomari Jomons experienced consistently small effective population size after 50000 YBP, with some increases after 25000 YBP. To infer more recent population size changes (<10000 YBP), we need to accumulate more Jomon genomes; however, the high total HBD length in F23 and in southern Native Americans may indicate their small population size during this time. In contrast to southern Native Americans, F23 did not have long HBD fragments, and this and our simulation did not support consanguinity in the Jomon people of Rebun Island. This is consistent with the community structure and network of the Jomon culture. Matsumura et al. (2001) reported that both the morphological similarities and the common custom of tooth ablation suggest biological as well as cultural connections/exchanges between the Jomon people of the northernmost and southwestern regions of Hokkaido. We surmise that the population size changes in the Jomon populations (Koyama, 1978) differed according to region because the Japanese archipelago stretches over 4000 km from north to south and there are various environments. High-quality genomes from southwestern Jomon people will shed light on the relationships between population size changes and different environmental adaptations within the Japanese Archipelago.
Previous morphological studies (Matsumura et al., 2001), ancient mtDNA studies (Adachi et al., 2009), and autosomal DNA studies (He et al., 2012; Japanese Archipelago Human Population Genetics Consortium et al., 2012; Kanzawa-Kiriyama et al., 2017) have suggested that all three Japanese populations, i.e. Mainland Japanese, Ainu, and Ryukyuan, inherited Jomon DNA, with the latter two populations retaining more Jomon ancestry. The results of HLA alleles, Y-chromosome haplogroup, and autosomal DNA analysis of Funadomari Jomons are consistent with the previous studies. HLA class I alleles observed in F23 were frequent in the Ainu and Ryukyuan compared with that in the mainland Japanese. Y-chromosome haplogroup D is common in Andamanese (D*), Tibetan (D1a), and Japanese (D1b) populations (Thangaraj et al., 2003) and is rare or absent in other populations. Haplogroup D1b is observed at high frequencies in three Japanese populations: Ainu (87.6%), Mainland Japanese (36.6% and 27.8% in Honshu and Kyusyu, respectively), and Ryukyuans (55.6%) (Tajima et al., 2004); and this Y chromosome haplotype is thought to have contributed to the formation of the Neolithic Jomon males or their ancestral groups in prehistoric Japan (Hammer and Horai, 1995; Tajima et al., 2002). The classification of the F5 Y-haplogroup as D1b2b supports this hypothesis. Intriguingly, 32.7% of Japanese individuals belong to D1b1, whereas only 6.1% belong to D1b* (Naitoh et al., 2013). The frequencies of haplogroup D1b1 and D1b* are consistent with the number of individuals classified into D1b1 (n = 17) and D1b2 (n = 3), which were used in the Y chromosome trees. Because the majority of modern Japanese individuals belong to D1b1, F5 had a rare type. Autosomal DNA analysis also shows the affinities, and the proportions of Jomon DNA in mainland Japanese and Ryukyuan were estimated to be 9–13% and 27%, respectively, which were within the range of ratios reported by Jinam et al. (2015). The current mainland Japanese and Ryukyuan are widely accepted to be a result of admixture of indigenous Jomon and later migrants. The latter were agricultural people who migrated from continental East Asia to the Japanese archipelago probably via the Korean peninsula during and after the Yayoi era. We identified the geographic origins of the agricultural people as populations related to Korean, She, or Han, as previously described by Jinam et al. (2015) and Takeuchi et al. (2017). Additionally, previous studies on nonmetric cranial traits (Shigematsu et al., 2004) and modern/ancient DNA analysis (Tajima et al., 2004; Sato et al., 2007, 2009a, b; Adachi et al., 2018) suggested the considerable genetic influence of the aboriginal people of the Lower Amur/Sea of Okhotsk region on Ainu. In the current study, the Ainu was genetically closest to the Funadomari Jomon, but also received gene flow from ancestral populations that inhabited Kamchatka, Lower Amur River region, and far northeast Siberia. Jeong et al. (2016a) suggested that only the Ainu show a close affinity with the Itel’men, whereas most East Asians are genetically closer to Nganasan from central Siberia, corroborating our f3-statistics results. However, it should be noted that f3-statistics are less sensitive if both source populations are genetically related, e.g. when Ulchi and F23 are used as source populations for Ainu, and it is difficult to recognize Ulchi as a source population. The addition of other ancient genomes (e.g. epi-Jomon, Satsumon, Okhotsk, ancient Sakhalin, and southern Siberian people) and new statistical methods should provide further insights into the genetic history of Ainu.
In conclusion, in this study, we characterized a high-quality Jomon genome, which we consider the “reference Jomon genome.” The information presented herein will provide a solid foundation for future genomic studies of additional Jomon individuals excavated from various sites. The addition of new Jomon genome sequences to the current data may provide insights into shared features and/or local adaptations across the Japanese archipelago. In the current study, genome sequences of Sanganji, Ikawazu, and Funadomari Jomon were found to share a common lineage, although the data were not sufficient to identify geographical variations. Based on craniometric data, Kondo et al. (2017) demonstrated that the Jomon people exhibit a discernible level of northeast-to-southwest geographical cline across the Japanese archipelago, placing the Hokkaido and Okinawa Jomons at extreme ends. We hope that more genomic data from various Jomon sites spanning a wider time frame will allow us to elucidate more details of their population history.
Acknowledgments
We thank Dr. Toyohiro Nishimoto who excavated the Funadomari site. We also thank Rebun Town Board of Education for providing teeth for DNA analysis. We thank the Asian DNA Repository Consortium for the use of genome-wide SNP data for the three Japanese populations. Computational resources for data analysis were provided by NIG Super Computer at the National Institute of Genetics. We also thank Dr. Choongwon Jeong and his colleagues from the Max Planck Institute for the Science of Human History for their technical assistance and helpful discussions during data analysis. We would also like to acknowledge Dr. Kazuhiro Sakaue and Akiko Nakatsuka for reconstructing the cranial bones of Funadomari nos. 5 and 23. This work was supported by JSPS KAKENHI grant numbers JP25251043 to K.S. and 16H02527 to H.M., an ROIS Interdisciplinary Research Grant to N.S., and Yaponesian ancient genome MEXT KAKENHI grant number 18H05507 to K.S.
Author contributions
Excavating human remains at Funadomari site: H.M.
Sampling: N.A., K.S., and H.M.
DNA extraction: N.A.
Library preparation: H.K.-K.
Mapping and filtering: H.K.-K., T.S., K.H., and A.T.
Metagenomic analysis: K.K.
Mitochondrial genome analysis: H.K.-K.
Sex determination and Y chromosome analysis: H.K.-K. and A.T.
DNA authenticity analysis and error rate estimation: H.K.-K. and T.S.
Haplotype-based analysis: Y.K.
Human leukocyte antigen (HLA) allele inference: Y.K. and K.H.
Genotype calling of F23: H.K.-K.
Phenotyping of anthropological traits and detection of pathogenic mutations: T.S, H.K.-K., H.M., K.H., and A.T.
Data preparation for modern and other ancient human genomes: H.K.-K. and T.J.
Principal component analysis (PCA): H.K.-K. and N.S.
Phylogenetic analysis: T.J., T.S., and N.S.
F-statistics to detect gene flow: H.K.-K.
Testing models of phylogenetic relationships: H.K.-K. and K.K.
MSMC: T.J., Y.K., and N.S.
Writing and editing the manuscript with input from all authors: H.K.-K., N.S., and K.S.
References
- Adachi N., Shinoda K., Umetsu K., and Matsumura H. (2009) Mitochondrial DNA analysis of Jomon skeletons from the Funadomari site, Hokkaido, and its implication for the origins of Native American. American Journal of Physical Anthropology, 138: 255–265.
- Adachi N., Shinoda K., Umetsu K., Kitano T., Matsumura H., et al. (2011) Mitochondrial DNA analysis of Hokkaido Jomon skeletons: remnants of archaic maternal lineages at the southwestern edge of former Beringia. American Journal of Physical Anthropology, 146: 346–360.
- Adachi N., Kakuda T., Takahashi R., Kanzawa-Kiriyama H., and Shinoda K. (2018) Ethnic derivation of the Ainu inferred from ancient mitochondrial DNA data. American Journal of Physical Anthropology, 165: 139–148.
- Altschul S.F., Madden T.L., Schäffer A.A., Zhang J., Zhang Z., et al. (1997) Gapped BLAST and PSI-BLAST: a new generation of protein database search programs. Nucleic Acids Research, 25: 3389–3402.
- Andersen M.K., Jørsboe E., Sandholt C.H., Grarup N., Jørgensen M.E., et al. (2016) Identification of novel genetic determinants of erythrocyte membrane fatty acid composition among Greenlanders. PLoS Genetics, 12: e1006119.
- Bannai M., Ohashi J., Harihara S., Takahashi Y., Juji T., et al. (2000) Analysis of HLA genes and haplotypes in Ainu (from Hokkaido, northern Japan) supports the premise that they descent from Upper Paleolithic populations of East Asia. Tissue Antigens, 55: 128–139.
- Brace C.L. and Nagai M. (1982) Japanese tooth size: past and present. American Journal of Physical Anthropology, 59: 399–411.
- Browning B.L. and Browning S.R. (2013) Detecting identity by descent and estimating genotype error rates in sequence data. American Journal of Human Genetics, 93: 840–851.
- Chen G.K., Marjoram P., and Wall J.D. (2009) Fast and flexible simulation of DNA sequence data. Genome Research, 19: 136–142.
- Choi Y., Sims G.E., Murphy S., Miller J.R., and Chan A.P. (2012) Predicting the functional effect of amino acid substitutions and indels. PLoS One, 7: e46688.
- Clemente F.J., Cardona A., Inchley C.E., Peter B.M., Jacobs G., et al. (2014) A selective sweep on a deleterious mutation in CPT1A in Arctic populations. American Journal of Human Genetics, 95: 584–589.
- Edenburg H.J. and Bosron W.F. (1997) Alcohol dehydrogenases. In: Guengerich F.P. (ed.), Comprehensive Toxicology, Vol. 3: Biotransformation. Pergamon Elsevier Science, New York, pp. 119–131.
- Friedlaender J. (2005) Why do the people of Bougainville look unique? Some conclusions from biological anthropology and genetics. In: Regan A.J. and Griffin H.M. (eds.), Bougainville Before the Conflict. Pandanus Press, Canberra, pp. 57–70.
- Friedlaender J.S., Friedlaender F.R., Reed F.A., Kidd K.K., Kidd J.R., et al. (2008) The genetic structure of Pacific Islanders. PLoS Genetics, 4: e19.
- Frith M.C. (2011) A new repeat-masking method enables specific detection of homologous sequences. Nucleic Acids Research, 39: e23.
- Fu Q., Posth C., Hajdinjak M., Petr M., Mallick S., et al. (2016) The genetic history of Ice Age Europe. Nature, 534: 200–205.
- Fujimoto A., Kimura R., Ohashi J., Omi K., Yuliwulandari R., et al. (2008) A scan for genetic determinants of human hair morphology: EDAR is associated with Asian hair thickness. Human Molecular Genetics, 17: 835–843.
- Fujio S. (2015) History of Yayoi Period. Kodansha, Tokyo (in Japanese).
- Giollo M., Minervini G., Scalzotto M., Leonardi E., Ferrari C., et al. (2015) BOOGIE: Predicting blood groups from high throughput sequencing data. PLoS One, 10: e0124579.
- Green R.E., Krause J., Briggs A.W., Maricic T., Stenzel U., et al. (2010) A draft sequence of the Neandertal genome. Science, 328: 710–722.
- Greenberg C.R., Dilling L.A., Thompson G.R., Seargeant L.E., Haworth J.C., et al. (2009) The paradox of the carnitine palmitoyltransferase type Ia P479L variant in Canadian Aboriginal populations. Molecular Genetics and Metabolism, 96: 201–207.
- Habu J. (2004) Ancient Jomon of Japan. Cambridge University Press, Cambridge.
- Hammer M.F. and Horai S. (1995) Y Chromosomal DNA variation and the peopling of Japan. American Journal of Human Genetics, 56: 951–962.
- Hammer M.F., Karafet T.M., Park H., Omoto K., Harihara S., et al. (2006) Dual origins of the Japanese: common ground for hunter-gatherer and farmer Y chromosomes. Journal of human genetics, 51: 47–58.
- Hanihara K. (1991) Dual structure model for the population history of the Japanese. Japan Review, 2: 1–33.
- Hanihara T. and Ishida H. (2009) Regional differences in craniofacial diversity and the population history of Jomon Japan. American Journal of Physical Anthropology, 139: 311–322.
- Harada S., Agarwal D.P., and Goedde H.W. (1981) Aldehyde dehydrogenase deficiency as cause of facial flushing reaction to alcohol in Japanese. Lancet, 2: 982.
- He M., Xu M., Zhang B., Liang J., Chen P., et al. (2015) Meta-analysis of genome-wide association studies of adult height in East Asians identifies 17 novel loci. Human Molecular Genetics, 24: 1791–1800.
- He Y., Wang W.R., Xu S., and Jin L.Pan-Asia SNP Consortium (2012) Paleolithic contingent in modern Japanese: estimation and inference using genome-wide data. Scientific Reports, 2: 355.
- Higasa K., Miyake N., Yoshimura J., Okamura K., Niihori T., et al. (2016) Human genetic variation database, a reference database of genetic variations in the Japanese population. Journal of Human Genetics, 61: 547–553.
- Horai S., Hayasaka K., Murayama K., Wate N., Koike H., et al. (1989) DNA amplification from ancient human skeletal remains and their sequence analysis. Proceedings of Japan Academy, Series B, 65: 229–233.
- HUGO Pan-Asian SNP Consortium Abdulla M.A., Ahmed I., Assawamakin A., Bhak J., et al. (2009) Mapping human genetic diversity in Asia. Science, 326: 1541–1545.
- Huson D.H. and Bryant D. (2006) Application of phylogenetic networks in evolutionary studies. Molecular Biology and Evolution, 23: 254–267.
- International HapMap Consortium (2005) A haplotype map of the human genome. Nature, 437: 1299–1320.
- Iwasaki M., Kobayashi K., Suzuki H., Suzuki Y., and Anan K. (2000) Genetic analyses for the ABO blood group subtypes in Japanese. Japanese Journal of Transfusion Medicine, 46: 532–539 (in Japanese with English summary).
- Japanese Archipelago Human Population Genetics Consortium (2012) The history of human populations in the Japanese Archipelago inferred from genome-wide SNP data with a special reference to the Ainu and the Ryukyuan populations. Journal of Human Genetics, 57: 787–795.
- Jeong C., Nakagome S., and Di Rienzo A. (2016a) Deep history of East Asian populations revealed through genetic analysis of the Ainu. Genetics, 202: 261–272.
- Jeong C., Ozga A.T., Witonsky D.B., Malmström H., Edlund H., et al. (2016b) Long-term genetic stability and a high-altitude East Asian origin for the peoples of the high valleys of the Himalayan arc. Proceedings of the National Academy of Sciences of the United States of America, 113: 7485–7490.
- Jinam T.A., Kanzawa-Kiriyama H., Inoue I., Tokunaga K., Omoto K., et al. (2015) Unique characteristics of the Ainu population in Northern Japan. Journal of Human Genetics, 60: 565–571.
- Jónsson H., Ginolhac A., Schubert M., Johnson P.L., and Orlando L. (2013) mapDamage2.0: fast approximate Bayesian estimates of ancient DNA damage parameters. Bioinformatics, 29: 1682–1684.
- Kanzawa-Kiriyama H., Kryukov K., Jinam T.A., Hosomichi K., Saso A., et al. (2017) A partial nuclear genome of the Jomons who lived 3000 years ago in Fukushima, Japan. Journal of Human Genetics, 62: 213–221.
- Keller A., Graefen A., Ball M., Matzas M., Boisguerin V., et al. (2012) New insights into the Tyrolean Iceman’s origin and phenotype as inferred by whole-genome sequencing. Nature Communications, 3: 698.
- Kimura R., Yamaguchi T., Takeda M., Kondo O., Toma T., et al. (2009) A common variation in EDAR is a genetic determinant of shovel-shaped incisors. American Journal of Human Genetics, 85: 528–535.
- Kimura R., Watanabe C., Kawaguchi A., Kim Y.I., Park S.B., et al. (2015) Common polymorphisms in WNT10A affect tooth morphology as well as hair shape. Human molecular genetics, 24: 2673–2680.
- Kircher M., Witten D.M., Jain P., O’Roak B.J., Cooper G.M., et al. (2014) A general framework for estimating the relative pathogenicity of human genetic variants. Nature Genetics, 46: 310–315.
- Koganebuchi K., Haneji K., Toma T., Joh K., Soejima H., et al. (2017) The allele frequency of ALDH2*Glu504Lys and ADH1B*Arg47His for the Ryukyu islanders and their history of expansion among East Asians. American Journal of Human Biology, 29: e22933.
- Kondo O., Fukase H., and Fukumoto T. (2017) Regional variations in the Jomon population revisited on craniofacial morphology. Anthropological Science, 125: 85–100.
- Korneliussen T.S., Albrechtsen A., and Nielsen R. (2014) ANGSD: analysis of next generation sequencing data. BMC Bioinformatics, 15: 356.
- Koyama S. (1978) Jomon subsistence and population. Senri Ethnological Studies, 2: 1–66.
- Kumar S., Stecher G., and Tamura K. (2016) MEGA7: Molecular evolutionary genetics analysis version 7.0 for bigger datasets. Molecular Biology and Evolution, 33: 1870–1874.
- Landrum M.J., Lee J.M., Benson M., Brown G., Chao C., et al. (2016) ClinVar: public archive of interpretations of clinically relevant variants. Nucleic Acids Research, 44: D862–D868.
- Lang K., Wagner I., Schöne B., Schöfl G., Birkner K., et al. (2016) ABO allele-level frequency estimation based on population-scale genotyping by next generation sequencing. BMC Genomics, 17: 374.
- Lawson D.J., Hellenthal G., Myers S., and Falush D. (2012) Inference of population structure using dense haplotype data. PLoS Genetics, 8: e1002453.
- Lazaridis I., Patterson N., Mittnik A., Renaud G., Mallick S., et al. (2014) Ancient human genomes suggest three ancestral populations for present-day Europeans. Nature, 513: 409–413.
- Lazaridis I., Nadel D., Rollefson G., Merrett D.C., Rohland N., et al. (2016) Genomic insights into the origin of farming in the ancient Near East. Nature, 536: 419–424.
- Lek M., Karczewski K.J., Minikel E.V., Samocha K.E., Banks E., et al. (2016) Analysis of protein-coding genetic variation in 60,706 humans. Nature, 536: 285–291.
- Lemas D.J., Wiener H.W., O’Brien D.M., Hopkins S., Stanhope K.L., et al. (2012) Genetic polymorphisms in carnitine palmitoyltransferase 1A gene are associated with variation in body composition and fasting lipid traits in Yup’ik Eskimos. Journal of Lipid Research, 53: 175–184.
- Li H. (2018) Minimap2: pairwise alignment for nucleotide sequences. Bioinformatics, 34: 3094–3100.
- Li H. and Durbin R. (2009) Fast and accurate short read alignment with Burrows-Wheeler transform. Bioinformatics, 25: 1754–1760.
- Li H., Handsaker B., Wysoker A., Fennell T., Ruan J., et al. (2009) The sequence alignment/map format and SAMtools. Bioinformatics, 25: 2078–2079.
- Loh P-R., Danecek P., Palamara P.F., Fuchsberger C., Reshef Y.A., et al. (2016) Reference-based phasing using the Haplotype Reference Consortium panel. Nature Genetics, 48: 1443–1448.
- Lu D., Lou H., Yuan K., Wang X., Wang Y., et al. (2016) Ancestral origins and genetic history of Tibetan highlanders. American Journal of Human Genetics, 99: 580–594.
- Mallick S., Li H., Lipson M., Mathieson I., Gymrek M., et al. (2016) The Simons Genome Diversity Project: 300 genomes from 142 diverse populations. Nature, 538: 201–206.
- Martin M. (2011) Cutadapt removes adapter sequences from high-throughput sequencing reads. EMBnet.journal, 17: 10–12.
- Mather C.A., Mooney S.D., Salipante S.J., Scroggins S., Wu D., et al. (2016) CADD score has limited clinical validity for the identification of pathogenic variants in noncoding regions in a hereditary cancer panel. Genetics in Medicine, 18: 1269–1275.
- Matsumura H. (1995) A microevolutional history of the Japanese people as viewed from dental morphology. National Science Museum Monographs; no. 9: National Science Museum.
- Matsumura H. (2007) Non-metric dental trait variation among local sites and regional groups of the Neolithic Jomon period, Japan. Anthropological Science, 115: 25–33.
- Matsumura H. and Anezaki T. (2000) Rebun-cho Funadomari iseki yori shutsudo shita Jomon jidai kouki no jinkotsu. In: Nishimoto T. (ed.), Rebun-cho Funadomari Iseki Hakkutsu Chousa Houkokusho. Rebun Town Board of Education, Rebun-cho, pp. 315–358 (in Japanese).
- Matsumura H. and Oxenham M.F. (2014) Demographic transitions and migration in prehistoric East/Southeast Asia through the lens of nonmetric dental traits. American Journal of Physical Anthropology, 155: 45–65.
- Matsumura H., Anezaki T., and Ishida H. (2001) A morphometric analysis of Jomon skeletons from the Funadomari site on Rebun island, Hokkaido, Japan. Anthropological Science, 109: 1–21.
- Matsumura H., Hung H.C., Higham C., Zhang C., Yamagata M., et al. (2019) Craniometrics reveal “two layers” of prehistoric human dispersal in eastern Eurasia. Scientific Reports, 9: 1451.
- McColl H., Racimo F., Vinner L., Demeter F., Gakuhari T., et al. (2018) The prehistoric peopling of Southeast Asia. Science, 361: 88–92.
- Meyer M., Kircher M., Gansauge M., Li H., Racimo F., et al. (2012) A high-coverage genome sequence from an archaic Denisovan individual. Science, 338: 222–226.
- Meyer M., Fu Q., Aximu-Petri A., Glock I., Nickel B., et al. (2014) A mitochondrial genome sequence of a hominin from Sima de los Huesos. Nature, 505: 403–406.
- Moreno-Mayar J.V., Potter B.A., Vinner L., Steinrücken M., Rasmussen S., et al. (2018) Terminal Pleistocene Alaskan genome reveals first founding population of Native Americans. Nature, 553: 203–207.
- Motokawa T., Kato T., Hashimoto Y., and Katagiri T. (2007) Effect of Val92Met and Arg163Gln variants of the MC1R gene on freckles and solar lentigines in Japanese. Pigment Cell Research, 20: 140–143.
- Motokawa T., Kato T., Hashimoto Y., Takimoto H., Yamamoto H., et al. (2008) Polymorphism patterns in the promoter region of the MC1R gene are associated with development of freckles and solar lentigines. Journal of Investigative Dermatology, 128: 1588–1591.
- Naitoh S., Kasahara-Nonaka I., Minaguchi K., and Nambiar P. (2013) Assignment of Y-chromosomal SNPs found in Japanese population to Y-chromosomal haplogroup tree. Journal of Human Genetics, 58: 195–201.
- Nakajima F., Nakamura J., and Yokota T. (2001) Analysis of HLA haplotype in Japanese, using high resolution allele typing. Major Histocompatibility Complex, 8: 1–32 (in Japanese with English summary).
- Nakamura T. (2008) PCR-SSCP analysis of ABO blood genotypes polymorphism and its application. University of Tsukuba technical report, 28: 39–44 (in Japanese with English summary).
- Nakaoka H., Mitsunaga S., Hosomichi K., Shyh-Yuh L., Sawamoto T., et al. (2013) Detection of ancestry informative HLA alleles confirms the admixed origins of Japanese population. PLoS One, 8: e60793.
- Nariai N., Kojima K., Saito S., Mimori T., Sato Y., et al. (2015) HLA-VBSeq: accurate HLA typing at full resolution from whole-genome sequencing data. BMC Genomics, 16: S7.
- NCBI Resource Coordinators (2018) Database resources of the National Center for Biotechnology Information. Nucleic Acids Research, 46: D8–D13.
- Nei M. (1972) Genetic distance between populations. American Naturalist, 106: 283–292.
- Nei M. (1995) The origins of human populations: genetic, linguistic, and archaeological data. In: Brenner S. and Hanihara K. (eds.), The Origin and Past of Modern Humans as Viewed from DNA. World Scientific, Singapore, pp. 71–91.
- Nishimoto T. (1984) The hunting and fishing activities of the Jomon and the Epi-Jomon culture: an analysis on the Faunal remains. Bulletin of the National Museum of Japanese History, 4: 1–15 (in Japanese with English summary).
- Nishimoto T. (2000) Rebun-cho Funadomari Iseki Hakkutsu Chousa Houkokusho. Rebun Town Board of Education, Rebun-cho (in Japanese).
- Olalde I., Allentoft M.E., Sánchez-Quinto F., Santpere G., Chiang C.W.K., et al. (2014) Derived immune and ancestral pigmentation alleles in a 7,000-year-old Mesolithic European. Nature, 507: 225–228.
- O’Leary N.A., Wright M.W., Brister J.R., Ciufo S., Haddad D., et al. (2016) Reference sequence (RefSeq) database at NCBI: current status, taxonomic expansion, and functional annotation. Nucleic Acids Research, 44: D733–D745.
- Omoto K. (1992) Some aspects of the genetic composition of the Japanese. In: Hanihara K. (ed.), Japanese as a Member of Asian and Pacific Populations. International Symposium 4, 1992. International Research Center for Japanese Studies, Kyoto, pp. 139–145.
- Omoto K. and Saitou N. (1997) Genetic origins of the Japanese: a partial support for the dual structure hypothesis. American Journal of Physical Anthropology, 102: 437–446.
- Ondov B.D., Bergman N.H., and Phillippy A.M. (2011) Interactive metagenomic visualization in a Web browser. BMC Bioinformatics, 12: 385.
- Patterson N., Price A.L., and Reich D. (2006) Population structure and eigenanalysis. PLoS Genetics, 2:e190.
- Patterson N., Moorjani P., Luo Y., Mallick S., Rohland N., et al. (2012) Ancient admixture in human history. Genetics, 192: 1065–1093.
- Pickrell J.K. and Pritchard J.K. (2012) Inference of population splits and mixtures from genome-wide allele frequency data. PLoS Genetics, 8: e1002967.
- Prüfer K., Racimo F., Patterson N., Jay F., Sankararaman S., et al. (2014) The complete genome sequence of a Neanderthal from the Altai Mountains. Nature, 505: 43–49.
- Purcell S., Neale B., Todd-Brown K., Thomas L., Ferreira M.A.R., et al. (2007) PLINK: a tool set for whole-genome association and population-based linkage analyses. American Journal of Human Genetics, 81: 559–575.
- Raghavan M., Skoglund P., Graf K.E., Metspalu M., Albrechtsen A., et al. (2014) Upper Palaeolithic Siberian genome reveals dual ancestry of Native Americans. Nature, 505: 87–91.
- Rajakumar C., Ban M.R., Cao H., Young T.K., Bjerregaard P., et al. (2009) Carnitine palmitoyltransferase IA polymorphism P479L is common in Greenland Inuit and is associated with elevated plasma apolipoprotein A-I. Journal of Lipid Research, 50: 1223–1228.
- Rasmussen M., Li Y., Lindgreen S., Pedersen J.S., Albrechtsen A., et al. (2010) Ancient human genome sequence of an extinct Palaeo-Eskimo. Nature, 463: 757–762.
- Rasmussen M., Anzick S.L., Waters M.R., Skoglund P., DeGiorgio M., et al. (2014) The genome of a Late Pleistocene human from a Clovis burial site in western Montana. Nature, 506: 225–229.
- Rawofi L., Edwards M., Krithika S., Le P., Cha D., et al. (2017) Genome-wide association study of pigmentary traits (skin and iris color) in individuals of East Asian ancestry. PeerJ, 5: e3951.
- Reich D., Green R.E., Kircher M., Krause J., Patterson N., et al. (2010) Genetic history of an archaic hominin group from Denisova Cave in Siberia. Nature, 468: 1053–1060.
- Reich D., Patterson N., Kircher M., Delfin F., Nandineni M.R., et al. (2011) Denisova admixture and the first modern human dispersals into Southeast Asia and Oceania. American Journal of Human Genetics, 89: 516–528.
- Renaud G., Slon V., Duggan A.T., and Kelso J. (2015) Schmutzi: estimation of contamination and endogenous mitochondrial consensus calling for ancient DNA. Genome Biology, 16: 224.
- Saitou N. and Nei M. (1987) The neighbor-joining method: a new method for reconstructing phylogenetic trees. Molecular Biology and Evolution, 4: 406–425.
- Sato T., Amano T., Ono H., Ishida H., Kodera H., et al. (2007) Origins and genetic features of the Okhotsk people, revealed by ancient mitochondrial DNA analysis. Journal of Human Genetics, 52: 618–627.
- Sato T., Amano T., Ono H., Ishida H., Kodera H., et al. (2009a) Mitochondrial DNA haplogrouping of the Okhotsk people based on analysis of ancient DNA: an intermediate of gene flow from the continental Sakhalin people to the Ainu. Anthropological Science, 117: 171–180.
- Sato T., Amano T., Ono H., Ishida H., Kodera H., et al. (2009b) Allele frequencies of the ABCC11 gene for earwax phenotypes among ancient populations of Hokkaido, Japan. Journal of Human Genetics, 54: 409–413.
- Sato T., Kazuta H., Amano T., Ono H., Ishida H., et al. (2010) Polymorphisms and allele frequencies of the ABO blood group gene among the Jomon, Epi-Jomon and Okhotsk people in Hokkaido, northern Japan, revealed by ancient DNA analysis. Journal of Human Genetics, 55: 691–696.
- Schiffels S. and Durbin R. (2014) Inferring human population size and separation history from multiple genome sequences. Nature Genetics, 46: 919–925.
- Schuenemann V.J., Peltzer A., Welte B., van Pelt P., Molak M., et al. (2017) Ancient Egyptian mummy genomes suggest an increase of Sub-Saharan African ancestry in post-Roman periods. Nature Communications, 8: 15694.
- Seguin-Orlando A., Korneliussen T.S., Sikora M., Malaspinas A.S., Manica A., et al. (2014) Genomic structure in Europeans dating back at least 36200 years. Science, 346: 1113–1118.
- Shigematsu M., Ishida H., Goto M., and Hanihara T. (2004) Morphological affinities between Jomon and Ainu: reassessment based on nonmetric cranial traits. Anthropological Science, 112: 161–172.
- Shinoda K., Kanzawa-Kiriyama H., Kakuda T., and Adachi N. (2017) Mitochondrial DNA analysis of human skeletal remains excavated from the Iwashita Cave and Shimomotoyama rock shelter sites. Anthropological Science (Japanese Series), 125: 49–63 (in Japanese with English summary).
- Sikora M., Seguin-Orlando A., Sousa V.C., Albrechtsen A., Korneliussen T., et al. (2017) Ancient genomes show social and reproductive behavior of early Upper Paleolithic foragers. Science, 358: 659–662.
- Siska V., Jones E.R., Jeon S., Bhak Y., Kim H-M., et al. (2017) Genome-wide data from two early Neolithic East Asian individuals dating to 7700 years ago. Science Advances, 3: e1601877.
- Skoglund P., Mallick S., Bortolini M.C., Chennagiri N., Hünemeier T., et al. (2015) Genetic evidence for two founding populations of the Americas. Nature, 525: 104–108.
- Skoglund P., Posth C., Sirak K., Spriggs M., Valentin F., et al. (2016) Genomic insights into the peopling of the Southwest Pacific. Nature, 538: 510–513.
- Skotte L., Koch A., Yakimov V., Zhou S., Søborg B., Andersson M., Michelsen S.W., Navne J.E., Mistry J.M., Dion P.A., Pedersen M.L., Børresen M.L., Rouleau G.A., Geller F., Melbye M., and Feenstra B. (2017) CPT1A missense mutation associated with fatty acid metabolism and reduced height in greenlanders. Circulation: Cardiovascular Genetics, 10: e001618.
- Suzuki H. (1969) Microevolutional changes in the Japanese population from the prehistoric age to the present-day. Journal of the Faculty of Science, University of Tokyo. Section V, 3: 279–309.
- Tajima A., Pan I.H., Fucharoen G., Fucharoen S., Matsuo M., et al. (2002) Three major lineages of Asian Y chromosomes: implications for the peopling of east and southeast Asia. Human Genetics, 110: 80–88.
- Tajima A., Hayami M., Tokunaga K., Juji T., Matsuo M., et al. (2004) Genetic origins of the Ainu inferred from combined DNA analyses of maternal and paternal lineages. Journal of Human Genetics, 49: 187–193.
- Takeuchi F., Katsuya T., Kimura R., Nabika T., Isomura M., et al. (2017) The fine- scale genetic structure and evolution of the Japanese population. PLoS One, 12: e0185487.
- Tanaka M., Cabrera V.M., González A.M., Larruga J.M., Takeyasu T., et al. (2004) Mitochondrial genome variation in Eastern Asia and the peopling of Japan. Genome Research, 14: 1832–1850.
- Thangaraj K., Singh L., Reddy A.G., Rao V.R., Sehgal S.C., et al. (2003) Genetic affinities of the Andaman Islanders, a vanishing human population. Current Biology, 13: 86–93.
- The 1000 Genomes Project Consortium (2012) An integrated map of genetic variation from 1092 human genomes. Nature, 491: 56–65.
- Thorvaldsdóttir H., Robinson J.T., and Mesirov J.P. (2013) Integrative Genomics Viewer (IGV): high-performance genomics data visualization and exploration. Briefings in Bioinformatics, 14: 178–192.
- Turner C.G., II (1987) Late Pleistocene and Holocene population history of East Asia based on dental variation. American Journal of Physical Anthropology, 73: 305–321.
- van Oven M. and Kayser M. (2009) Updated comprehensive phylogenetic tree of global human mitochondrial DNA variation. Human Mutation, 30: E386–E394.
- Wang K., Li M., and Hakonarson H. (2010) ANNOVAR: functional annotation of genetic variants from high-throughput sequencing data. Nucleic Acids Research, 38: e164.
- Yamaguchi B. (1992) Skeletal morphology of the Jomon people. In: Hanihara K. (ed.), Japanese as a Member of the Asian and Pacific Populations, International Symposium 4, 1992. International Research Center for Japanese Studies, Kyoto, pp. 53–63.
- Yamaguchi K., Watanabe C., Kawaguchi A., Sato T., Naka I., et al. (2012) Association of melanocortin 1 receptor gene (MC1R) polymorphisms with skin reflectance and freckles in Japanese. Journal of Human Genetics, 57: 700–708.
- Yamaguchi-Kabata Y., Nariai N., Kawai Y., Sato Y., Kojima K., Tateno M., Katsuoka F., Yasuda J., Yamamoto M., and Nagasaki M. (2015) iJGVD: an integrative Japanese genome variation database based on whole-genome sequencing. Human Genome Variation, 2: 15050.
- Yang M.A and Fu Q. (2018) Insights into modern human prehistory using ancient genomes. Trends in Genetics, 34: 184–196.
- Yang M.A., Gao X., Theunert C., Tong H., Aximu-Petri A., et al. (2017) 40000-year-old individual from Asia provides insight into early population structure in Eurasia. Current Biology, 27: 3202–3208.
- Yang Z., Zhong H., Chen J., Zhang X., Zhang H., et al. (2016) A genetic mechanism for convergent skin lightening during recent human evolution. Molecular biology and evolution, 33: 1177–1187.
- Yoshiura K., Kinoshita A., Ishida T., Ninokata A., Ishikawa T., et al. (2006) A SNP in the ABCC11 gene is the determinant of human earwax type. Nature Genetics, 38: 324–330.
- Zhou S., Xiong L., Xie P., Ambalavanan A., Bourassa C.V., et al. (2015) Increased missense mutation burden of Fatty Acid metabolism related genes in nunavik inuit population. PLoS One, 10: e0128255.