Regular Article
DNA-binding function of c-Myb R2R3 around thermal denaturation temperature
2021 年 18 巻 p. 78-84

詳細
2021 年 18 巻 p. 78-84
The minimum DNA-binding domain of the transcriptional factor c-Myb R2R3 remarkably fluctuates in the solution. In the present study, we evaluated the protein fluctuation of R2R3 C130I mutant, R2R3*, on its DNA-binding and folding thermodynamics. DNA-binding analysis using isothermal titration calorimetry revealed that the heat capacity change determined from the correlation between temperature and binding enthalpy change is highly negative above 35°C, indicating that the fluctuation increases with increasing temperature and elevates the conformational change on DNA binding. The results were in accordance with those of differential scanning calorimetry, which revealed that the heat capacity corresponding to thermal denaturation gradually increased above 35°C, followed by the broad transition peak. In contrast, the transition peak of R2R3* in the DNA-bound state was sharper and larger than that in the DNA-unbound state. The fluctuating form could transform into lesser fluctuating form upon DNA binding, resulting in a larger enthalpy change for denaturation of R2R3* in the DNA-bound state. It should also be noted that R2R3* could specifically bind to DNA around thermal denaturation temperature. This would be due to proteins with numerous fluctuations. Moreover, we discuss specific and non-specific DNA binding accompanied by the conformational change between well-ordered and disordered forms of R2R3* observed around the denaturation temperature.
To evaluate the protein fluctuation of c-Myb R2R3, we analyzed its DNA-binding thermodynamics and folding thermodynamics. DNA-binding analysis revealed that the heat capacity change became highly negative above 35°C, indicating that the fluctuation increases with increasing temperature and elevates the conformational change on DNA binding. The results were in accordance with those of folding thermodynamics of R2R3 in the absence or presence of DNA. It should also be noted that R2R3 could specifically bind to DNA around the thermal denaturation temperature. This would be due to the property of protein with large fluctuation.
Protein fluctuation in a solution is crucial for its function. Although numerous three dimensional structures of proteins have been determined at atomic resolution, it is still difficult to evaluate the structural dynamics. When a protein binds to another molecule, various types of conformational changes are observed, which are closely correlated with subsequent events such as signal transduction and transcriptional regulation. Intrinsically disordered proteins have been found in transcription factors [1,2], and their ultimate fluctuation plays a pivotal role in their binding to the specific site on DNA.
The c-myb gene product (c-Myb) is a transcriptional activator that specifically binds to DNA via c-Myb DNA-binding site (MBS) comprising the consensus sequence PyAAC(G/T)G, where Py indicates a pyrimidine [3]. The DNA-binding domain of c-Myb comprises three imperfect 51- or 52-residue repeats (designated R1, R2, and R3 from the N terminus) [4]. The last two repeats, R2 and R3, are sufficient for the specific DNA binding [5]. The DNA-free and complex structures of R2R3 were determined using both NMR and X-ray crystallography [6–8]. Each repeat consists of three helices and binds to DNA using the second and third helices in the helix-turn-helix motif. We have characterized the unique structural properties of c-Myb R2R3 C130I mutant, R2R3* [9–19], and found that it resembles a ‘‘semi-intrinsically disordered’’ protein [20]. As the DNA-binding ability and stability of R2R3* are similar to those of the wild-type R2R3 [10,21], R2R3* can be used as the standard R2R3 in solution without reducing chemicals.
Temperature-dependent analysis could be used to evaluate the structural properties in a solution. Our previous NMR studies revealed that the fluctuation of R2R3* increases with increasing temperature even around physiological temperature range, mainly due to the cavity located in the hydrophobic core of R2 [15]. Moreover, we recently demonstrated that R2R3* fluctuates in order to express its DNA-binding ability under physiological ionic conditions, which closely correlates with structural stability [20]. In this study, we analyzed the thermal stability of R2R3* under physiological ionic conditions using circular dichroism (CD) and differential scanning calorimetry (DSC), as well as the temperature-dependent DNA binding ability using isothermal titration calorimetry (ITC). Thermodynamic parameters such as enthalpy change (ΔH) and entropy change (ΔS) can be used as indicators of protein structural dynamics. We found that R2R3* could bind to DNA even around denaturation temperature as a result of DNA-binding induced refolding of R2R3*. This would be one of the advantages of proteins with large fluctuations.
R2R3* was expressed in E. coli and purified as reported previously [9,14]. The purified protein was dialyzed against phosphate buffered saline (pH 7.4) (PBS), 1.47 mM KH2PO4, 8.06 mM Na2HPO4, 137 mM NaCl, and 2.68 mM KCl. The protein concentration was determined from UV absorption at 280 nm using the molar absorption coefficient of 3.7×10⁴ M–1 cm–1.
The 22-mer oligonucleotide, CACCCTAACTGACACACATTCT, and its complement oligonucleotide were synthesized by Eurofins Genomics Inc., and the cognate DNA, MBS-I was prepared by annealing the two oligonucleotides as described previously [14]. For the DSC experiments, the 31-mer oligonucleotide, CGAGACACCCTAACTGACACACATTCTCGAG, and its complement oligonucleotide were also synthesized, generating MBS-I_31. The DNA concentration was determined from UV absorption at 260 nm using the molar absorption coefficient of 1.3×10⁴ base-pair–1 cm–1.
Circular dichroism (CD) measurementsFar-UV CD spectra were measured at 20°C on a Jasco J-725 spectropolarimeter. The R2R3* concentration was 0.02 mg mL–1 (1.59 μM). CD spectra were obtained for R2R3* in the absence or presence of MBS-I under the following condition: optical path length of 10 mm, scan rate of 20 nm min–1, response time of 1 s, and bandwidth of 1 nm. The helical contents were calculated from 222 nm based on the equation, reported previously [22].
DSC measurementsDSC experiments were carried out on Nano-DSC II calorimeter (TA instruments). The R2R3* concentration was 2.0 mg mL–1 (159 μM). Solution of R2R3* in the absence or presence of MBS-I_31 (159 μM) was heated at a scan rate of 1.0°C min–1. Collected data were analyzed on origin software and thermal denaturation temperature (Td) and calorimetric enthalpy change (ΔHcal) were calculated on the basis of two-state model by fitting analysis [14].
ITC measurementsITC experiments were performed on iTC200 or PEAQ-ITC (Malvern Panalytical). The MBS-I solution (300 μM) was titrated into the R2R3* solution (30 μM) using 40 μL syringe. Each titration consisted of a preliminary 0.5 μL injection followed by subsequent 2.0 μL additions. Each corrected heat was divided by the mole of DNA injected and was analyzed on the basis of ‘‘One Set of Sites’’ model with the Microcal Origin 5.0 software supplied by the manufacturer. The binding stoichiometry (n), equilibrium association constant (Ka), and binding enthalpy change (ΔH) were directly from the fitting procedure. The Gibbs free energy change (ΔG) and binding entropy change (ΔS) were obtained from the equations below.
The heat capacity change (ΔCp) was calculated from the correlation between temperature and ΔH [11].
Secondary structures of R2R3* in the absence or presence of MBS-I at various temperatures were analyzed using CD (Fig. 1). The spectra at high temperature remained unchanged even after retaining the protein for 1 h (data not shown). The spectra of R2R3* with MBS-I at a molar ratio of 1:1 were similar to those at a molar ratio of 1:2, indicating that R2R3* forms a complex with MBS-I. The α-helical contents of R2R3* in the unbound state decreased with increasing temperature, whereas those in the MBS-I bound state were almost unchanged below 40°C. The α-helical contents of R2R3* in the absence or presence of MBS-I at 20°C after heating up to 60°C were recovered in approximately 80% of R2R3* at 20°C without heating, indicating the reversible ratio of R2R3* for its thermal denaturation.
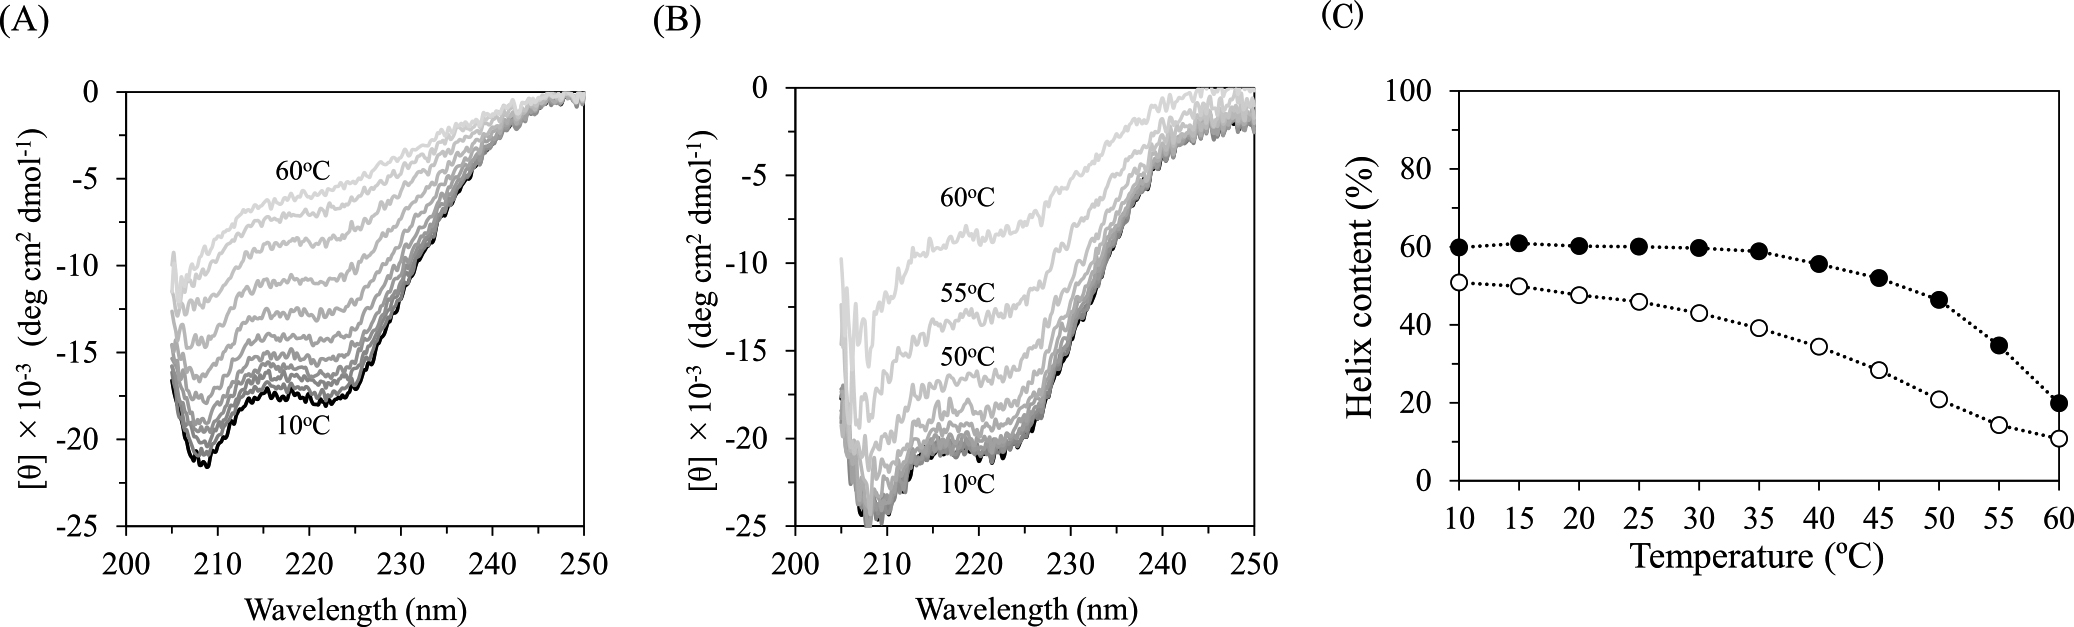
Far-UV CD spectra of R2R3* alone (A) and R2R3* with MBS-I at a molar ratio of 1:1 (B) at 10, 15, 20, 25, 30, 35, 40, 45, 50, 55, and 60°C. The spectra at 10°C are indicated in black and others are indicated in gray with lighter color as increasing temperature. (C) Temperature-dependent helix contents of R2R3* in the DNA-unbound (open circle) and -bound (closed circle) states.
The thermal stabilities of R2R3* in the absence or presence of MBS-I were analyzed using DSC (Fig. 2). The reversible ratio of R2R3* was determined to be approximately 80%, from the second scan experiments, which was similar to the CD results (data not shown). In the DSC experiments at different scan rates, the Td at a scan rate of 1.0°C min–1 was similar to that of 2.0°C min–1, and was approximately 1°C higher than that of 0.5°C min–1 (Supplementary Fig. S1 and Supplementary Table S1). In order to analyze the effects of DNA binding to thermodynamics of R2R3*, the results obtained from the experiments at a scan rate of 1.0°C min–1 were compared. As the denaturation peak of MBS-I was partially overlapped with that of R2R3* (data not shown), the longer MBS-I, MBS-I_31, whose denaturation temperature is higher than that of MBS-I, was used for R2R3* in the DNA-bound state. The denaturation temperature of MBS-I_31, at which MBS-I_31 dissociates into the two oligonucleotides, was determined to be 78.2°C. The thermodynamic parameters for R2R3* are summarized in Table 1. The Td value of R2R3* in the DNA-bound state was approximately 8°C higher than that in the DNA-unbound state. The ΔHcal value of R2R3* in the DNA-bound state was approximately five-times higher than that in the DNA-unbound state. It should also be noted that the baseline of the DSC curve of R2R3* in the absence of MBS-I_31 slightly increases with increasing temperature at a temperature lower than that at which the global unfolding occurs.

DSC curves for R2R3* alone (black line) and R2R3* with MBS-I_31 (grey line).
| Td (°C) | ΔH (kJ mol–1) | |
|---|---|---|
| R2R3* (without MBS-I_31) | 50.6 (±0.1) | 103.7 |
| R2R3* (with MBS-I_31) | 58.7 (±0.3) | 552.3 |
Fitting errors shown.
The DNA-binding abilities of R2R3* at temperatures ranging from 15°C to 55°C were analyzed using ITC. The binding of MBS-I to R2R3* at 55°C differed from those at temperatures below 50°C (Fig. 3 and Supplementary Fig. S2). Thermodynamic parameters for MBS-I binding to R2R3* are summarized in Table 2. The binding stoichiometry was close to 1 in the temperature between 15°C and 50°C, indicating the DNA binding is specific. As shown in Figure 4, the binding presents strong temperature dependence for both ΔH and TΔS, which compensates each other to make ΔG almost insensitive to temperature. The temperature dependence for ΔH is almost linear in the temperature range between 15°C and 35°C, thereby providing ΔCp to be –2.35 kJ mol–1 K–1, and is gradually separated from the linearity above 35°C, providing the ΔCp to be highly negative. Moreover, R2R3* could bind to MBS-I at 55°C, higher than the Td value of R2R3* (Table 1). The unique ITC profile would be due to non-specific DNA binding, as discussed below.

ITC profiles of MBS-I binding to R2R3* at 45°C (A) and 55°C (B). The data points were obtained by integration of the peaks in the raw data (upper) and plotted against the molar ratio, MBS-I/R2R3* (lower). The fitting line is also indicated for the binding at 45°C (A, lower).
| Temperature (°C) | n | Ka (×106 M–1) | ΔG (kJ mol–1) | ΔH (kJ mol–1) | TΔS (kJ mol–1) |
|---|---|---|---|---|---|
| 15 | 1.07 (±0.01) | 1.52 (±0.23) | –34.1 (±0.4) | –35.8 (±0.6) | –1.7 (±0.7) |
| 20 | 1.04 (±0.01) | 1.64 (±0.22) | –34.8 (±0.4) | –48.5 (±0.6) | –13.7 (±0.7) |
| 25 | 1.10 (±0.02) | 1.23 (±0.25) | –34.7 (±0.5) | –55.7 (±1.3) | –21.0 (±1.4) |
| 30 | 0.99 (±0.01) | 1.83 (±0.27) | –36.3 (±0.4) | –70.3 (±1.0) | –34.0 (±1.1) |
| 35 | 1.07 (±0.01) | 1.90 (±0.35) | –37.0 (±0.5) | –83.6 (±1.5) | –46.6 (±1.6) |
| 40 | 1.08 (±0.02) | 1.65 (±0.36) | –37.2 (±0.6) | –110.7 (±2.4) | –73.5 (±2.5) |
| 45 | 1.09 (±0.01) | 3.14 (±0.47) | –39.5 (±0.4) | –155.1 (±1.8) | –115.6 (±1.8) |
| 50 | 0.94 (±0.01) | 2.33 (±0.36) | –39.4 (±0.4) | –260.5 (±5.1) | –221.1 (±5.1) |
Fitting errors shown.

Diagram representing the thermodynamics of the interaction between R2R3* and MBS-I. Values of ΔH (circle), TΔS (square), and ΔG (triangle) are plotted as a function of temperature.
Using NMR, we previously demonstrated that the fluctuation of R2R3* increases with increasing temperature even around physiological temperature range, before global thermal denaturation [15]. Extensive conformational fluctuations were observed in both main-chains and side-chains derived from methyl and tryptophan signals, indicating that ample fluctuations prevail over the entire polypeptide chain within the native ensemble of the protein. This is in accordance with the present CD analysis (Fig. 1), which further indicates that the increased fluctuation in the DNA-unbound state is remarkably higher than that in the DNA-bound state. This changeable structural feature would be a unique property of ‘‘semi-intrinsically disordered’’ proteins. We previously reported the DNA binding thermodynamics to R2R3* in the temperature range between 10°C and 30°C using ITC, showing a linear correlation between ΔH and temperature [11]. Although the ionic strength in the previous analysis is lower than that in this study [11], the ΔCp value, –2.59 kJ mol–1 K–1, is almost similar to that determined in this study, –2.35 kJ mol–1 K–1. On increasing temperature from 35°C, the apparent ΔCp becomes highly negative (Fig. 4). As reported previously [23,24], ΔCp correlates with the change of the solvent-accessible polar and non-polar surface areas of molecules upon binding. With increasing temperature, particularly above 35°C, the fluctuation of R2R3* in the DNA-unbound state would elevate whereas that in the DNA-bound state would also increase, but to a smaller extent, thereby resulting in an increase in the change of solvent-accessible areas. Interestingly, the fluctuation increases around physiological temperature. At 45°C, the apparent helix contents of R2R3* in the DNA-unbound and DNA-bound states decreased to approximately 56% and 87%, respectively, relative to those at 10°C (Fig. 1C). Despite large fluctuation like disordered, R2R3* could specifically bind to MBS-I and form a complex at a molar ratio of 1:1 (Table 2). Approximately 56% of free R2R3* would initially bind to MBS-I, followed by shifting the population of the well-folded form of R2R3* from the disordered form or inducing the well-folded form upon DNA binding [25,26]. As a result, most R2R3* could form a specific-DNA complex. Considering the Td values of R2R3* in the DNA-unbound and DNA-bound states, 50.6°C and 58.7°C, respectively (Table 1), approximately 50% of R2R3* would be unfolded at 50°C, but could bind to MBS-I in the stoichiometry of 0.94 (Table 2). Surprisingly, R2R3* could partially bind to MBS-I at 55°C. As shown in Figure 3B, the ITC profile seems to be unique; endothermic heats were observed in the initial several injections of MBS-I. The similar profiles were also observed for different concentrations of R2R3* and MBS-I (Supplementary Fig. S2). Presumably, disordered R2R3* binds to MBS-I non-specifically through electrostatic interactions at 55°C, followed by refolding R2R3* and specifically binding to MBS-I. Under the excess molar of unbound MBS-I toward R2R3, non-specific binding might dominate specific binding, and the dissociation process from the non-specific complex might provide endothermic heats. The apparent fitting to the exothermic heats mainly derived from the specific binding in Figure 3B provided the binding stoichiometry to be approximately 1, supporting the notion that unbound and unfolded state can reversibly become the bound and folded state. Unique endothermic heats were also observed for the injection of MBS-I into R2R3* under low ionic conditions above 35°C (unpublished results). This phenomenon could also be explained by the conversion from non-specific to specific DNA binding, which would be more often observed under low ionic conditions because non-specific DNA binding is mainly driven by electrostatic interactions [27].
The Td values determined in this study are comparable to the transition temperatures determined using CD under the same buffer and ionic conditions reported previously [20]. The present DSC experiments revealed that the ΔHcal value of R2R3* in the DNA-bound state is remarkably higher than that in the DNA-unbound state (Table 1), indicating that the intramolecular interactions of R2R3* are strengthened upon DNA binding, in addition to the contribution of dissociation from DNA. This would be mainly due to the change in structural dynamics of R2R3* between DNA-unbound and DNA-bound states, which is in accordance with the NMR results obtained using 15N relaxation experiments [28]. The DSC peak of R2R3* alone was broad, and the baseline, corresponding to the heat capacity, in the low temperature gradually increased (Fig. 2). This would occur due to the structural property of R2R3* with large fluctuation.
The degree of fluctuation varies for the respective proteins, and the ultimate form is intrinsically disordered proteins. c-Myb R2R3 is like a “semi-intrinsically disordered” protein [20]. The present study revealed that R2R3* could specifically bind to MBS-I even at the temperature higher than its Td, which would be one of the advantages for proteins with large fluctuations. The disordered conformer will be exchangeable into the well-folded form even at the temperature around Td. Structural softness, which often seems weak, will work better than hardness by its property.
c-Myb R2R3* could bind to DNA specifically around its denaturation temperature. At the denaturation temperature of R2R3* in the DNA-unbound state, folded fractions of R2R3* would initially bind to DNA, followed by shifting the population of the folded form of R2R3* from the disordered form or inducing the folded form upon DNA binding. The DNA-binding ability would be one of the advantages for proteins with large fluctuations. The large fluctuation of R2R3* was also indicated by the DSC and ITC experiments. The transition curve of thermal denaturation of R2R3* alone was broad, in contrast to that of R2R3* in the complex with DNA. The heat capacity change in DNA binding of R2R3* became highly negative with increasing temperature. The present ITC experiments also showed the conversation from non-specific DNA binding to specific DNA binding around the denaturation temperature.
This work was performed in part under the Collaborative Research Program of Institute for Protein Research, Osaka University, CR-20-02, and partly supported by Nanotechnology Platform Program <Molecule and Material Synthesis> (JPMXP09S20MS1002) of the Ministry of Education, Culture, Sports, Science and Technology (MEXT), Japan.
The authors declare that they have no conflicts of interest with the contents of this article.
MK prepared samples and performed the experimental work. MO designed the study and wrote the paper.