Review Article (Invited)
Physicochemical mechanisms of aggregation and fibril formation of α-synuclein and apolipoprotein A-I

2024 年 21 巻 1 号 論文ID: e210005

詳細
2024 年 21 巻 1 号 論文ID: e210005
Deposition and accumulation of amyloid fibrils is a hallmark of a group of diseases called amyloidosis and neurodegenerative disorders. Although polypeptides potentially have a fibril-forming propensity, native proteins have evolved into proper functional conformations to avoid aggregation and fibril formation. Understanding the mechanism for regulation of fibril formation of native proteins provides clues for the rational design of molecules for inhibiting fibril formation. Although fibril formation is a complex multistep reaction, experimentally obtained fibril formation curves can be fitted with the Finke-Watzky (F-W) two-step model for homogeneous nucleation followed by autocatalytic fibril growth. The resultant F-W rate constants for nucleation and fibril formation provide information on the chemical kinetics of fibril formation.
Using the F-W two-step model analysis, we investigated the physicochemical mechanisms of fibril formation of a Parkinson’s disease protein α-synuclein (αS) and a systemic amyloidosis protein apolipoprotein A-I (apoA-I). The results indicate that the C-terminal region of αS enthalpically and entropically suppresses nucleation through the intramolecular interaction with the N-terminal region and the intermolecular interaction with existing fibrils. In contrast, the nucleation of the N-terminal fragment of apoA-I is entropically driven likely due to dehydration of large hydrophobic segments in the molecule. Based on our recent findings, we discuss the similarity and difference of the fibril formation mechanisms of αS and the N-terminal fragment of apoA-I from the physicochemical viewpoints.
In this review, we demonstrated that the C-terminal region of α-synuclein suppresses nucleation through the intramolecular interaction with the N-terminal region and the intermolecular interaction with existing fibrils. In contrast, the hydrophobic segments in the N-terminal fragment of apolipoprotein A-I entropically drive the nucleation. Given the similarity of amino acid sequence in the aggregation-prone region, these findings advance our understanding of the mechanism of fibril formation of α-synuclein and apolipoprotein A-I. In addition, the physicochemical analyses introduced in this review will be applied to the investigation of fibril formation mechanism for other amyloidogenic proteins.
Amyloid fibrils are β-sheet-rich protein aggregates in which the protein or peptide stacks perpendicularly toward the fibril axis. Although the components of amyloid fibrils are different in each disease, extracellular deposition or intracellular accumulation of amyloid fibrils is a common hallmark in a group of diseases called amyloidosis (e.g., type II diabetes, systemic amyloidosis, and dialysis-related amyloidosis) and neurodegenerative disorders (e.g., Parkinson’s disease, Alzheimer’s disease, and prion disease) [1]. Because non-toxic polypeptides [2–4] or even single amino acids, phenylalanine [5] and tyrosine [6] can form amyloid fibrils, fibril formation is considered to be a common physicochemical property of polypeptides. Given native proteins have evolved to fold into their functional structures to avoid aggregation into amyloid fibrils, understanding the mechanisms for regulation of fibril formation of native proteins provides valuable insights into developing therapeutic drugs for amyloid-related diseases.
Fibril formation of proteins is experimentally traced by monitoring changes in fluorescence intensity of amyloid-specific dye, thioflavin T (ThT), or transition into β-structure using far-ultraviolet circular dichroism (CD) and Fourier transform infrared spectroscopic measurements. Typical shape of fibril formation curves is sigmoidal with lag time. The lag time reflects the time required for nucleation in which monomeric proteins spontaneously convert into aggregation-competent nuclei. The accumulated nuclei then autocatalytically grow into fibrils by taking into surrounding monomers, which is reflected by the increase in ThT fluorescence signals (Fig. 1). In addition, the resultant fibrils can accelerate fibril formation via fragmentation and surface-catalyzed secondary nucleation processes [7,8]. Although fibril formation is a complex reaction composed of multiple microscopic processes, the fibril formation curves are well reproduced by theoretical models considering only these essential processes [9–12]. For instance, the web server, AmyloFit, is a widely used tool for elucidating the fibril formation mechanism [12]. In AmyloFit, the rate constants and the reaction orders for spontaneous (primary) nucleation, fibril elongation, fragmentation, and secondary nucleation can be determined based on the different monomer- and fibril-concentration dependence of each process. However, such a large number of kinetic parameters increases the risk of overfitting. Thus, a series of fibril formation data at various monomer concentrations for global fitting is required to obtain accurate kinetic parameters.

Kinetics of fibril formation of amyloidogenic proteins. (Upper) Typical fibril formation curve obtained from experimental measurements. This curve is composed of three phases: lag phase (purple), fibril growth phase (khaki), and plateau phase (peach). (Lower) Finke-Watzky two-step model for protein aggregation. In the lag phase, monomeric proteins spontaneously convert into fibrillar states and form amyloid nuclei. In the fibril growth phase, amyloid nuclei catalyze the conversion of surrounding monomers into fibrillar states.
The Finke-Watzky (F-W) two-step model, in contrast, considers only two essential processes for fibril formation: homogeneous nucleation and fibril growth (Fig. 1). By fitting a single fibril formation data with the F-W equation (1), the pseudo rate constants for nucleation (k1) and fibril growth (k2) are determined [13].
| (1) |
where [A]0 and [B]t are monomer concentrations at the starting point and in the fibrillar states at time point t, respectively. The k1 and k2 values reflect the spontaneous and autocatalytic fibril-forming propensity of proteins, respectively. Although the effects of the secondary pathways and reaction orders are hidden in k1 and k2 values, this analysis enables the quantitative evaluation of nucleation and fibril growth processes. Combination of this method with other physicochemical analyses and experiments provides valuable information on the molecular mechanism of fibril formation. For instance, we can estimate the kinetics of fibril formation by examining the changes in the k1 and k2 values with reaction temperature, pH, or initial protein concentration. Further, we can estimate the contribution of each protein segment and residue to the fibril-forming propensity based on the prediction of amino acid sequence analysis using theoretical tools such as AmyloPred2 [14] or information of protein conformations.
This review summarizes our new findings on the fibril formation mechanisms of Parkinson’s disease protein α-synuclein (αS) and systemic amyloidosis protein apolipoprotein A-I (apoA-I) based on the F-W model analysis [15–19]. In addition, we discuss the similarities and differences of fibril formation mechanism between αS and apoA-I from the physicochemical viewpoints.
αS is an intrinsically disordered 140-residue protein which is composed of a positively charged N-terminus (residues 1–60), a hydrophobic non-amyloid β component (NAC, residues 61–95), and a negatively charged C-terminus (residues 96–140). In healthy neurons, most of αS is localized on presynaptic terminals and exists as a random-coiled monomer, transiently interacting synaptic vesicles, plasma membranes, or molecular chaperones. Seven imperfect 11-mer repeat sequences (XKTKEGVXXXX) in the N-terminal and NAC regions form amphipathic α-helix upon binding to lipid membranes. This conformational change relates to the regulation of synaptic vesicle clustering and docking by αS [20,21]. In contrast, pathological condition induces β-structural transition around the NAC region and aggregation into amyloid fibrils [22,23]. Deposition of αS fibrils is a characteristic hallmark in several neurodegenerative disorders including Parkinson’s disease (PD), multiple system atrophy, and dementia with Lewy bodies [24]. Several point mutations (e.g., A30P, E46K, H50Q, G51D, A53T, and E83Q) and duplication and triplication of the αS gene are known as risk factors for familial PD [24,25]. In PD brains, some posttranslational modifications of αS (e.g., C-terminal truncations and phosphorylation) are characteristically enhanced [26–29]. Although these PD-related mutations and posttranslational modifications alter the aggregation propensity of αS, the correlation of the aggregation propensity with pathogenesis is unclear. Thus, we investigated the effects of the PD-related N-terminal A53T mutation and the C-terminal 104–140 truncation on the kinetics of fibril formation of αS using the F-W model analysis [16].
ThT fluorescence assay revealed that both the A53T mutation and the C-terminal 104–140 truncation accelerate αS fibril formation (Fig. 2A). The rate constants for nucleation (k1) and fibril growth (k2) determined by the F-W model analysis of the ThT fluorescence curve of wild-type (WT) αS was 1.9×10⁻³ h–1 and 6.4×10⁻³ μM–1 h–1, respectively. A significant lower k1 value compared to k2[A]0 value at our experimental condition ([A]0=20 μM) suggests that nucleation is a rate-determining process for fibril formation of WT αS. The A53T mutation significantly accelerated nucleation without affecting fibril growth rate (k1=1.9×10⁻² h–1 and k2=8.5×10⁻³ μM–1 h–1). In contrast, the 104–140 truncation enhanced both nucleation and fibril growth (k1=6.4×10⁻² h–1 and k2=2.1×10⁻² μM–1 h–1). These results suggested the different mechanisms for enhancing fibril formation of αS by the N-terminal A53T mutation and the C-terminal 104–140 truncation.

(A) ThT fluorescence curves for fibril formation of αS WT (black), A53T (purple), and Δ104–140 (green) variants. The solid lines are curves fitted using the F-W equation (1). Error bars represent standard error. a.u., arbitrary unit. (B) Eyring plot of k1 (blue) and k2 (red) values for fibril formation of αS WT. The dotted lines are the linear regression lines. Error bars represent standard error. (C) Comparison of energy barriers for nucleation and fibril growth of αS WT, A53T, and Δ104–140 variants at 37°C. Enthalpic barrier (red), entropic barrier (blue), and activation free energy (black). *p<0.05; ****p<0.0001 versus each parameter of WT. Error bars represent standard error. The data are from Ohgita et al. [16].
To gain further insights into the enhanced aggregation mechanisms of these PD-related αS variants, we examined the temperature dependence of the F-W parameters for fibril formation. Activation enthalpy (ΔH*), activation entropy (ΔS*), and activation Gibbs free energy (ΔG*) for nucleation and fibril growth were determined from Eyring plots for k1 and k2 values (Fig. 2B). As shown in Fig. 2C, both nucleation and fibril growth of WT αS were enthalpically and entropically unfavorable. The previous report indicated that the intramolecular electrostatic interaction between the N- and C-terminal domains of αS prevents fibril formation by interrupting solvent exposure of the hydrophobic NAC region [30]. Thus, the enthalpic and entropic barriers for nucleation are likely to reflect the breakage of the intramolecular N- and C-terminal interaction and the decrease in entropy of water by solvent exposure of the NAC region, respectively, during nucleation.
The N-terminal A53T mutation significantly decreases the enthalpic barrier for nucleation, suggesting the disruption of the intramolecular interaction by this mutation as previously reported [31]. Significantly, the C-terminal 104–140 truncation drastically alters the balance between enthalpic and entropic barriers for both nucleation and fibril growth in fibril formation of αS: the enthalpically favorable nucleation and the entirely disappeared entropic barrier for fibril growth (Fig. 2C). The enthalpically favorable nucleation is characteristic for the surface-catalyzed secondary nucleation, in which unstable transition state for nucleation is enthalpically stabilized by the adsorption onto existing fibril surfaces [32]. The great acceleration of fibril formation at higher monomer concentrations as well as the formation of short fibril clusters (Fig. 3) support the surface-catalyzed secondary nucleation on the fibril formation of the Δ104–140 variant. The decreased entropic barrier for fibril growth might reflect the entropic favorability induced by detachment of resultant nuclei from the fibril surface [33].

Schematic representation of mechanisms of the enhanced fibril formation of the PD-related N-terminal A53T mutation and C-terminal 104–140 truncation. The A53T mutation accelerates fibril formation by decreasing the enthalpic barrier for primary nucleation. In contrast, the Δ104–140 variant forms fibrils through surface-catalyzed secondary nucleation, in which the nucleation is enthalpically favorable and the fibril growth is entropically enhanced. The electron microscopic images of fibrils of αS WT and the Δ104–140 variant from Ohgita et al. [16] are shown in the scheme.
Taken together, our results suggest that the N-terminal A53T mutation enthalpically enhances spontaneous nucleation from monomers, while the C-terminal 104–140 truncation autocatalytically accelerates fibril formation through surface-catalyzed secondary nucleation (Fig. 3). The enhancement of nucleation as primary step for fibril formation may explain the reason for the A53T mutation-induced early-onset PD [34]. The autocatalytic fibril formation of the Δ104–140 variant seems to be related to its strong aggregation propensity and prion-like propagation activity [35–37].
Amino acid sequence of αS is highly conserved in vertebrates. Between human and mouse αS, only seven amino acid residues are different: A53T in the N-terminal region, S87N in the NAC region, and L100M, N103G, A107Y, D121G, and N122S in the C-terminal region (Fig. 4A). Despite the high sequence identity, mouse αS aggregates much faster than human αS [38], suggesting crucial roles of these mismatched residues in determining aggregation propensity. The presence of T53 residue in mouse αS does not explain the accelerated fibril formation because several non-primate αS (e.g., elephant, whale, and pig) exhibit lower aggregation propensities than human αS despite of the presence of T53 residue [39]. To explore the intrinsic regulation mechanism of the fibril formation of αS, we compared the kinetics of fibril formation of human αS, mouse αS, and their counterpart variants [17].
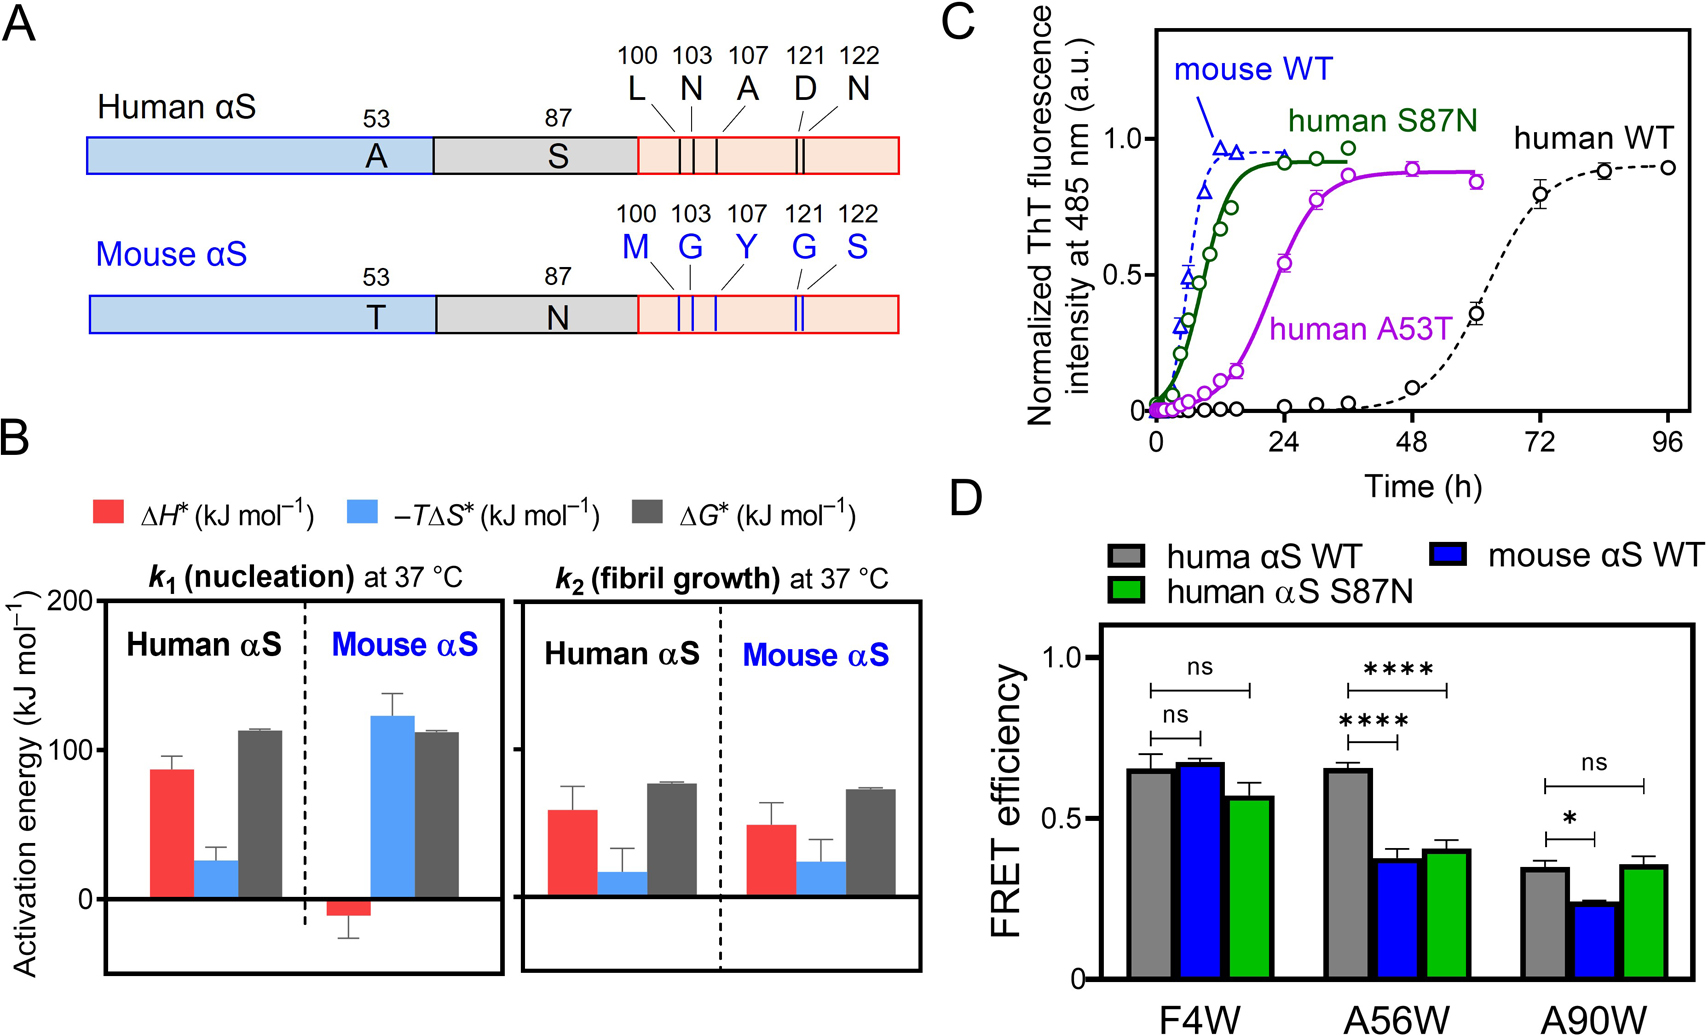
(A) Schematic representation of the difference in amino acid sequence between human αS and mouse αS. The N-terminal, NAC, and C-terminal regions are represented as blue, gray, and orange boxes. (B) Enthalpic barrier (red), entropic barrier (blue), and activation free energy (black) for nucleation and fibril growth of human αS and mouse αS. (C) ThT fluorescence curves for fibril formation of human αS WT (black), A53T (purple), S87N (green) variants, and mouse αS WT (blue). (D) FRET analysis for intramolecular interaction of the C-terminal S129 position with the N-terminal (positions 4 and 56) and NAC (position 90) regions. *p < 0.05; ****p < 0.0001 versus FRET of human αS WT. ns, not significant. The data are from Ohgita et al. [17].
The F-W model analysis demonstrated that both nucleation and fibril growth are enhanced in mouse αS (k1=1.6×10⁻² h–1 and 1.3×10⁻² μM–1 h–1) compared to human αS. Temperature dependence of the F-W kinetic parameters indicates the complete disappearance of the enthalpic barrier for nucleation in mouse αS (Fig. 4B), suggesting the perturbation of the intramolecular N- and C-terminal interaction. In agreement with this, the fibril formation of mouse αS was not accelerated by the C-terminal 104–140 truncation, in contrast to the case of human αS. The finding that the human αS S87N variant exhibits much faster fibril formation compared to the A53T variant, in which its fibril formation curve almost overlaps with that of mouse αS (Fig. 4C), indicates that the S87N substitution is relevant for the accelerated fibril formation of mouse αS.
We further examined the effects of the S87N substitution on the intramolecular interactions of the C-terminal region with the N-terminal or NAC regions by measuring fluorescence resonance energy transfer (FRET) from acrylodan labeled at position 129 in the C-terminal region to Trp residues introduced in the N-terminal (positions 4 and 56) and NAC (position 90) regions. FRET results shown in Fig. 4D clearly indicate that the C-terminal region strongly interacts with the N-terminal region in human αS, but the interaction of the C-terminal region with around Trp56 located at pre-NAC region is significantly weakened in mouse αS as well as the S87N substituted variant of human αS. This suggests that the intramolecular interaction between the pre-NAC and the C-terminal regions is perturbed by the presence of N87 residue. Taken together, our results indicate the importance of the intramolecular interaction between the pre-NAC and the C-terminal regions in monomeric αS for regulating fibril formation. In addition, the 87th residue in the NAC region is a trigger point for intramolecular interactions and fibril formation of αS, consistent with the previous findings that phosphorylation at S87 position in human αS strongly inhibits fibril formation by increasing the conformational flexibility of monomeric αS [28, 29].
In summary, our physicochemical analyses of fibril formation of the αS variants revealed that the C-terminal region plays important roles on the regulation of fibril formation via the intramolecular interaction with the pre-NAC region and the intermolecular interactions with fibril surfaces. In addition, the single point substitutions drastically change the fibril-forming propensity of αS by affecting the C-terminal interactions. Therefore, the C-terminal region appears to be a good target segment for regulating fibril formation of αS.
ApoA-I is a major component of high-density lipoprotein particles in plasma. The human apoA-I is a 243-residue protein consisting of an N-terminal helix bundle (residues 1–189) and disordered C-terminal (residues 190–243) regions. Despite the aggregation propensity of native apoA-I is low, mutations and oxidations of methionine residues induce fibril formation of apoA-I [40]. In the acquired apoA-I amyloidosis, linked to aging, high plasma triglycerides, and oxidative stress, the wild-type apoA-I fibrils deposit in the arterial wall and contribute to atherosclerosis. In contrast, in the hereditary case, deposition of amyloid fibrils formed by the N-terminal 9–11 kDa fragment of apoA-I variants is characteristically observed in specific organs such as heart, liver, kidney, and gastrointestinal tract, leading to organ failure at a young age [41,42]. Interestingly, the amyloidogenic apoA-I mutations reported to date are clustered in two hot-spot regions: residues 26–107 and 154–178 [43,44]. Currently, the only effective treatments against apoA-I amyloidosis are liver transplantation for reducing and slowing down amyloid production and transplantation of the failing organs [44,45].
In the N-terminal 1–83 fragment of apoA-I, three aggregation-prone segments of residues 14–22 (LATVYVDVL), 53–58 (VTSTFS), and 67–72 (VTQEFW) are indicated by AmylPred2 software [14], which predicts amyloidogenic segments in amino acid sequences based on the consensus scores of 11 different prediction methods for amyloid formation-associated features. We investigated the roles of these aggregation-prone segments on the fibril-forming property of an amyloidogenic G26R variant of apoA-I 1–83 fragment (apoA-I 1–83/G26R) [18].
We first introduced pyrene into the specific sites in the apoA-I 1–83/G26R fragment to measure the fluorescence spectral changes of pyrene upon formation of amyloid fibrils. When two pyrene molecules are within 10 Å of each other, a broad and red-shifted emission peak appears at around 470 nm, attributed to the formation of an excimer [46]. This excimer peak appeared in the fluorescence spectra of pyrene labeled at residues 22 and 52 in apoA-I 1–83/G26R upon fibril formation, indicating that segments around positions 22 and 52 form an amyloid core structure, consistent with the prediction by the AmylPred2.
Next, we constructed a series of deletion variants of apoA-I 1–83/G26R fragment lacking each of the aggregation-prone segments (Δ14–22, Δ50–58, and Δ68–76) to examine the roles of these segments in fibril formation kinetics. The k1 and k2 values of apoA-I 1–83/G26R determined by the F-W model analysis of the ThT fluorescence curve were 1.2×10⁻² h–1 and 2.2×10⁻² μM–1 h–1, respectively. The lower k1 value compared to k2[A]0 value at our experimental condition ([A]0=10 μM) suggests that nucleation is a rate-determining process for fibril formation of apoA-I 1–83/G26R fragment. The finding that there was no increase in ThT fluorescence and fibrillar aggregates for the Δ14–22 variant indicates that the segment of residues 14–22 is crucial for fibril formation by apoA-I 1–83/G26R. The deletion of residues 50–58 delayed the increase in ThT fluorescence with significant decreases in both k1 and k2 values (k1=7.0×10⁻⁴ h–1 and k2=4.2×10⁻³ μM–1 h–1), while the Δ68–76 variant exhibited strong ThT fluorescence emission with comparable k1 and k2 values (k1=1.1×10⁻² h–1 and k2=1.2×10⁻² μM–1 h–1) to those of apoA-I 1–83/G26R. Given that the ThT fluorescence intensity changes depending on the fibril polymorphs due to the alteration in the ThT-fibril interaction [47], the strong ThT fluorescence emission observed for the Δ68–76 variant might reflect the changes in fibril structure by deletion of residues 68–76.
We further examined the temperature dependence of the k1 and k2 values of apoA-I 1–83/G26R deletion variants. The results indicate that for apoA-I 1–83/G26R, the nucleation is enthalpically unfavorable but entropically favorable, while fibril growth is both enthalpically and entropically unfavorable. In contrast, the Δ50–58 variant exhibits high entropic barrier for nucleation, suggesting that the segment of residues 50–58 entropically enhances the nucleation process of apoA-I 1–83/G26R. Such entropically favorable nucleation is also observed for Alzheimer’s disease amyloid β peptide, in which the entropically favorable dehydration of the hydrophobic region in amyloid β peptide is considered to occur during nucleation [32]. Therefore, the entropically favorable nucleation in fibril formation of apoA-I 1–83/G26R appears to reflect the dehydration of the hydrophobic segment of residues 50–58 during nucleation (Fig. 5).

Schematic representation of fibril formation mechanism of apoA-I 1–83/G26R fragment. The hydrophobic segment of residues 50–58 (blue) entropically drives nucleation, and the proximal amyloidogenic segment of residues 14–22 (red) promotes fibril growth.
To further investigate the role of the third aggregation-prone segment (residues 67–72) located in the C-terminal region on the fibril formation of apoA-I 1–83 fragment, we examined the impact of naturally occurring amyloidogenic modifications, Δ60–71/ValThr insertion (Δ60–71/VT), Δ70–72, and F71Y on the fibril-forming property of apoA-I 1–83 [19]. In these variants, the Δ60–71/VT greatly accelerated the fibril formation of apoA-I 1–83, while almost no changes in the fibril formation kinetics were observed by the deletion of residues 70–72 (EFW) and the F71Y substitution. This suggests the weak contribution of the C-terminal aromatic residues to the regulation of the fibril formation kinetics of apoA-I 1–83 fragment, despite aromatic residues generally enhance the fibril formation [48].
The F-W model analysis indicates that the Δ60–71/VT modification enhances both nucleation and fibril growth rates. In addition, the strong ThT fluorescence emission was observed for the Δ60–71/VT variant, similarly to the Δ68–76 variant. These results suggest that the Δ60–71/VT modification affects the fibril formation kinetics and the resultant fibril structure. Indeed, although the apparent morphological change in fibrils formed by the Δ60–71/VT variant was not observed, the Δ60–71/VT fibrils exhibited higher stability against urea-induced disaggregation compared to apoA-I 1–83 fibrils. In addition, temperature dependence of the rate constants k1 and k2 demonstrated disappearance of the entropic barrier for the nucleation of the Δ60–71/VT variant (Fig. 6).

Enthalpic barrier (red), entropic barrier (blue), and activation free energy (black) for nucleation and fibril growth of apoA-I 1–83 and its Δ60–71/VT variant. The data are from Namba et al. [19].
AmylPred2 prediction indicates that the Δ60–71/VT modification creates a large aggregation-prone segment spanning residues 53–62 (Fig. 7). Thus, we evaluated the role of this newly formed aggregation-prone segment on the fibril-forming property of apoA-I using apoA-I 50–75 fragment peptide. Although apoA-I 50–75 peptide per se does not have an ability to form fibrils, the Δ60–71/VT mutation greatly promotes fibril formation by the apoA-I 50–75 peptide. This indicates that the large aggregation-prone segment in the Δ60–71/VT variant has strong amyloidogenicity. Thus, the large amyloidogenic segment created by the Δ60–71/VT mutation entropically enhances nucleation of apoA-I 1–83 fragment, similarly to the case of residues 50–58.

Aggregation propensity prediction of apoA-I 1–83 and its Δ60–71/VT variant by AmylPred2. A new large aggregation-prone segment spanning residues 53–62 appears in the Δ60–71/VT variant. The graphs are from Namba et al. [19] with minor modifications.
In summary, our physicochemical analyses of the fibril formation mechanism of apoA-I 1–83 fragment suggest that the presence of large hydrophobic segments in the N-terminal 1–83 residues facilitate fibril formation by enhancing nucleation through entropic effects.
Fig. 8A represents an amino acid sequence alignment between human αS and apoA-I 1–83/G26R fragment. The segment of residues 36–42 in αS known as a master regulator region for fibril formation [49] well corresponds to residues 14–22 in apoA-I that is crucial for fibril formation of apoA-I 1–83/G26R fragment. Interestingly, a monoclonal antibody for apoA-I amyloid fibrils which we newly generated is shown to recognize the segment of residues 36–42 in αS fibrils by docking model simulation [50]. This suggests the presence of the common structural motif in the fibrils formed by αS and apoA-I 1-83/G26R fragment. The atomic resolution structure of αS fibrils indicates that residues 36–42 form the loop-to-β-sheet boundary in the fibrillar form (Fig. 8B) [51]. In addition, the residues 88–93 of αS, which corresponds to the amyloidogenic segment of residues 53–58 of apoA-I, also form the other loop-to-β-sheet boundary, suggesting the importance of the β-sheet forming segments in the kinetic regulation of fibril formation [52,53].

(A) Amino acid sequence alignment of human αS and apoA-I 1–83/G26R fragment. The P1 (residues 36–42) and P2 (residues 45–57), both of which play crucial roles in fibril formation, and NAC region (residues 61–95) in αS are highlighted in orange, light yellow, and gray, respectively. Three amyloidogenic segments of apoA-I 1–83/G26R fragment are highlighted in pink (residues 14–22), light blue (residues 53–58), and purple (residues 67–72), respectively. (B) Atomic resolution structure of human αS fibrils (PDB:2N0A). The N-terminal, P1, P2, NAC, and C-terminal regions are colored in blue, orange, light yellow, gray, and pink, respectively. Right panels are enlarged images around residues 36–42 (orange) and residues 88–93 (green), corresponding to the two aggregation prone segments in apoA-I 1–83/G26R fragment, residues 14–22 and residues 53–58, respectively.
At the seeding experiments in fibril formation of αS and apoA-I N-terminal fragments, we found that the lag times decrease linearly with increasing initial seed concentrations (Fig. 9A and 9B). From the linear plot of lag times with initial seed concentrations, the concentration of nuclei at which the lag time disappears, Cnuc, was estimated. Interestingly, the logarithm of the Cnuc values for the variants of αS and apoA-I 1–83 fragment exhibits a linear correlation with the grand average of hydropathy (GRAVY) scores, which is the mean of hydropathy values for amino acid residues in proteins [54] (Fig. 9C). In classical nucleation theory, the logarithm of the Cnuc value is proportional to the interaction energy between monomers in the aggregate [10,55]. Therefore, the result in Fig. 9C indicates that the hydrophobicity of proteins is a major determinant factor for the interaction energy in amyloid nuclei and the amounts of nuclei formed during the lag time. However, this correlation seems be limited in intrinsically disordered proteins, because the nucleation of globular proteins is a non-classical multi-step reaction including the unfolding process [10,56]. Recent studies suggest that in many disease-associated proteins and peptides, oligomeric intermediates formed during the fibril formation, which are relevant to the intercellular transmission of fibril formation, are more toxic than the resultant fibrils [57,58]. Since αS contains large hydrophobic segments in the central NAC region, it appears that αS has developed a mechanism for kinetic suppression of nucleation and fibril formation through interactions with the C-terminal region in evolutionary process.

(A) ThT fluorescence curves for fibril formation of human αS with various concentrations of seed fibrils. (B) Plot of lag time for fibril formation of αS with initial concentration of seed fibrils. The concentration of nuclei at which the lag time disappears, Cnuc was estimated from the x-intercept of this plot. (C) Correlation of the logarithm of Cnuc with the grand average hydropathy scores of αS, apoA-I 1–83 fragment, and their variants. The data are from [16,17,19].
Our recent physicochemical analyses of fibril formation by αS and apoA-I N-terminal fragments using combination of the F-W model analysis with other physicochemical methods provide new insights into molecular mechanisms of fibril formation of amyloidogenic proteins. These informations contribute to development of strategies for regulating fibril formation and curing the amyloid-associated diseases.
The authors declare no conflict of interest.
All authors prepared the manuscript.
The evidence data generated and/or analyzed during the current study are available from the corresponding author on reasonable request.
We thank Dr. Toshinori Shimanouchi (Okayama University) for valuable advice. This work was supported by the MEXT Private University Research Branding Project, and JSPS KAKENHI (Grant Numbers: JP21K15245 (T.O.) and JP22K06556 (H.S.)).