Regular Article
Optimizing tumor treating fields for blood cancer therapy: Analysis of electric field distribution and dose density

2024 年 21 巻 2 号 論文ID: e210013

詳細
2024 年 21 巻 2 号 論文ID: e210013
Blood cancer is a condition in which white blood cells grow uncontrollably. Tumor treating fields (TTF) are a modality of cancer treatment that utilizes electric fields to target malignant cells. To optimize the efficacy of TTF, it is necessary to investigate the distribution of electric field through varying electrode configurations and input parameters. This allows for enhancement of electric field intensity in targeted areas while minimizing intensity in sensitive areas. Analysis of electric field distribution was conducted through simulation of brachial models with varying electrode configurations and input parameters, utilizing the COMSOL Multiphysics 5.4 software. Additionally, investigations were carried out to assess tissue dose density. The dose density value at primary target for all electrode configurations and input parameters do not exceed the threshold value (770 W/m3), whereas the electric field value at the primary target satisfied the threshold value (100 V/m) on the system that used 4 plate-shaped electrodes and arm contour-shaped electrodes with an input voltage of 20 V, and at the input voltage 15 V, only 4 arm contour-shaped electrodes that satisfied the threshold value. An increase in input voltage, electrodes addition, and electrodes adjustment to skin contour shape result in an enhancement of electric field distribution and average electric field value at primary targets.
Using electric field modality for cancer treatment provides less side effects compared to conventional treatments. here, we simulate the electric field distribution on a cancerous area (bone marrow) and evaluate its dose density by varying the input parameters. We find that, varying the electrode configuration (number and shape) can increase the electric field intensity and dose density. This research provides new information regarding the input parameters for blood cancer treatment with electric field.
Leukemia is a malignant and metastatic disease characterized by the abnormal development and proliferation of white blood cells in the blood or bone marrow, leading to the excessive production of immature blast cells [1,2]. White blood cells have an important role in fighting infections, however, in leukemia patients, white blood cells are still immature causing them to not function as intended. Leukemia is classified into 4 distinct categories, each with specific clinical symptoms, including Acute Myeloid Leukemia (AML), Acute Lymphatic Leukemia (ALL), Chronic Myeloid Leukemia (CML), and Chronic Lymphatic Leukemia (CLL) [3]. Data from the years 2013 to 2017 indicates that the annual incidence rate of leukemia was 14.1 per 100,000 individuals and the annual mortality rate was 6.4 per 100,000 individuals [4]. The primary cause of this disease is the presence of blast cells in leukemia patients. To mitigate the impact on red blood cells, white blood cells, and platelets, it is essential to decrease the number of blast cells. Leukemia patients are generally treated with a combination of techniques such as chemotherapy, blood transfusion, radiotherapy, and bone marrow transplant. Although these kinds of treatments can prolong the life of patients, they have side effects, are relatively expensive, and are hard to execute [5,6].
TTF (Tumor Treating Fields) is a cancer treatment modality that utilizes electric fields to destroy cancer cells. This method uses alternating electric fields of intermediate frequencies (100–500 kHz) and low electric field intensities (1–4 V/cm) which are capable of hindering the growth of cancer cells [7–9]. The use of alternating electric fields for blood cancer has not been widely used. It has only been limited to preliminary studies to observe observe the inhibition of cancer cells due to the occurrence of electric fields in blood cells. Lysis of blood cells due to electric fields is very difficult to do, because blood cells have a very strong cell membrane that acts to protect cell intrinsic from exposure to electric fields. In some study by [10] lysis occurred on leukocytes with an electric field intensity of 0.14 MV/m which exhibited damage to cell membranes and showed that a small pulse width increased the damage to cells. In the study by [11] lysis occurred on around 30% of the total number of leukocytes with a pulse intensity of 50 MV/m. Cruch et al., used AC-DC combinations (Vac=0–145 VRMS and Vdc=15–160 V) to carry out cell lysis on leukemia and erythrocyte cells, resulting in cell lysis on an electric field of 1000 V/cm [12].
Lysis of blood cells cannot be done with intermediate electric field intensity, but with intermediate field intensity cell growth inhibition can be done using TTF. TTF uses ceramic electrodes that have lower electrical conductivity than metal electrodes which will have implications for the strength of the electric field produced, therefore, to optimize the intensity of the electric field, metal electrodes made of Ag with high electrical conductivity are used. In addition, the location of the main target (bone marrow) far from the electrode, based on the inverse square law, the electric field in the target far from the electrode will decrease significantly, so it is necessary to increase the intensity of the electric field so that the field intensity in the target is as expected. Increased electric field intensity to reach distant targets has the potential to damage the surrounding normal cells, especially in sensitive biological tissues, which may result in long-term side effects [13,14].
Therefore, simulations on electrode configurations of TTF are needed to observe electric field distribution in targeted therapy so that the electric field intensity can be increased in targeted areas and minimized in areas that are not targeted or even in sensitive areas. To determine the electric field distribution of the target, an electric field distribution simulation is carried out in targeted therapy. Simulation of electric field and dose density distribution is carried out on the upper arm using finite element method (FEM) using COMSOL Multiphysics software. The electric field is generated by 2 electrodes and 4 electrodes, which are plate-shaped and arm contour-shaped. The input voltage is selected from 5–20 V and the input frequency is 100 kHz. The electric field and dose density analysis was carried out in the area of the humeral bone marrow where blood cancer cell growth and the minimum threshold for inhibiting cancer cell growth was 100 V/m [15–17] and dose density analysis on non-ionizing radiation can be represented by power loss density with the threshold value is 770 W/m3 [18].
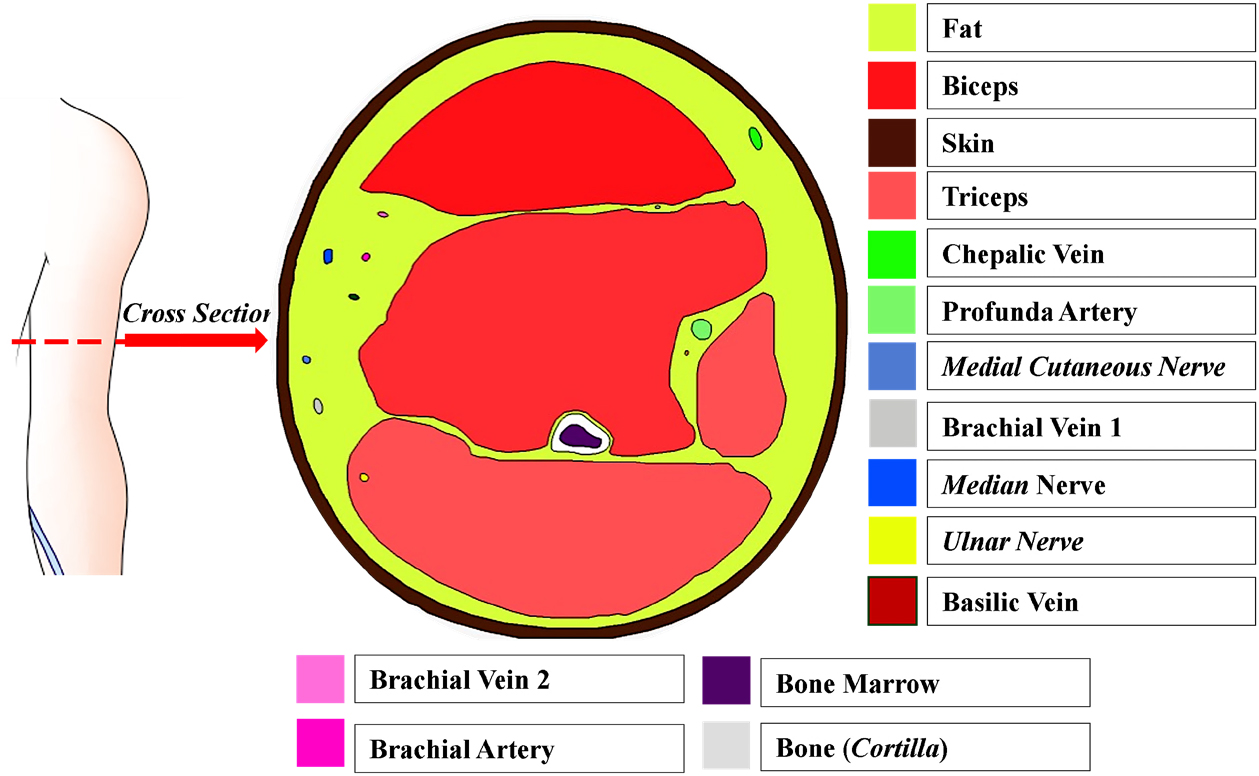
The first stage of simulation was modeling process, which included the construction of a geometric model and defining the geometric parameters. The constructed geometric model consisted of upper arm anatomy and electrodes configuration. The parameters were defined according to the results of the literature study on the size of the tissue within the upper arm. The geometric model was constructed using AutoCAD 2018. The axial plane, 10 cm above the elbow, was used as the upper arm anatomy model as shown in Figure 1 [19]. In the electrode configurations, 2 and 4 electrodes were used, which are plate-shaped and arm contour-shaped as shown in Figure 2. The selection of therapy location was based on the abnormality of bone marrows in the humeral area.

Prior to commencing the simulation, the standardization process involved comparing the electric field value between two parallel plates separated by two dielectric slabs (glass and water). The dimension of the plates was 10×10 mm2 and the distance between them was 10 cm. The permittivity values of glass and water were 4.7 and 88 [22,23]. The input voltages applied to both plates were –1 V dan +1 V.
Standardization of 2 parallel plates with calculations using the Laplace equation to determine the electric field, namely
| (1) |
With boundary condition,
| (2) |
In COMSOL, an illustration of parallel plates was shown in Figure 3a, with red indicating positive voltage, and blue negative voltage.

After standardization of the simulation, 4 stages of simulation parameter settings were carried out using COMSOL software, namely.
1. Subdomain setting, setting the type of material that will be used in the geometry. The parameters used are relative permittivity and conductivity at a working frequency of 100 kHz which are summarized in Table 1.
2. Boundary Setting, it is a geometric boundary that acts as an electrode, both plate-shaped (Figure 4a) and contour-shaped (Figure 4b). In contour-shaped, it is assumed that it is attached directly to the skin, which is due to software limitations in distinguishing two adjacent geometric lines, so the skin geometry represents the geometry of the contour-shaped electrode. Input voltage
3. Free mesh parameter, the mesh used is tetrahedral with an “extremely fine” mesh quality (Figure 3b) to support the accuracy of numerical solutions and achieve accuracy in small tissues (such as nerve and blood). The total mesh is obtained from a contour-shaped electrode system, 2 plate-shaped and 4 shaped plates each 718328; 1493931; and 1696990 for each, with an average mesh quality of 0.65.
4. Solver parameter, the simulation parameters in the form of “physics” and “study” are chosen electrostatic (es) and time-dependent, respectively. Time stepping settings are adjusted at the boundary condition stage, it is

| (3) |
| (4) |
| (5) |
Where
After the simulation, data on the electric field at every point of the geometric model was obtained. From the obtained data, a 2D plot was carried out on the axial plane and a 1D plot was done along the line that goes through the area of focus (bone marrow). Electric field data on the area of focus is used to calculate the absorbed dose. The absorbed dose was calculated from the power loss density, representing the energy per unit of time that was absorbed by the tissue, and was calculated using:
| (6) |
Where
Simulation standard was done to confirm the simulation results obtained by the COMSOL Multiphysics software. The simulation standard was determined by the electric field graph that obtained from the COMSOL simulation and error bar from calculation (red bar in graph) using the parallel capacitor plates system [22]. The electric field values were taken from the point along the Y-axis on the center of the XZ-plane. Figure 5 shows the graph of the electric field obtained from COMSOL simulation, the error value obtained from the absolute difference between simulation and calculation results are very small, it is 0.0082 (at 0>x>5 cm) and 0.0004 (at 5>x>10).

Electric field distribution was measured on the cross-section of the upper arm model. The electric field distribution data was 2 dimensionally plotted with contour colors. From the 2-dimensional plots, the voltage, number of electrodes, and type of electrode that resulted in an intensity closest to a specified value were recorded on the primary targets. These recorded parameters were then graphed against the X-axis that had been customized for the intended target.
The distribution of the electric field is carried out on the humeral model with 2 plate-shaped and arm contour-shaped electrodes with varying input voltages. The distribution results are shown in Figure 6. The a, c, e, and g sections show the results of the system that used 2 plate-shaped electrodes, and the b, d, f, and h sections show the results of the system that used 2 arm contour-shaped plates. It can be observed that on the systems that used 2 plate-shaped electrodes, the electric field distribution was only focused on areas that had direct contact with the electrodes, resulting in uneven distribution. This occurred for all input voltages, but in higher voltages, the distribution was slightly more even. However, the required electric field value to reach the primary targets was never obtained.

On the systems that used 2 arm contour-shaped electrodes, the electric field distribution was better and more even than 2 plate-shaped electrodes, but the average electric field value at the primary target did not exceed 100 V/m for all input voltages. So, this system is not recommended, because it is limited by inadequate electric field strength.
The obtained electric field distributions with the addition of 2 electrodes in both systems are shown in Figure 7. The a, c, e, and g sections show the results of the system that used 4 plate-shaped electrodes, and the b, d, f, and h sections show the results of the system that used 4 arm contour-shaped electrodes. On the system that used plate-shaped electrodes, the addition of electrodes enabled it to reach the primary target with an input voltage of 20 V. The electric field, with an average value of 128.93 V/m, surpassed the threshold value when a 20 V input voltage was applied. Nevertheless, while employing different input voltage, the average electric field did not above the threshold value (specifically, Eaverage=33.81 V/m for 5V, Eaverage=62.83 for 10 V, and Eaverage=94.64 V/m for 15 V), and uneven electric field distribution was resulted for all input voltages. On the system that used arm contour-shaped electrodes, the average electric field exceeded threshold value at the primary target when input voltages of 15 V and 20 V were applied (Eaverage=142.55 V/m for 15 V and Eaverage=191.4 V/m for 20 V). But, when a 15 V input voltage was applied, the distribution at the primary target was uneven, whereas with a 20 V input voltage, the distribution was even across the whole primary target. In some tissues, such as blood, muscle, and nerves, the average electric field did not exceed threshold value for all variations of the input voltage. The small value of the electric field is caused by the high impedance of the area around the tissue that protects the tissue [15]. In addition, the high permittivity value in blood, muscle and nerve tissue causes the electric field in these tissues to be small, because pemittivity resist electric field formation.

At the primary target, the highest average electric field value and the most evenly distributed electric field were on the system that used 4 arm contour-shaped electrodes with an input voltage of 20 V. The electric field graph with respect to the X-axis of the system is shown in Figure 8. From the graph, it can be seen that the highest electric field value occurred at the bordering areas between the bone marrow and the bone. The obtained value was 191,4 V/m which exceeded a value of 100 V/m, the threshold value that enables inhibition of cancer cell growth [15]. Hematopoietic stem cells (HSCs) are the progenitors of all blood cell lineages, encompassing platelets (essential for blood clotting), red blood cells (responsible for oxygen transportation), and leukocytes (integral for immune defense against pathogens). HSCs, possessing the remarkable ability to undergo self-renewal, contribute to the continuous process of hematopoiesis throughout an individual’s lifetime. Following the process of birth, the phenomenon of hematopoiesis takes place within the confines of the bone marrow [23], Additionally, bone marrow is also a site where cancerous cells can develop. Cell production relies on cell division (mitosis), which also applies to blood cells. During mitosis (telophase), cells that are prepared for division will be restrained by the DEP force. As Kirson et al. (2004) pointed out, the DEP force exhibits a significant increase during cell division compared to when cells are in a mature, quiescent state[24]. This effect will disrupt the cell mitosis process, causing a disruption in the division pathway. Disruption of the mitotic pathway leads to cellular stress, as evidenced by an increase in cytoplasmic vacuoles, along with a decrease in proliferation and apoptosis [25]. Cells exhibiting abnormal mitosis have been observed to experience G0/1 cell cycle arrest and apoptosis, which is dependent on p53 [26,27]. Therefore, cells that are exposed to TTF will exhibit reduced proliferation, an inability to enter S phase, and an increased occurrence of apoptosis after 24 hours of TTF exposure [25].

Data retrieval of dose density distribution was done in the same way as the data retrieval for electric field distribution. After retrieval, the dose density distribution data was 2 dimensionally plotted with contour colors. From the 2-dimensional plots, the voltage, number of electrodes, and type of electrode that resulted in a value closest to a specified value were recorded at the primary targets. These recorded parameters were then graphed against the X-axis that had been customized for the intended target.
Dose density distribution was carried out on the humeral model with 2 plate-shaped and contour-shaped electrodes with varying input voltages. The distribution results are shown in Figure 9. The a, c, e, and g sections show the results of the system that used 2 plate-shaped electrodes, and the b, d, f, and h sections show the results of the system that used 2 arm contour-shaped electrodes. It can be observed that the system that used 2 arm contour-shaped electrodes had a better distribution compared to the system that used 2 plate-shaped electrodes. Similar to electric field distribution, dose density distribution on the system with rectangular electrodes was focused on areas near the electrodes while on the system with arm contour-shaped electrodes, the spread of the bias was more even. This is caused by the larger area with direct contact with the skin in the system that used arm contour-shaped electrodes compared to the system that used rectangular electrodes. Dose density distribution when the input voltage is varied is that the distribution was more even on the system with input voltages of 15 V and 20 V. However, these input voltages were still not sufficient to obtain the dose density threshold value of 770 W/m3 at the primary target [18]. The average dose density value on the system that used arm contour-shaped electrodes at the primary target with input voltages of 15 V and 20 V were 72,03 W/m3 and 144,60 W/m3 respectively.

The obtained dose density distributions with the addition of 2 electrodes in both systems are shown in Figure 10. The a, c, e, and g sections show the results of the system that used 4 plate-shaped electrodes, and the b, d, f, and h sections show the results of the system that used 4 arm contour-shaped electrodes. On the system with plate-shaped electrodes, the distribution was more focused on the areas near the electrodes, while on the system with arm contour-shaped electrodes, the dose density distribution was more even. Using varied input voltages, the input voltages of 15 V and 20 V the dose density distribution is obtained more evenly and was able to reach the primary targets. At the primary target, the average dose density values on the system that used plate-shaped electrodes and the system that used arm contour-shaped electrodes both applied with an input voltage of 20 V were 123.03 W/m3 and 485.98 W/m3 respectively. These values did not exceed the dose density threshold value to inhibit the growth of cancer cells. The small dose density value was caused by the small conductivity of the bone marrow.

The obtained dose density values did not exceed the dose density threshold value and the highest average value was obtained on the system that used 4 arm contour-shaped electrodes with an input voltage of 20 V. The dose density graph with respect to the X-axis of the system is shown in Figure 11. It can be observed from the graph that the dose density value obtained in the middle areas of the target did not exceed the dose density threshold value of ~770 W/m3. The dose of ionizing radiation refers to the energy imparted by ionizing radiation to tissues. This can be considered analogous to the TTF dose, which is defined as the energy imparted to tissue by electric field. Power Loss density is equal to the rate at which energy is imparted by the electric field to tissues, thus energy imparted can be calculated by multiplying the rate of energy deposition with duration of energy deposition. Additionally, the reason why the dose density at the primary target does not reach the threshold is that the calculated dose density has not been multiplied by the duration of treatment time.

Modeling and analysis of electric field distribution and dose density of TTF with varying electrode configurations and input voltages for potential therapy of cancer patients were carried out in this study. The input voltages used were 5 to 20 V, in which 20 V is the voltage limit acceptable for the human body. From the simulation results, it was observed that a higher input voltage resulted in a more evenly distributed electric field, a higher electric field value that exceed the threshold value to inhibit the growth of cancer cells, a more evenly distributed dose density, and a higher dose density value, but the dose density values were not able to exceed the threshold value. An adjustment to the shape of electrodes and a higher number of electrodes can also increase the average electric field value, dose density value, and dose density distribution at the primary target.
The author declares no conflicts of interest.
NN and RKU conceptualization project; NN and MF methodology; NN, MF, and UF writing-review manuscript; NN, MF, and RKU simulation and validation; NN and RKU data analysis; UF and RKU visualization data; MF and UF project administration; NN supervision. All authors have read and agreed to the published version of the manuscript.
The evidence data generated and analyzed during the current study are available from the corresponding author on reasonable request.
The authors gratefully acknowledge the financial support from Institut Teknologi Sepuluh Nopember, BRIN and LPDP 2024 for this work, under the Publication and IPR Writing Incentive Program (PPHKI) project scheme.