Introduction
Cyanobacteria can absorb carbon dioxide from the air and produce alkanes equivalent to diesel fuel through photosynthesis [1–3]. Therefore, bioalkane from cyanobacteria is expected to be a carbon-neutral, renewable bioenergy source [4–11]. Alkane synthesis in cyanobacteria is a two-step reaction involving two enzymes: acyl-(acyl carrier protein [ACP]) reductase (AAR) and aldehyde deformylating oxygenase (ADO) [4,10,11]. First, AAR synthesizes aldehydes from fatty acyl-ACP or fatty acyl-coenzyme A (CoA), which are intermediates in fatty acid synthesis, and then ADO converts them to alkanes (or alkenes). Interestingly, co-expression of AAR and ADO in Escherichia coli, yeast and other organisms enables the production of alkanes, indicating that AAR and ADO are key enzymes in biodiesel production [4,10,11]. However, ADO has a low turnover rate of 1 min–1 [12], and its activity needs to be improved in order to use it in biodiesel production. To achieve this, it is necessary to understand the detailed mechanisms of the enzyme reaction cycle of ADO, including substrate entry, catalytic reaction, and product release. The catalytic reaction mechanism of ADO has been studied in detail [10,11,13–19]. In contrast, the process of substrate delivery from AAR to ADO, the dynamics of substrate and product in ADO, and the process of product release from ADO are poorly understood.
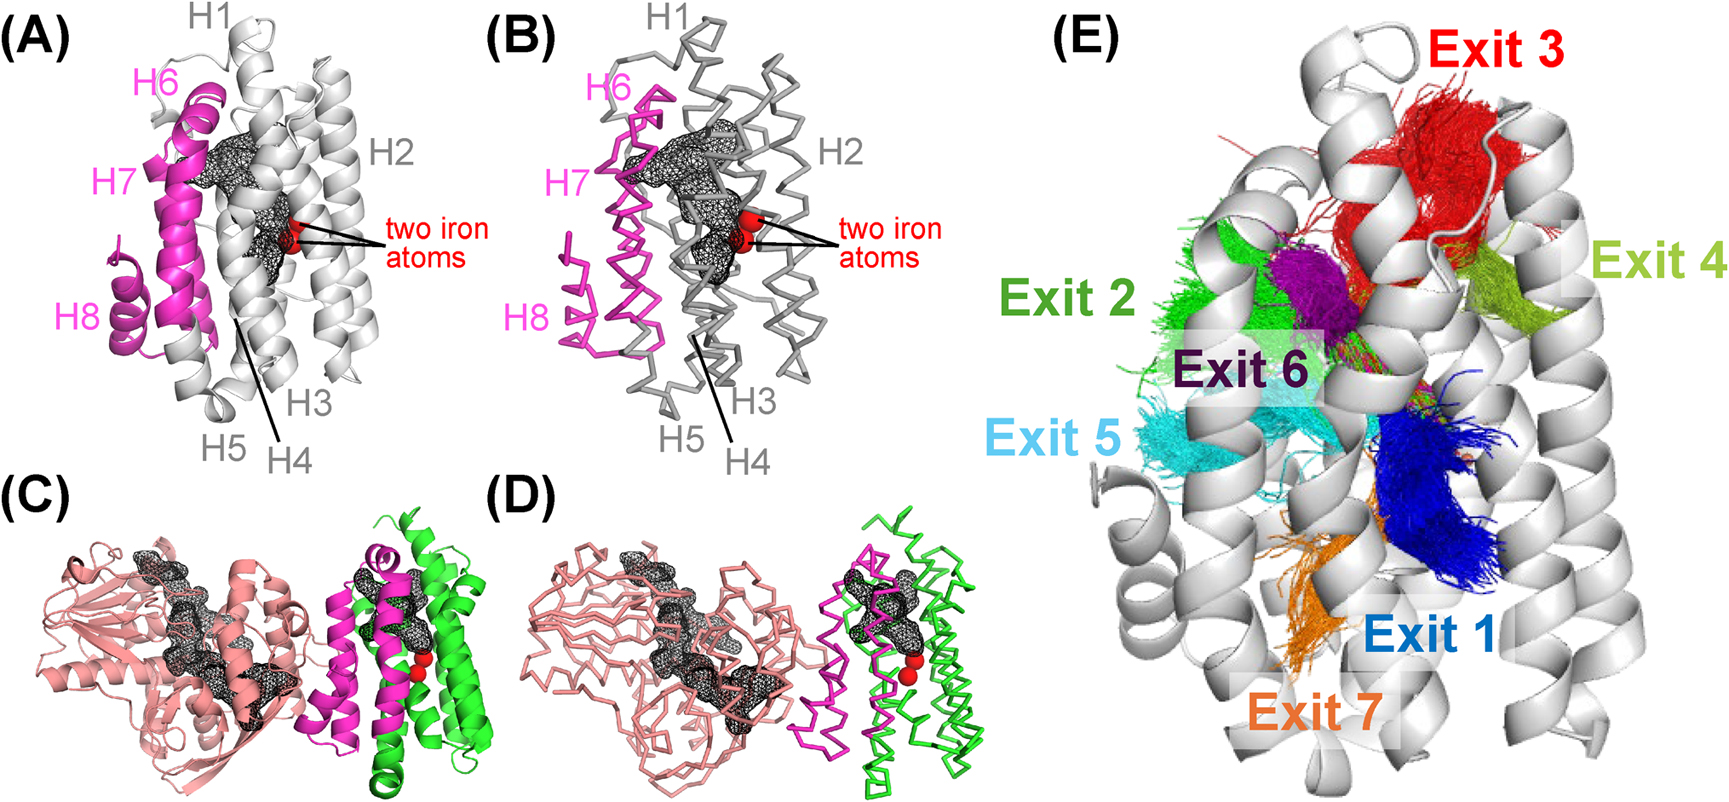
ADO is a globular protein of 230–240 residues with eight α-helices (H1–H8; Figure 1A) [4,10,11,20–25]. It physically interacts with AAR for efficient substrate delivery [25,26]. The AAR-binding site of ADO is located on the helices H6–H8 (Figure 1A–D) [25,26], and the region surrounded by the three helices is considered to be the substrate-entry site [21,25]. In addition, there is a T-shaped hydrophobic tunnel inside the ADO protein (Figure 1A, B) [21]. Based on the crystal structures of the AAR/ADO complex, the following mechanism of ADO function has been hypothesized [25]. First, the aldehyde substrate is delivered from AAR to ADO, enters the T-shaped hydrophobic tunnel of ADO, and reaches the catalytic center, where two iron atoms are coordinated. Next, ADO dissociates from AAR and synthesizes alkane. The produced alkane is then released from ADO in the reverse order of entry, from the same position as the substrate-entry site. However, this hypothesis has not been verified by experiments or theoretical calculations.
To test this hypothesis, we performed molecular dynamics (MD) simulations of ADO and the AAR/ADO complex in the presence of substrate or product. The MD simulations of ADO revealed the dynamics of substrate and product in ADO, and quantum chemical calculations based on the fragment molecular orbital (FMO) method [27] provided the detailed interactions between ADO and substrate/product. In addition, parallel cascade selection (PaCS)-MD simulations [28] of ADO and the AAR/ADO complex, which can simulate large structural changes, revealed the processes of product release from ADO and substrate entry from AAR to ADO. Strikingly, we found that substrate entrance and product exit are located at different sites of ADO, and the product can be released from ADO even when AAR is bound. These results will be useful for improving the efficiency of biofuel production using AAR and ADO.
Materials and methods
Force field preparation
Force field parameters for the aldehyde- and alkane-bound forms of ADO with two iron (Fe) atoms bound were obtained with the assistance of the metal center parameter builder (MCPB) of AmberTools22 [29,30]. Bonded parameters were obtained using the Seminario method from quantum mechanically (QM) optimized models including two Fe atoms and residues coordinating with them up to and including the Cα atoms. The QM optimization and frequency calculations were performed using the UωB97XD density functional [31] and a mixed basis set (Def2SV for Fe [32]; 6-31G(d) for H, C, N and O) [33,34] implemented in Gaussian 16, Revision C.02 [35]. Since the active center with two Fe atoms had C2 symmetry, quantum chemical calculations were performed using this symmetry. The atomic partial charges of the Fe atoms and coordinating residues were calculated using the above method and the restrained electrostatic potential (RESP) approach [29,30]. The backbone heavy atoms of the coordinating residues were kept at the standard force field values (MCPB option 3b). These parameters were developed for use with the ff14SB AMBER force field [36].
For octadecanal (C18), heptadecane (C17) and formic acid, we first optimized these structures using Gaussian with B3LYP/6-31G(d) [33,34,37,38], performed a single-point calculation at the HF/6-31G(d) level, and assigned RESP charges using Antechamber [30]. Finally, we applied the GAFF2 force field based on the obtained charges and parameters and constructed the force field for the MD simulations.
MD simulations
The initial structure of monomeric ADO was taken from the crystal structure of ADO from Prochlorococcus marinus MIT 9313 (PmADO) [PDB ID: 4tw3] [21]. This structure was used because it is one of the highest resolution structures (resolution 1.6 Å) among the monomeric ADO structures and because PmADO is often used in experiments. The structures of octadecanal (substrate), heptadecane (product), and formic acid (by-product) were created by splitting the stearic acid bound to the crystal structure of PmADO. Missing residues in N- and C terminal regions (residues 1–20 and 243, respectively) were modeled using AlphaFold2 [39].
The MD simulations of the substrate- and product-bound forms of monomeric PmADO were performed using essentially the same procedures as described previously [40,41]. Briefly, hydrogen atoms were added using the LEaP module of AmberTools22 [30]. All histidine residues were hydrogenated at the ε-position. The protein was neutralized by the addition of counterions (Na+/Cl–) and was solvated in a truncated octahedron box of TIP3P water molecules with a buffer of 20 Å. The long-range electrostatic interactions were treated by the particle-mesh Ewald method. The system was energy minimized by the steepest descent algorithm for 200 steps with harmonic position restraints on the heavy atoms of the solute (with a force constant of 10 kcal mol–1 Å–2) and for additional 200 steps without restraints. The system was then heated from 100 K to 300 K during a 1100-ps constant-NVT MD simulation with harmonic position restraints on the heavy atoms of the solute (with a force constant of 10 kcal mol–1 Å–2). During the subsequent 700-ps constant-NPT MD simulation at 300 K and 1.0×10⁵ Pa, the force constants of the position restraints were gradually reduced [40]. The system was further equilibrated for 100 ps without position restraints. The bonds between hydrogen atoms and heavy atoms were constrained using the P-LINCS algorithm, allowing the use of 2-fs time steps [42]. Temperature was controlled using the stochastic velocity-rescaling (V-rescale) algorithm [43]. Pressure in NPT simulations was controlled using the stochastic cell rescaling (C-rescale) algorithm [44] with a coupling constant of 2 ps. MD simulations were performed using GROMACS 2022.4 [45] with ff14SB for 5 μs in triplicate (15 μs in total) on a supercomputer at the Supercomputer Center, the Institute for Solid State Physics, The University of Tokyo. The root mean square deviation (RMSD) and root mean square fluctuation (RMSF) values were calculated using the CPPTRAJ module of AmberTools22 [30]. Only the Cα atoms of residues 30–230 were used for RMSD fitting to exclude the region where the fluctuation is very large (residues 1–29 and 231–243). The residue-specific RMSF values were calculated using the 5000 structures taken every 1 ns from each trajectory between 0 and 5 μs, and the mean and standard error of the RMSF values obtained from three independent runs were calculated.
The initial structure of the AAR/ADO complex was taken from the crystal structure of the complex of AAR and ADO from Synechococcus elongatus PCC 7942 (SeAAR and SeADO, respectively) [PDB ID: 6jzu] [25]. This was one of the highest resolution structures (resolution 2.18 Å) for the AAR/ADO complex. Since cetanol (C16) is bound to ADO, the coordinates of heptadecane (C17) and formic acid in the structure of the product-bound form of PmADO prepared as described above were used instead by superimposing the structure. Following the above procedures, only the equilibration process was performed.
For the visualization of protein structures, we used the open-source version of the PyMOL Molecular Graphics System, Version 3.0.0 Schrödinger, LLC.
FMO calculations
As initial structures for the FMO calculations, we used the three equilibrated structures from the three independent 5 μs MD simulations of ADO bound to octadecanal or heptadecane. Counterions (Na+/Cl–) were removed and the systems were energy minimized by the steepest descent algorithm for 50000 steps with harmonic position restraints on the heavy atoms of the solutes (with a force constant of 3 kcal mol–1 Å–2) until the maximum force became less than 3 kcal mol–1 Å–2, using GROMACS 2022.4 [45]. Water molecules beyond 6 Å of ADO were then removed. The protein was divided into fragments by amino acid units. For the active center, the Fe atoms and the side chains of the six residues coordinating with the Fe atoms were made into one fragment, and in the product-bound form, formic acid was also included in the active center fragment. The main chain portion of each residue coordinating with Fe atoms was merged with the following residue (C-terminal side) into one fragment. Octadecanal was split into three fragments, C1–C6 (head), C7–C12 (middle), and C13–C18 (tail), and heptadecane was split into three fragments, C2–C6 (head), C7–C12 (middle), and C13–C18 (tail). Based on these fragmentations, a single-point calculation was performed at the FMO-MP2/6-31G(d) level [33,34,37,38] using GAMESS [27,46]. Using the PIEDA energy decomposition, the interactions were divided into four components: electrostatic (ES) interactions, exchange repulsion (EX) interactions, charge-transfer and mixing term (CT+mix) interactions, and dispersion (DI) interactions.
Markov state model (MSM) analysis
MSM analysis was performed to analyze the dynamics of the product and substrate during MD simulations of monomeric PmADO. After performing RMSD fits for the Cα atoms of residues 30–230 of PmADO, the coordinates of the C2–C18 carbon atoms of the aldehyde or alkane were extracted every 100 ps. Time-lagged independent component analysis (TICA) [47] was used to reduce the dimensionality of the C2–C18 atoms (17 atoms×3 dimensions=51 dimensions) to 3 dimensions. The implied timescales were examined against various lag times, and 2 ns was chosen as the lag time. The 200 clusters identified in the k-means clustering analysis are called microstates. From the 200 microstates, a robust Perron cluster cluster analysis (PCCA+) [48] was used to identify 13 metastates. The representative structure of each metastate was selected using the microstate structure closest to the cluster center with the highest assignment probability within the metastate. These analyses were performed using the deeptime package [49].
PaCS-MD
We performed PaCS-MD calculations to simulate the dissociation of the heptadecane product from the active center of ADO and the AAR/ADO complex. We prepared three independent structures equilibrated as described above and set the distance between the C2 carbon atom (at the head region of the alkane) and the center of two Fe atoms in the ADO active center as the collective variable (CV). The CV was set to increase with a threshold of 5 nm. For monomeric PmADO, three independent PaCS-MD calculations were performed for each of the three initial structures (9 calculations in total). In addition, PaCS-MD calculations were also performed using the representative structure of each of the 13 metastates obtained by MSM analysis as the initial structure, with the distance between the C2 carbon atom (at the head region of the alkane) or the C18 carbon atom (at the tail region of the alkane) and the center of two Fe atoms in the ADO active center as the CV (13 structures×2 CV=26 PaCS-MD runs).
To simulate substrate delivery from AAR to ADO, we performed PaCS-MD simulations of the movement of octadecanal from AAR to the hydrophobic tunnel of ADO in the AAR/ADO complex. We set the distance between the C18 carbon atom at the tail region of the aldehyde and Ile27 of SeADO as the CV. The CV was set to decrease with a threshold of 0.5 nm.
The PaCS-MD simulations were performed using the PaCS-Toolkit [28] and GROMACS 2022.4 [45]. Each cycle of the PaCS-MD simulation was a short MD calculation of 100 ps, consisting of 48 to 50 MD calculations (replicas) performed in parallel with the same settings as described above for the long 5 μs MD simulations. From the 100 ps trajectory of each replica, 200 snapshot structures were taken every 0.5 ps, and from a total of 9600–10000 structures, the top 48–50 structures with the CV closest to the threshold were selected as the initial structures for the next cycle. These cycles were repeated until the CV reached the threshold. In almost all cases, the threshold was reached in about 100 cycles (corresponding to a total of ~10 ns of simulation for each trajectory).
Tunnel analysis
Tunnel analysis was performed using 15003 snapshots of ADO structures obtained every 1 ns from a total of 15 μs MD simulations of ADO and using the structures with the largest CV value in each cycle of PaCS-MD simulations for product release from ADO. Tunnels were determined using CAVER 3.02 [50]. The probe radius was set to 0.9 Å and default settings were used. The carbon atom of formic acid was used as the starting point for tunnel detection, which was trapped on an iron atom at the active center throughout the simulations. Tunnel clustering was performed using the average-link hierarchical clustering with approximate clustering procedure implemented in the CAVER program. First, 10000 out of 17012 tunnels were randomly sampled and clustered using average-link hierarchical clustering with a clustering threshold of 1.5. The top 15 clusters were then treated as separate classes and used to train a k-nearest neighbor classifier. Finally, the classifier is used to assign the remaining tunnels to one of the top-ranked clusters.
Results
FMO calculations of the substrate- and product-bound forms of ADO
First, we performed quantum chemical calculations using the FMO method [27] to investigate the detailed interaction between PmADO and its substrate (octadecanal; C18H36O) or product (heptadecane; C17H36). Here, the protein was divided into individual amino acids, and the aldehyde and alkane were divided into three units, namely head, middle, and tail regions, with the head region being closest to the active center (Figure 2A, B). Then, the interaction energy between each fragment (inter-fragment interaction energy, IFIE) was calculated using pair interaction energy decomposition analysis (PIEDA) (Figure 2; Supplementary Figure S1). The IFIE can be decomposed into four components: electrostatic (ES) interactions, exchange repulsion (EX) interactions, charge-transfer and mixing term (CT+mix) interactions, and dispersion (DI) interactions. We found that the head region of the aldehyde interacted strongly with the active center and Arg75 through ES interactions (Figure 2C, E). In addition, it also interacted with several ADO residues, including Phe130, through DI interactions (Figure 2E). In contrast, the head region of the alkane had little ES attraction with ADO but had weak DI interactions with the active center and Ala131 (Figure 2D, F).

Figure 2
FMO calculations of the substrate-bound (A, C, E) and product-bound (B, D, F) forms of PmADO. (A, B) Structure of the active center of ADO showing the fragmentation for FMO calculations in different colors. (C, D) Interaction energies between the active center of ADO and the head region of the aldehyde (C) or alkane (D). (E, F) Interaction energies between the ADO residues and the head (top), middle (middle), and tail (bottom) regions of the aldehyde (E) or alkane (F). Residues with a total energy less than –2 kcal/mol or greater than 2 kcal/mol are shown. In (C)–(F), the yellow, blue, orange, and green bars indicate the CT, ES, EX, and DI interactions, respectively, and the black dots indicate the total energy. The calculations for three independently equilibrated structures are shown.
Since the middle and tail regions of the aldehyde and alkane are chemically identical, they had similar interactions with ADO. The middle regions of both aldehyde and alkane had weak ES interactions with Tyr135 (Figure 2E, F). The middle region of the alkane also interacted with Phe130 (Figure 2F), which may be due to slightly different conformations for alkane and aldehyde. The tail regions of both aldehyde and alkane interacted with ADO mainly through DI interactions. In particular, the DI interactions with Tyr138 were the strongest for the tail region, with less than –5 kcal/mol, but were balanced by the EX interactions, resulting in a total energy of about –5 kcal/mol (Figure 2E, F).
Tunnel analysis
To investigate the product release process of ADO, we performed long 5 μs MD simulations and PaCS-MD simulations of the heptadecane-bound form of ADO. The detailed results are presented below. A tunnel analysis was then performed on the trajectories of these simulations using the CAVER program [50] (see Materials and Methods for details). A tunnel is a void pathway that connects a cavity buried in the protein core to the surrounding solvent. This is distinct from a channel, which is a void pathway that traverses the protein structure, with both ends open to the surrounding solvent. We found that there are 15 tunnels in ADO (Supplementary Figure S2). These tunnels were further classified into the seven candidate exits for product release according to the helices that make up the tunnels (Table 1; Figure 1E). The exits are numbered according to their frequency of appearance in the simulations (Tables 1, 2). In the following, we describe detailed analyses of the MD and PaCS-MD simulations of ADO in the presence of alkane with respect to the above seven exits. For comparison, the MD simulations of ADO in the presence of the aldehyde substrate were also performed.
Table 1 Candidate exits for product release and substrate entry in ADO
| Exit |
Representative residuea)
|
Location |
| Exit 1 |
Glu47 |
between H1 and H3, known as the water channel leading to the active center |
| Exit 2 |
Lys208 |
between H6 and H7, surrounded by Leu194, Asp195, Lys208 and the H6–H7 loop |
| Exit 3 |
Leu204 |
between H1, H4 and H6, near the N-terminal loop |
| Exit 4 |
Ile149 |
between H2 and H5 |
| Exit 5 |
Arg191 |
between H6, H7 and H8, surrounded by Arg191, Leu194 and Ile212, near the substrate entrance |
| Exit 6 |
Arg36 |
between H1 and H6 |
| Exit 7 |
Asn106 |
between H3 and H6 |
a) Representative surface residue near the exit.
First, we investigated the dynamics of ADO and its substrate/product using MD simulations. For both substrate- and product-bound forms of ADO, mimicking the structures before and after ADO catalysis, we performed three independent 5 μs simulations at 300 K (a total of 15 μs of simulations for each structure). The RMSD trajectories, which indicate the deviation from the initial structure, differed between the three calculations when all ADO residues were used for the RMSD calculations (Supplementary Figure S3A–D). The N- and C-terminal regions (residues 1–29 and 231–243, respectively) of ADO are disordered and fluctuate greatly during the simulations, resulting in the large RMSD. When the RMSD was calculated using only residues 30–230, excluding the disordered regions, the RMSD trajectories were almost identical among the three independent simulations (Figure 3A, B), and their average values agreed with each other within the range of the standard deviation (Supplementary Figure S3E, F). These results indicate that the MD calculations in this study are reproducible.

Figure 3
MD simulations of substrate- and product-bound forms of ADO. (A, B) RMSD trajectories for the Cα atoms of residues 30–230 of ADO in the substrate-bound form (A) and product-bound form (B). (C, D) RMSD trajectories for the aldehyde substrate (C) and alkane product (D). (E, F) Residue-specific RMSF of ADO. In (A)–(F), the results of the triplicate simulations are shown. (G) The difference between the RMSF values of the product-bound form and the substrate-bound form. The RMSFs of triplicate simulations for the substrate- and product-bound forms of ADO were averaged before subtraction, and their standard errors were used to determine the error in ΔRMSF by propagation of error for subtraction (error bars). In (E)–(G), the positions of helices H1–H7 are indicated by horizontal bars.
The residue-specific RMSF, which indicates the fluctuations of each residue, was large at the N- and C-terminal regions (residues 1–29 and 231–243) of ADO, whereas the RMSF in the core region (residues 30–230) was small, mostly less than 1 Å, for both substrate- and product-bound forms of ADO (Figure 3E, F; Supplementary Figure S3G, H). The difference between the RMSF of the product- and substrate-bound forms showed that the RMSF of the product-bound form was larger than that of the substrate-bound form at residues 35–55 and 70–80 (helices H1 and H2), whereas the substrate-bound form had larger fluctuations at residues 100–110 and 180–200 (helices H3 and H6) (Figure 3G).
Since many helices fluctuate during the simulations, it is possible that the alkane product is released from ADO between fluctuating helices. A tunnel analysis of the three MD trajectories (a total of 15 μs simulations) for the alkane-bound form of ADO showed that the radius of the narrowest path for each exit (bottleneck radius) was approximately 1.0 Å for Exits 2–7 (corresponding to tunnels 2–9, 11, and 13–15), whereas Exit 1 (corresponding to tunnels 1, 10, and 12) was larger at 1.19 Å (Table 2; Supplementary Table S1). Furthermore, the formation of Exit 1 was observed 95.7% of the time during the MD simulations.
Table 2 Candidate exits obtained by tunnel analysis of MD simulations for the alkane-bound form of ADO
| Exit |
Counta)
|
Frequency (%)b)
|
Bottleneck radius (Å) |
| Average |
Standard deviation |
Maximum |
|
| Exit 1 |
14359 |
95.7 |
1.19 |
0.15 |
1.85 |
|
| Exit 2 |
7556 |
50.4 |
1.06 |
0.13 |
2.00 |
|
| Exit 3 |
6516 |
43.4 |
0.99 |
0.09 |
1.61 |
|
| Exit 4 |
2475 |
16.5 |
0.98 |
0.07 |
1.41 |
|
| Exit 5 |
1317 |
8.8 |
0.97 |
0.08 |
1.55 |
|
| Exit 6 |
930 |
6.2 |
0.98 |
0.07 |
1.32 |
|
| Exit 7 |
237 |
1.6 |
0.96 |
0.06 |
1.31 |
|
a) Number of times the exit was observed in a total of 15003 snapshots (1 ns interval) during three 5 μs MD simulations.
b) Frequency with which the exit was observed during three 5 μs MD simulations, obtained by dividing the count by the total number of snapshots.
For the aldehyde-bound form of ADO, the RMSD trajectories of the aldehyde substrate fluctuated between 2 and 8 Å, but remained around 2 Å for most of the simulation time (Figure 3C). In contrast, for the alkane-bound form, the RMSD of the alkane product fluctuated widely between two states with RMSD values of 4 and 10 Å (Figure 3D), although the by-product formic acid remained approximately 2.6 Å away from the two iron atoms (Supplementary Figure S3I).
Rotational motions of alkane in ADO
To examine the movements of the aldehyde substrate and the alkane product inside the ADO molecule, we calculated the distances between the substrate/product and the active center and between the substrate/product and the candidate exits during MD simulations (Supplementary Figures S4, S5). In the substrate-bound form, both the head and tail regions of the substrate were trapped by the iron atoms at the active center (Supplementary Figure S4). In contrast, in the product-bound form, the head and tail regions of the product were repeatedly exchanged (Supplementary Figure S5).
To investigate the time-dependent changes in the structure of the alkane during the simulations, the coordinate data for the C2–C18 atoms of the alkane (17 atoms×3 dimensions=51 dimensions) were reduced to 3 dimensions using TICA analysis (see Materials and Methods for details) [47] (Figure 4). When each TICA component (named TICA1, TICA2, and TICA3 in order of the largest component) was plotted against simulation time, TICA1 moved slowly between two states (with values of –1 and 1.5), while TICA2 and TICA3 fluctuated frequently (Figure 4A). These TICA components are not correlated with each other (Supplementary Table S2), indicating that each TICA component captures independent movements. TICA1, TICA2, and TICA3 were then used as axes to plot the time-dependent structural changes of the alkane in three-dimensional (3D) coordinate space. When the trajectory was projected onto the TICA1-TICA2 plane, alkane moved in a figure of eight-like motion (Figure 4B). No such motion was observed for aldehyde, again showing that aldehyde remains immobile in the substrate-bound form (Supplementary Figure S6).

Figure 4
TICA analysis of product motion in ADO during MD simulations. (A) Time dependence of TICA1, TICA2, and TICA3 for alkane in three independent MD simulations. The horizontal axis shows the simulation time. (B) Coordinates of the alkane in three independent MD simulations projected into 3D TICA space. Top: TICA1 vs. TICA2. Bottom: TICA1 vs. TICA3. In each plot, the continuous line shows the trajectory of the simulation, and the red cross shows the position of the initial structure in the simulation.
To further investigate the structural changes of alkane in ADO, MSM analysis was performed on the alkane structures in 3D TICA space (see Materials and Methods for details). Briefly, alkane structures in a total of 15 μs MD trajectories were divided into 200 microstates in 3D TICA space using the k-means clustering method. The temporal connections between microstates appeared circular in TICA space (Supplementary Figure S7A). Using PCCA+ analysis [48], the microstates could be classified into two states, states A and B, in 3D TICA space, with TICA1 less or greater than ~0.5, respectively (Supplementary Figure S7B). There were two routes for the transitions between states A and B. Next, using PCCA+ analysis based on the implied timescale (Supplementary Figure S8), the 200 microstates were clustered into 13 metastable states (metastates). These metastates were well separated in 3D TICA space, indicating the validity of the clustering (Figure 5; Supplementary Figure S9). Overall, metastates were almost symmetrically arranged in 3D TICA space with a threshold of 0.5 for TICA1, except for metastate 3 (Figure 5A, D). Transitions between states A and B occurred between metastates 7 and 9 and between metastates 2 and 13, accompanied by changes in TICA3 value (Figure 5B). The initial alkane structure in the MD simulations, which was close to the active center, was located in metastate 6 within state A, and the surrounding metastates had high stationary probabilities (Figure 5A–C). In particular, metastate 5 was stable with the highest probability, and metastate 11, which was located symmetrically with metastate 5 in state B, also had a high probability (Figure 5C).

Figure 5
Alkane dynamics in 3D TICA space during MD simulations. (A, B) Thirteen metastates of alkane structures during MD simulations shown by different colors, projected onto the TICA1-TICA2 (A) and TICA1-TICA3 (B) planes. Black crosses indicate representative structures of metastates. (C) The estimated stationary probabilities for metastates based on the MSM analysis. (D) A diagram showing the transition probabilities of the major transitions between metastates. The numbers are rounded off to two decimal places. (E) Major transitions between metastates and the corresponding representative structures in the TICA1-TICA2 plane. The alkane head (C2 atom) is shown in blue, and the alkane tail (C18 atom) is shown in red. Two iron atoms are shown by spheres and the formic acid by-product is shown by sticks. Switching between the head and tail regions of the alkane occurred in the transitions between metastates 7 and 9 (pink) and between metastates 2 and 13 (green). In (A), (B), and (E), blue circles, stars, and triangles indicate the positions of the initial alkane structures in the first, second, and third MD runs, respectively.
The plots of transition probabilities between metastates show the order of transitions between metastates (Figure 5D). Overall, transitions to neighboring metastates occur in TICA space, indicating that the present MSM analysis can adequately describe the alkane dynamics. The transition probabilities between states A and B were ~1% for the transitions between metastates 2 and 13 and 2–3% for the transitions between metastates 7 and 9 (Figure 5D; Supplementary Table S3). Furthermore, the transition probabilities between metastates within state A were almost similar to those within state B.
Comparison of representative structures of metastates revealed the rotation of the alkane within the ADO pocket. In state A, the alkane head (C2 atom) and the alkane tail (C18 atom) were near and far from the active center, respectively, whereas in state B, both were reversed (Figure 5E). Such structural changes occurred by rotation of the alkane as follows. Starting from the initial structure (metastate 6), the alkane first extends linearly (metastates 4 and 5), then bends in the opposite direction to the initial structure (metastates 1 and 3), and becomes more compact (metastate 2). Next, the head and tail of the alkane are swapped by rotating 90° within the plane formed by the alkane molecule (metastate 13) to change to state B. Then, the tail of the alkane approaches the active center (metastate 12). This structure is similar to the initial structure (metastate 6) except that the head and tail regions of the alkane are reversed. Since both the head and tail of the alkane are the same, metastates 6 and 12 have essentially the same structures. After metastate 12, the alkane extends linearly (metastates 10 and 11, which are similar to metastates 4 and 5), then bends in the opposite direction to metastate 12 (metastate 8), becomes compact (metastate 9), and finally the head and tail of the alkane are swapped by rotating 90° within the plane formed by the alkane molecule (metastate 7). In this way, the alkane appears to move within the ADO pocket (Figure 5E). It is also possible for the alkane to rotate in the opposite direction. The reason why the structural changes within states A and B are symmetrical is probably because the head and tail of the alkane are chemically equivalent. A comparison of the representative alkane structures of the metastates suggests that TICA1 represents the swapping of the head and tail of the alkane, TICA2 represents the expansion of the alkane, and TICA3 represents the rotation of the alkane (e.g., the change between metastates 1 and 2) (Figure 5E; Supplementary Figure S10A).
We also investigated the structural changes in ADO during alkane rotation. We found that Phe130, one of the residues forming the hydrophobic tunnel in ADO, flips to create a space within ADO, and the middle region of the alkane moves into this space and approaches Ile190 and Met193, allowing the alkane to bend (Supplementary Figure S10B). Furthermore, the alkane was able to move within ADO even when extended, although the movement of the alkane to Exit 4 was blocked by Tyr34, Phe80, and Tyr138. This suggests that the hydrophobic tunnel of ADO is extended toward Exits 2, 5, and 6.
PaCS-MD simulations of product release from ADO
Although we were able to observe the rotation of the alkane within ADO, we could not observe the dissociation of the alkane from ADO in the 5 μs MD simulations. To monitor the dissociation process of the alkane from ADO, we performed PaCS-MD simulations. In PaCS-MD one cycle consists of 50 short (100 ps) MD calculations (replicas). Among the snapshots of replica trajectories, 50 snapshots with the longest distance between the alkane and the active center of ADO were selected as the initial structures of the next cycle. Thus, PaCS-MD does not require any bias, such as the addition of an arbitrary energy potential, and can show the dissociation process as it may actually occur.
First, we simulated the dissociation of the alkane product from ADO (Figure 6A). As initial structures, we used three equilibrated structures for the three 5 μs MD simulations of the product-bound form of ADO and performed PaCS-MD three times each (nine runs in total). These calculations correspond to the product dissociation simulations starting from the active center. In all nine simulations, the distance between the C2 atom of the alkane and the active center, which was set as CV, reached a threshold of 5 nm by ~100 cycles, and the entire alkane dissociated completely from ADO. In eight out of nine calculations, the alkane was released from Exit 2 of ADO (Supplementary Table S4). The salt bridge between Asp195 and Lys208 present at Exit 2 was broken during the simulations (Figure 6A). This leads to partial unfolding of helices H6 and H8, opening of Exit 2, and subsequent release of the alkane. In contrast, in only one out of nine calculations, the alkane was released from Exit 3 through the space surrounded by Arg29 and Tyr30 of helix H1, Val203 and Leu204 of helix H6, and the N-terminal disordered loop (Figure 6A; Supplementary Figure S11A).

Figure 6
PaCS-MD simulations of product release and substrate entry. (A) Alkane dissociation starting from the active center of ADO. (B) Alkane dissociation starting from the representative structures of 13 metastates obtained from MD simulations of ADO. (C) Alkane dissociation from the AAR/ADO complex. (D) Aldehyde delivery from AAR to ADO in the AAR/ADO complex. In (A)–(D), the left panel shows the changes in CV plotted against the number of cycles for PaCS-MD runs, labeled as (initial structure number)–(run number) for (A), (C), and (D) and (metastate number)–(H for alkane head or T for alkane tail) for (B). The blue horizontal line indicates the CV threshold. In (A)–(D), the right panel shows the structures of alkanes released from ADO in (A)–(C) and those of aldehydes delivered from AAR to ADO in (D) when the simulations reached the threshold. In (A), (C), and (D), the alkane or aldehyde is shown in blue for the head region and in red for the tail region. In (A), the distance between the active center and the alkane head is set as CV. Ile212 and Leu204 of PmADO are shown in magenta and Asp195 and Lys208 are shown in orange. In (B), the distance between the active center and the alkane head (solid line) or the alkane tail (dashed line) is set as CV. The colors of the trajectories and alkanes correspond to those of the metastates in Figure 5. The carbon atom at the alkane head is shown in black, Ile212, Met193, and Leu204 of PmADO are shown in magenta, and Asp195 and Lys208 are shown in orange. In (C), the distance between the active center and the alkane head is set as CV. Leu191, Val199, and Met180 of SeADO are shown in magenta and Asn182 and Arg195 are shown in orange. In (D), the distance between Ile27 of SeADO and the aldehyde tail is set as CV. Ile212 and Leu204 of SeADO are shown in magenta, Asn182 and Arg195 in orange, Ile27 in blue, and Trp178 in light blue.
Next, to simulate alkane dissociation starting from the structures with the alkane rotated within ADO, we performed PaCS-MD simulations using the representative structures of the 13 metastates obtained from the 5 μs MD calculations of ADO as initial structures (Figure 6B). For each initial structure, the CV was set to the distance from the active center to the C2 atom at the alkane head or the distance from the active center to the C18 atom at the alkane tail, and a total of 26 simulations (=13 metastates×2 CV) were performed. In all cases, the CV reached the 5 nm threshold by ~100 cycles, and the entire alkane completely dissociated from ADO. In 14 out of 26 simulations, the alkane was released from Exit 2 of ADO, 9 times from Exit 3, and 3 times from Exit 6 (Figure 6B; Supplementary Figure S11B; Supplementary Table S5). No other exits were used for alkane dissociation in these simulations. For Exits 2 and 3, the alkane was released from the same position as in the PaCS-MD simulations starting from the active center (Figure 6A, B). For Exit 6, the alkane was released from a large area between Leu189 and Asp200 of helix H6.
PaCS-MD simulations of product release from AAR/ADO complex
The above PaCS-MD simulations of ADO showed that the alkane is released from ADO through the exits other than the substrate entrance surrounded by the AAR/ADO binding interface (Exit 5), suggesting that the alkane product can be released from ADO even when ADO is bound to AAR. To test this possibility, we performed PaCS-MD simulations of product release from the AAR/ADO complex. Since the structure of the AAR/ADO complex containing PmADO was not found in the PDB, we modeled the product-bound form of the AAR/ADO complex based on the crystal structure of the SeAAR/SeADO complex [PDB ID: 6jzu]. The PaCS-MD simulations of the AAR/ADO complex were performed nine times using the distance between the active center and the C2 atom of the alkane head as CV. The CV reached 5 nm by ~100 cycles. Strikingly, in all cases the entire alkane dissociated completely from ADO without dissociation of AAR and ADO. In four of the nine simulations, the alkane was released from Exit 2 of SeADO (between Asn182 and Arg195, corresponding to Asp195 and Lys208 of PmADO), once from Exit 3 (from Leu191, corresponding to Leu204 of PmADO), and four times from Exit 6, specifically between Leu176 and Met180 (corresponding to Leu189 and Met193 in PmADO) (Figure 6C; Supplementary Figure S11C; Supplementary Table S6). The release point at Exit 6 was slightly different from that observed in the dissociation simulation of monomeric PmADO, where the product was released from the region between Met193 and Asp200 (2 out of 3 times). This may be due to the difference in the amino acid sequence of PmADO and SeADO. In summary, the present simulations clearly showed that the alkane product can be released from the AAR/ADO complex. The number of cycles required for alkane release from the AAR/ADO complex was similar to that from monomeric ADO (Figure 6), indicating that the bound AAR does not act as a barrier for alkane release from ADO (Supplementary Figure S12).
PaCS-MD simulations of substrate delivery from AAR to ADO
Finally, we performed PaCS-MD simulations for the substrate delivery from AAR to ADO. We used the SeAAR/SeADO/aldehyde complex (without alkane or formic acid in ADO) [PDB ID: 6jzu] as the initial structure. The distance between the C18 atom at the tail region of the aldehyde and Ile27 in the hydrophobic tunnel of SeADO was set as CV (Supplementary Figure S13A). The simulations were performed nine times to decrease the CV. In all cases, the CV reached 5 Å by 200 cycles, and finally the aldehyde was about to enter the hydrophobic tunnel of ADO. The aldehyde entered ADO from Exit 5 in seven of the nine simulations, and twice from Exit 2. Thus, in many cases, the aldehyde substrate enters ADO from a different position than the product exit (Exit 2) (Figure 7A). In the final structures of the simulations, Trp178 of SeADO (corresponding to Arg191 of PmADO), which was present at the substrate entrance (Exit 5), was in close contact with the hydrophobic region of the long-chain aldehyde (Supplementary Figure S13B). Previous studies show that the W178R substitution in SeADO increases the efficiency of alkane synthesis [51]. Our simulations suggest that the hydrophobic interactions between Trp178 and the long-chain aldehyde delays substrate entry, and removal of Trp and replacement with Arg by the W178R substitution may improve the efficiency of substrate entry.

Figure 7
Product release and substrate entry of ADO. (A) A superimposed image showing the entry of aldehyde (magenta and orange) from AAR to ADO and the dissociation of alkane (blue) from ADO. (B) A proposed model of alkane production by ADO without dissociation of AAR. See text for details.
Discussion
Alkane motions in ADO
Here, we used MD simulations to analyze the dynamics of the interaction between ADO and the substrate (octadecanal) or product (heptadecane), one of the most common alkanes in cyanobacteria. The simulations suggested that the alkane can rotate repeatedly within the hydrophobic tunnel of ADO. The movement of hydrophobic residues, especially Phe130 located at the corner of the T-shaped tunnel, formed a cavity within the tunnel, allowing the alkane to freely change directions and approach Ile190 and Met193. It may be possible that the slow turnover rate of ADO, at ~1 min–1, is due to the interactions between the hydrophobic tunnel inside ADO and the highly hydrophobic long-chain alkane, leading to the slow dissociation of the product.
In the MSM analysis, the stationary probabilities were high for metastates 5 and 11 (Figure 5C), where the head and tail regions of the alkane, respectively, were close to Exit 2. This suggests that Exit 2 is the most likely exit for product release, consistent with the PaCS-MD simulations of the product release.
Exits for product release
By performing PaCS-MD simulations for ADO, we were able to observe the dissociation process of alkane from ADO. The alkane product was released through multiple exits, i.e., Exits 2, 3, and 6. The most frequently observed alkane exit in PaCS-MD of ADO was Exit 2 (22 out of 35 runs [63%]). Exit 2 is surrounded by Leu194, Asp195, Lys208, and the loop between helices H6 and H7, and has the largest maximum bottleneck radius (2.0 Å) in the 5 μs MD simulations of ADO (Tables 1, 2). Consistently, when alkane was released from Exit 2, its average bottleneck radius was 1.44±0.35 Å with a maximum of 2.14 Å (Table 3; Supplementary Table S7). This was wider than the other exits. In addition, Exit 2 is present for ~50% of the MD simulation time, leading to the observation that the alkane was often released from Exit 2. The second most frequently observed alkane exit was Exit 3 (10 out of 35 runs [29%]). Exit 3 is located on the opposite side of Exit 2 across the H6–H7 loop and is surrounded by the ends of helices H1, H4, and H6. When alkane was released from Exit 3, its average bottleneck radius was 1.08±0.17 Å with a maximum of 1.85 Å (Table 3; Supplementary Table S8), which is narrower than that of Exit 2. The standard deviation of the bottleneck radius for Exit 3 was small (0.17 Å), indicating that this exit rarely opened. The third exit for alkane release from ADO was Exit 6 (3 out of 35 PaCS-MD simulations [9%]). Exit 6 is located between the helices next to Exit 2. Since the alkane can approach Met193 inside ADO, which is close to Exit 6, it is not surprising that it dissociates from this exit. When alkane was released from Exit 6, its average bottleneck radius was 1.62±0.33 Å with a maximum of 2.13 Å (Table 3; Supplementary Table S9). Although the bottleneck of Exit 6 is as large as that of Exit 2, Exit 6 is present for only ~6% of the simulation time of monomeric ADO, leading to the observation that Exit 6 is rarely used for product release. Interestingly, in the AAR/ADO complex, alkanes were released from Exit 6 with the same frequency as from Exit 2. It is possible that the binding of AAR to ADO affects the structure around Exit 6 of ADO, thereby facilitating the release of alkanes from Exit 6. Note that formic acid was coordinated to an iron atom throughout the PaCS-MD simulations, which would dissociate from ADO by ligand exchange with water.
Table 3 Exits obtained by tunnel analysis of PaCS-MD trajectories with alkane released from Exits 2, 3, or 6. Alkane was released from Exits 2, 3, and 6 in 22, 10, and 3 out of 35 PaCS-MD simulations of ADO, respectively
| Exit |
Counta)
|
Frequency (%)b)
|
Bottleneck radius (Å) |
| Average |
Standard deviation |
Maximum |
|
|
For PaCS-MD trajectories with alkane released from Exit 2
|
|
| Exit 1 |
1147 |
93.3 |
1.19 |
0.17 |
1.63 |
|
|
Exit 2
|
919
|
74.8
|
1.44
|
0.35
|
2.14
|
|
| Exit 3 |
453 |
36.9 |
0.99 |
0.09 |
1.40 |
|
| Exit 4 |
216 |
17.6 |
0.97 |
0.07 |
1.36 |
|
| Exit 5 |
161 |
13.1 |
1.09 |
0.22 |
1.92 |
|
| Exit 6 |
134 |
10.9 |
0.99 |
0.10 |
1.47 |
|
| Exit 7 |
17 |
1.4 |
0.95 |
0.05 |
1.07 |
|
|
For PaCS-MD trajectories with alkane released from Exit 3
|
|
| Exit 1 |
564 |
95.3 |
1.18 |
0.15 |
1.54 |
|
| Exit 2 |
316 |
53.4 |
1.06 |
0.13 |
1.66 |
|
|
Exit 3
|
287
|
48.5
|
1.08
|
0.17
|
1.85
|
|
| Exit 4 |
82 |
13.9 |
0.97 |
0.06 |
1.16 |
|
| Exit 5 |
16 |
2.7 |
0.95 |
0.06 |
1.13 |
|
| Exit 6 |
31 |
5.2 |
1.04 |
0.11 |
1.35 |
|
| Exit 7 |
5 |
0.8 |
0.96 |
0.04 |
1.02 |
|
|
For PaCS-MD trajectories with alkane released from Exit 6
|
|
| Exit 1 |
181 |
96.3 |
1.19 |
0.14 |
1.59 |
|
| Exit 2 |
131 |
69.7 |
1.07 |
0.13 |
1.56 |
|
| Exit 3 |
61 |
32.4 |
0.98 |
0.06 |
1.16 |
|
| Exit 4 |
27 |
14.4 |
0.97 |
0.06 |
1.11 |
|
| Exit 5 |
15 |
8 |
0.97 |
0.07 |
1.11 |
|
|
Exit 6
|
67
|
35.6
|
1.62
|
0.33
|
2.13
|
|
a) Number of times the exit was observed in the snapshots (100 ps interval) during ~10 ns PaCS-MD simulations of ADO.
b) Frequency with which the exit was observed during ~10 ns PaCS-MD simulations of ADO, obtained by dividing the count by the total number of snapshots.
In contrast, although Exit 1 was the most frequently observed tunnel in the tunnel analysis, the distance between Exit 1 and the alkane was maintained at 7.5–10 Å during the simulations, and no alkane release from Exit 1 was observed. Instead, water molecules were observed entering the active center from Exit 1. As suggested previously, Exit 1 between helices H1 and H3 may be used for the entry and exit of hydrophilic molecules such as water, oxygen molecules, and the by-product formic acid, which are necessary for the reaction cycle of ADO. In addition, no dissociation of alkanes from Exit 4 was observed. In this region, both strong dispersion interactions and exchange repulsion terms indicative of steric hindrance were observed by FMO calculations. These results suggest that dissociation from Exit 4 is difficult because it is blocked by bulky residues such as Tyr34, Phe80, and Tyr138. Exit 7 appeared rarely during the MD simulation and PaCS-MD did not show any dissociation from this exit.
It should be noted that the dissociation of alkanes observed during PaCS-MD simulations depends on the CV setting method. Therefore, the fact that no dissociation was observed from exits other than Exits 2, 3, and 6 does not completely rule out the possibility of dissociation from these exits. Furthermore, while PaCS-MD is useful for forcing rare events, to our knowledge there is no theoretical guarantee that PaCS-MD can produce a structure ensemble that follows a Boltzmann distribution. Experiments such as comparing the amount of alkane synthesis with amino acid substitutions in some of the candidate exits (Exits 1–7) may reveal the exit through which the product dissociates.
Substrate entrance of ADO
The substrate entrance of ADO has been a controversial issue, with the possibility that it could enter from both sides of the T-shaped tunnel [10]. The crystal structure and interaction analysis of the AAR/ADO complex suggest that the substrate enters from H6–H8 of ADO [25,26]. However, the crystal structure did not show the connection between the tunnel for AAR product exit and the T-shaped tunnel of ADO, and the substrate entry site of ADO was still unclear. Our results from PaCS-MD of the AAR/ADO complex showed that the aldehyde substrate enters ADO mainly through Exit 5. These results are likely to provide a conclusion regarding the substrate entrance of ADO.
A putative model of alkane production by AAR/ADO complex
Gao et al. (2020) proposed a model based on the structure of the AAR/ADO complex that AAR and ADO dissociate to release the product from ADO [25]. Arai et al. (2018) also discussed the possibility that the product is released from both sides of the T-shaped tunnel of ADO [10]. However, our simulation suggests that there are multiple product exits, including one close to, but not the same as, the substrate entrance, and that the alkane product can be released from ADO without the dissociation of AAR.
Accordingly, we propose a new model for alkane synthesis by the AAR/ADO complex as follows (Figure 7B). AAR and ADO always exist as a complex with a dissociation constant of 3 μM [52], and the aldehyde produced by AAR is efficiently delivered to ADO. Then, ADO synthesizes alkane, while AAR produces aldehyde from acyl-ACP/CoA without dissociating from ADO. The alkane product of ADO is released from ADO while AAR remains bound, and ADO is immediately ready to receive the next substrate from AAR. In this way, the alkane synthesis reaction can proceed efficiently in the AAR/ADO complex.

