Abstract
Visualization of hydration structures over the entire protein surface is necessary to understand why the aqueous environment is essential for protein folding and functions. However, it is still difficult for experiments. Recently, we developed a convolutional neural network (CNN) to predict the probability distribution of hydration water molecules over protein surfaces and in protein cavities. The deep network was optimized using solely the distribution patterns of protein atoms surrounding each hydration water molecule in high-resolution X-ray crystal structures and successfully provided probability distributions of hydration water molecules. Despite the effectiveness of the probability distribution, the positional differences of the predicted positions obtained from the local maxima as predicted sites remained inadequate in reproducing the hydration sites in the crystal structure models. In this work, we modified the deep network by subdividing atomic classes based on the electronic properties of atoms composing amino acids. In addition, the exclusion volumes of each protein atom and hydration water molecule were taken to predict the hydration sites from the probability distribution. These information on chemical properties of atoms leads to an improvement in positional prediction accuracy. We selected the best CNN from 47 CNNs constructed by systematically varying the number of channels and layers of neural networks. Here, we report the improvements in prediction accuracy by the reorganized CNN together with the details in the architecture, training data, and peak search algorithm.
Significance
Hydration structures of proteins are necessary for understanding why the aqueous environment is essential for protein folding and functions. However, the complete visualization of hydration structures is still difficult in structural biology. We developed a neural network, which was trained by the distribution patterns of protein atoms surrounding each hydration water molecule in high-resolution X-ray crystal structures. The predicted probability distributions of hydration water molecules will be useful for investigating the roles of hydration structures in the stability and dynamics of proteins and for designing drug molecules including the hydration structures in the pharmaceutical industry.
Introduction
The aqueous environment is indispensable for proteins to fold into unique structures and to conduct biochemical and biophysical processes in living cells [1]. In the microscopic view of protein-water interaction, water molecules constitute parts of building blocks to stabilize protein structures including the catalytic center, mediate molecular interactions of proteins [2–4], and regulate internal motions necessary for biological functions [5–7]. Therefore, the visualization of the hydration structures of proteins is necessary for understanding why proteins require the aqueous environment at the atomic level [8].
The hydration structures of proteins have been investigated using various biophysical techniques [8–15]. Atomic details of hydration structures, such as the hydration sites and interaction modes, are predominantly provided by high-resolution X-ray crystal structure analyses at cryogenic temperature [6,8,16]. In X-ray crystal structure analysis, hydration water molecules appeared as spherical electron densities beyond a resolution of 2.0 Å. In local hydration structures, polar protein atoms are arranged to satisfy the tetrahedral hydrogen-bond geometry of water molecule [8,17]. However, it is difficult for crystallographic studies to provide hydration structures over protein molecules. For instance, we often miss hydration water molecules with large positional fluctuation, and hydration structures of areas occupied by precipitant molecules/ions and/or engaged in molecular contacts with crystallographic neighbors.
In contrast to X-ray crystallography visualizing protein structures in crystalline arrangement, cryogenic transmission electron microscopy (cryoEM) [18] for frozen-hydrated macromolecules allows us to visualize metastable conformations of proteins in solution [19,20] and has the potential to visualize the hydration structures of proteins [21,22]. Although both the protein conformations and their hydration structures are desirably visualized simultaneously, in many cases, the amounts of hydration water molecules identified in cryoEM maps are smaller than those detected in X-ray crystallography at an equivalent resolution, probably due to the low electron scattering cross-section of oxygen atoms [8]. Therefore, any computational approaches are necessary to predict the hydration structures for cryoEM structures.
Molecular dynamics (MD) simulations have shown the ability to predict hydration structures at a high spatiotemporal resolution [23–25] using the force field parameters optimized to reproduce crystallographically observed hydrogen-bond patterns [26]. Besides the MD simulations, the theory of liquids based on the statistical mechanics has been developed to predict hydration structures [27]. However, the theory is still in progress [28] because the hydration structures theoretically predicted over protein surfaces are inconsistent with the crystallographic observations [8]. In practice, as these computational approaches necessitate large computational costs and time, more convenient computational approaches are required to easily predict the hydration structures of proteins.
To reduce computational costs for predicting hydration sites, we defined a set of empirical hydration distribution functions (EHDF) around polar protein atoms through the database analysis of crystal structures of proteins [17]. The EHDFs were utilized to predict the distribution of hydration water molecules around hydrophilic amino acid residues [29,30].
Recently, as an alternative computational approach to those described above, neural networks (NNs) using the three-dimensional convolution filter (3D-CF) have been developed for predicting the hydration structures over the surfaces and in the cavities of proteins [31–33]. We also developed a convolutional neural network (CNN) dedicated to predicting the hydration structures of proteins [34]. The NN, which was optimized only using the distributions of protein atoms around hydration water molecules, provided probability distribution of hydration water molecules and hydration sites as the local maxima. The predicted positions as hydration sites were within 0.8 Å on average from the crystallographic hydration water molecules. However, the results were so unsatisfactory for us that the NN was subjected to improvement to reduce the positional differences between the predicted and experimentally observed hydration sites.
In this study, we reexamined the distance distribution of hydration water molecules from protein atoms by inspecting their electrostatic properties and increased the input channels from the previous four to 18. In addition, we constructed 47 NNs systematically varying the number of channels and layers in the NNs. Here, we report the prediction results by the newly reorganized NN together with the architecture, training data, and peak search algorithm.
Methods
Selection of protein structure models
We prepared training, validation and test datasets from crystal structure models of proteins available from the Protein Data Bank [35]. We picked up hydration water molecules, which were located within 5 Å from protein atoms. It should be noted that hydration water molecules within typical hydrogen-bond distances from protein atoms (2.4<d<3.4) satisfied the tetrahedral hydrogen-bond geometry of water molecules and independent of amino acid sequences of proteins.
To collect a sufficient amount of reliably identified hydration water molecules, we surveyed crystal structures along with more than 100 identified water molecules. In addition, for diminishing the positional unambiguity of hydration sites as small as possible, we selected the structure models which were refined at a resolution beyond 1.8 Å against diffraction data collected at a cryogenic temperature and displayed crystallographic R-factors smaller than 0.20. Furthermore, to avoid redundant selection in terms of amino acid sequences, we obtained 7,937 representatives of sequence clusters below 30% sequence similarities, provided by RCSB PDB using MMseqs2 [36].
From the selected 7,937 structure models, we divided them into 7,137 as training data (Supplementary Table S1) and the remaining 800 as test data (Supplementary Table S2). As an extra evaluation data, we used the crystal structures of glutamate dehydrogenase (GDH) at a resolution of 1.8 Å [5,30,34], nitrile hydratase (NHase) at 1.7 Å [2,34,37], and other three types of proteins described in the Results section. These evaluation data were also selected to show the sequence similarities below 30% with any sequence in the training and test data.
Distance distributions of protein atoms surrounding hydration water molecules
For the dataset generation, we focused on the partial charges of protein atoms and surveyed the distributions of protein atoms from the hydration water molecule (Fig. 1 and Table 1). As a result, we separated protein atoms into 18 types as follows.

Figure 1
Distance distributions of protein atoms from hydration water molecules. The number of protein atoms used in the calculation of the distance distributions are summarized in Table 1. (A) Classification of carbon atoms composing 20 amino acids. The classified seven types are aliphatic (black filled circle), carboxylic (red), aromatic (green), proline (blue), histidine (magenta), type-1 (orange) and type-2 (cyan) of tryptophan sidechain. The sulfur atoms of cysteine and methionine are colored in brown and purple, respectively. (B, C) Distance distributions of the carbon atoms in the seven types from their nearest crystal water sites. In this plot and the following ones, each distribution was normalized with respect to the sum of the appearance frequencies. (D) Distance distribution of the sulfur atoms from their nearest crystal water sites. The distribution profiles in (B–D) are colored according to the scheme in panel (A). (E) Classification of oxygen atoms composing 7 amino acids and peptide bond. The classified five types are hydroxy (black filled-circles), peptide bond (red), amide (green), carboxy (blue) and OH of tyrosine (purple). (F) Distance distributions of the oxygen atoms in the five types from their nearest crystal water sites. The profiles are colored according to the scheme in panel (E). (G) Classification of nitrogen atoms composing eight amino acids. The classified five types are peptide-like (black), NE atom of arginine (red), NZ atom of lysine (green), histidine sidechain (blue) and amide-like (purple). (H) Distance distributions of the nitrogen atoms in the five types from their nearest crystal water sites. The profiles are colored according to the scheme in panel (G). (I) Distance distributions of crystal water sites from their nearest crystal water sites. The distribution was calculated from 3,265,405 hydration water molecules in 7,143 crystal structure models.
Table 1 Protein atoms used in the distance distribution from crystal water molecules
| Atom |
Type |
Number of atoms |
Peak position (Å) |
r
min (Å)* |
| Carbon |
Aliphatic |
405,487 |
3.71 |
2.925 |
|
Carboxylic |
20,550 |
Approximately 3.5 |
2.700 |
|
Aromatic |
41,873 |
3.66 |
3.100 |
|
Proline |
60,831 |
3.66 |
3.225 |
|
Histidine |
16,834 |
Approximately 3.6 |
2.725 |
|
Trp type-1 |
2,623 |
Approximately 3.7 |
3.125 |
|
Trp type-2 |
510 |
Approximately 3.5 |
3.075 |
| Sulfur |
|
4,288 |
Approximately 3.4 |
2.200 |
| Oxygen |
Hydroxy |
209,319 |
2.71 |
2.475 |
|
Peptide-bond |
1,069,604 |
2.74 |
2.525 |
|
Amide |
125,967 |
2.74 |
2.375 |
|
Carboxy |
492,155 |
2.71 |
2.350 |
|
Tyr OH |
69,818 |
2.66 |
2.425 |
| Nitrogen |
Peptide-like |
333,323 |
2.91 |
2.675 |
|
Arg NE |
29,025 |
2.86 |
2.425 |
|
Lys NZ |
98,791 |
2.81 |
2.400 |
|
His sidechain |
40,322 |
2.76 |
2.500 |
|
Amide-like |
237,388 |
2.94 |
2.425 |
*rmin is the exclusion radius of each atom used for modifying the probability distribution in searching hydration sites (Supplementary Table S3).
Carbon atoms were separated into seven types, i.e., aliphatic, carboxylic, aromatic, proline, histidine, and two types of tryptophan (Fig. 1A). The distance distributions of aliphatic, aromatic, and proline carbons exhibited similarities with respect to the profiles and the peak positions, while those of the other four differed (Figs. 1B-C and Table 1). Sulfur atoms were treated as a single type, because of the minimal differences in methionine and cysteine and the smaller number of available atoms than those of the other three atoms (Fig. 1D).
Oxygen atoms were separated into five types, i.e., hydroxy, peptide-bond, amide, carboxyl, and OH of tyrosine (Fig. 1E). Their distance distributions exhibited a slight difference in the peak position mainly due to the contributions of π-bonding (Fig. 1F). Nitrogen atoms were separated into five types, i.e., peptide-like, NE atom of arginine, NZ atom of lysine, histidine sidechain, and amide-like (Fig. 1G). The distance distributions of the five types had more variety than those of the other three atom types in both the profiles and peak positions (Fig. 1H).
Preparation of dataset
For collecting the distribution patterns of protein atoms surrounding hydration water molecules, we used a trimming box of 11.25×11.25×11.25 Å3, which was a 45×45×45 array of 0.25×0.25×0.25 Å3 voxel. For each crystal structure model, scanned surfaces and cavities with a non-zero ASA [38] were canned using the trimming box. When a hydration water molecule is present within the trimming box, the center of the box was moved to the water molecule, and the distribution pattern of protein atoms within the box was assigned as the ‘water-present’ pattern. When water molecule was absent, the distribution pattern of protein atoms was collected as a ‘water-absent’ pattern. To generate unbiased datasets, the number ratio between the water-present and water-absent patterns was equalized. Each distribution pattern was voxelized separately with respect to the 18 atom types.
From the training data consisting of 7,137 protein structures, 6,530,810 patterns were prepared as datasets, and then divided into 70% as a training dataset and the remaining 30% as a validation dataset. In addition, 738,560 patterns were generated as a test dataset from the test data of 800 protein structures. It should be noted that the selection of the training dataset was independent from protein structures and sequences. As the datasets contained a large number of patterns, we conducted no data augmentation by rotation operation for the patterns.
Construction of neural network
We constructed CNNs [39] composed of a convolution block (CB) and a fully connected block (FCB) (Supplementary Note S1 and Table S4). The CB processes the given distribution patterns of protein atoms by two or three convolution units (CU), each of which was composed of two convolution layers (CL) followed by a max-pooling [40] to down-sample the CL-output and a dropout (DO) layer to avoid overfitting [41]. A three-dimensional convolution filter (3D-CF) of F×F×F, in this study F=3, was applied to each distribution pattern of atoms as follows:
|
u
i
j
k
=
∑
p
=
1
F
∑
q
=
1
F
∑
r
=
1
F
x
i
+
p
,
j
+
q
,
k
+
r
f
p
q
r
,
| (1) |
where xi+p,j+q,k+r, fpqr, and uijk are the input data, the convolution filter, and output data, respectively. The number of channels in the second CL was twice that of the first. The first CU had (45×45×45)×18 channels to independently process the distribution patterns of the 18 atom types. A rectified linear function [42] was applied to the output of each layer as an activation function throughout the NN.
The FCB was composed of two fully connected units, each of which was followed by one dropout layer. The number of nodes in each unit was a variable. The output of the FCB was fed into the softmax function, and then evaluated using the loss function, which is the binary cross-entropy. For the output y∈[1,0] for the positive class (d=1) or negative class (d=0), the binary cross-entropy is calculated as:
|
L
(
w
)
=
−
{
d
log
y
+
(
1
−
d
)
log
(
1
−
y
)
}
,
| (2) |
where w represents all the parameters of the model (Fig. 1B). Throughout the training, the parameters of 3D-CFs in the CLs and FCB were optimized to minimize the loss function [43].
We constructed 47 CNNs by systematically varying the numbers of CU, channels in CL, nodes and layers in FCB (Supplementary Table S4). We selected several CNNs by inspecting the accuracy and loss scores for the validation and test datasets (Supplementary Note 2 and Table S5).
For evaluating the selected CNNs using the test dataset generated from 800 protein structure models (Supplementary Table S2), we used validation metrics, such as accuracy, precision, recall, F1-score, receiver operating characteristic (ROC) curve and area under curve (AUC) value. The metrics are described in detail in Supplementary Note S2 and the results are compiled in Supplementary Fig. S1 and Table S6. In addition, we examined the frequency distribution of hydration probability at the sites of hydration water molecules found in the crystal structures of GDH (Supplementary Fig. S2) and NHase (Supplementary Fig. S3).
Hydration probability
For the calculation of hydration probability over a protein, solvent accessible surfaces and cavities were scanned using a 21×21×21 array of 0.50×0.50×0.50 Å3 voxel. The CNN inspected the distribution pattern of protein atoms around the center voxel and yielded hydration probability. The CNN iteratively conducted this procedure for all voxels that were located within the range of 2–5 Å from protein atoms, which had non-zero ASA values.
Seach method for hydration sites and output data format
Around a crystal water site, predicted hydration probability frequently displayed plateau of saturated value in a region larger than 1-Å diameter. In the region, a single hydration site is difficult to be proposed. When randomly sampled from the plateau region, the predicted site may be up to 1 Å apart from the crystal water site. To find the center of the plateau, we convoluted a Gaussian low-pass filter to the predicted hydration distribution. The standard deviation value of the filter was carefully determined through trial calculations (Supplementary Note S3).
Next, to avoid predicting hydration sites too close to the protein atoms, we introduced the exclusion radii of the protein atoms and hydration water molecules into the Gaussian-convoluted probability distribution. The exclusion radius for each of 18 atom species was determined using the accumulated frequency of the distance distribution in Fig. 1 (Supplementary Note S3, Fig. S4, Table S3, and Table S7).
In the next stage, hydration sites were iteratively determined from the highest probability regions to the next by reducing the threshold value of the probability distribution. During the threshold reduction, we estimated the number of predicted hydration sites of a target protein by comparing it to the possible number of hydration sites expected from the average coverage of a single hydration water molecule in the first layer class (20 Å2 in ASA) [8,44]. As a result, the threshold for the predicted probability distributions was set to 80% so that the amount of predicted hydration sites was comparable to the estimated amount of hydration water molecules.
Finally, the probability distribution was generated in the MRC format [45], and the coordinates of the predicted hydration sites were written in the mmCIF format [35].
Prediction scores
With respect to the water-present sites, we calculated the mean absolute positional deviation (MAD) and root-mean-square deviation (RMSD) scores, defined as follows:
|
M
A
D
=
1
N
∑
i
=
1
N
|
r
i
c
−
r
i
p
|
,
R
M
S
D
=
∑
i
=
1
N
(
r
i
c
−
r
i
p
)
2
N
,
| (3) |
where ric and rip are the positions of an experimentally identified hydration site and the hydration site from the probability distribution, respectively. N is the number of hydration sites targeted in the evaluation.
Coding and computation
The CNNs were constructed using the Python language and several routines available from TensorFlow (Google Brain, USA). All computations were performed on a high-speed computer server composed of two Intel Xeon Gold 6226R (16 cores, 16 threads) (HPCT W216gs-DL, HPC Tech, Japan) equipped with a GPU card (NVIDIA Quadro RTX 8000 of CUDA version 10, NVIDIA, USA).
Results
Selection of the best CNN
Forty-seven CNNs were constructed by systematically varying the composition and parameters in both CB and FCB (Supplementary Note S1 and Table S4). At first, we selected five CNNs by inspecting the validation metrics such as accuracy, precision, recall, F1-scores and the ROC curves for the test dataset (Supplementary Note S2, Table S5, Fig. S1, and Table S6). Next, we selected the best CNN by comparing the frequency distributions of the hydration probability at the crystal water sites in the crystal structures of GDH [5,30,34] and NHase [2,34,37], which were prepared as the evaluation data (Supplementary Figs. S2–S3).
The selected CNN (Fig. 2A) displayed the validation metric values in Table 2, which were better than those yielded by the previous CNN. The ROC curve (Fig. 2B) reached approximately 0.9 at the false positive rate of 0.2 and the AUC value was 0.922. In addition, with respect to the 800-test data, we inspected the predicted hydration probabilities at crystal water sites (Fig. 2C) and the distances between predicted hydration sites and its nearest crystal water sites (Fig. 2D: see the “Seach method for hydration sites and output data format subsection” in the Method section). For more than 62.3% of the crystal water sites, the selected CNN yielded probabilities greater than 80%. The predicted hydration sites were located within 1.0 Å from crystal water sites of more than 61.4%. The new CNN and site-searching algorithm provided much better scores in the positional accuracy monitored by MAD and RMSD than the previous one and other NN-based prediction methods [31–33] (Table 2).

Figure 2
(A) Architecture of the selected CNN. (B) The receiver operating characteristic (ROC) curve of the selected CNN. (C) Frequency distribution of the predicted probabilities at the 365,329 crystal water sites identified in the 800 test crystal structures for the evaluation of the selected CNN. (D) Frequency distribution regarding the distances between predicted hydration sites and crystal water sites of the test 800 crystal structures.
Table 2 Validation and performance of the best CNN
| Validation of the selected NN using a set of 800 crystal structures |
| Loss |
0.3588 |
F1-score |
0.8455 |
| Accuracy |
0.8441 |
AUC |
0.9210 |
| Precision |
0.8379 |
AUC-PR |
0.9189 |
| Recall |
0.8533 |
|
|
| Prediction results for GDH and NHase |
| GDH/NHase |
Number of predicted sites |
| 7,820/2,844 (4,671/1,456) |
|
First-layer class |
Inside class |
| Number of crystal-water sites |
1,425/785 |
195/170 |
| Ratio of crystal-water sites with probability greater than 80% (%) |
74/65 (81/72) |
91/89 (93/89) |
| MAD (Å) |
0.402/0.465 (0.60/0.68) [1.13/0.72] |
0.326/0.353 (0.52/0.53) [0.39/0.33] |
| RMSD (Å) |
0.554/0.658 (0.82/0.93) [1.13/1.10] |
0.436/0.490 (0.73/0.73) [0.65/0.51] |
The values in the parentheses and square brackets were obtained using the previously developed CNN [34] and Accutar [31], respectively.
As representative results of the CNN-prediction, Figure 3 depicts the predicted hydration probability distributions for NHase. The predicted hydration probability distribution at the 10% level covered the entirety of the protein molecule, with their inner surface considerably approximating the accessible solvent area (ASA), which was obtained using a sphere of 1.4-Å radius (Fig. 3A). By increasing the contour level, the distributions were localized as illustrated for the 50% level. At the 80% level, approximately corresponding to the one standard deviation level from the 100% probability (see Fig. 3B), the probability distributions were localized around the crystal-water sites. As the probability distributions had significant values for surfaces lacking crystal waters, the distributions provide potential hydration sites, which were missed in structure analyses.

Figure 3B shows the probability at crystal water sites of GDH and NHase. The CNN gave the probabilities higher than 80% for more than 90.8% and 88.8% of the crystal water sites in the inside class of GDH and NHase, respectively. Therefore, we concluded that the CNN is applicable to predict hydration sites in the cavities of proteins. Regarding the crystal water sites in the first-layer class of GDH and NHase, the probabilities higher than 80% reached more than 74.2% and 64.8%, respectively, implying that the CNN is suitable for predicting the hydration structures the solvent accessible surfaces of proteins.
Next, we compared the predicted hydration sites by the new CNN with those by the previous CNN with respect to the distances from the crystal water sites (Fig. 3C) and those from the protein atoms (Fig. 3D). In the frequency distributions on the distances between the predicted hydration sites and crystal water sites in GDH and NHase (Fig. 3C), 75.6% of hydration sites predicted by the new CNN were located within 1 Å from the crystal water sites, while the amount of the predicted sites by the previous CNN was 51.6%. Regarding the distances between the predicted sites and their nearest oxygen atoms, the new CNN yielded a frequency distribution of more than twice the height of that yielded by the previous CNN. The total number of oxygen atoms increased to 5,052 by the new CNN from 3,481 by the previous. The number of nitrogen atoms surrounding the predicted sites increased to 1,691 by the new CNN from 1,291 by the previous CNN. The number of carbon atoms was comparable between the new and previous CNNs. Therefore, we concluded that both the new CNN and the site-search algorithm predicted hydration sites closer to the crystal water molecules than the previous CNN.
Predicted hydration sites in the inside class
In this and the following sections, we showed representative examples of hydration structures predicted by the new CNN in detail to understand the characteristics of the predicted probability distributions and predicted sites.
As hydration water molecules in cavities of proteins act as building blocks for stabilizing the structures of proteins [2,8,46], understanding the roles of hydration water molecules in cavities requires a high accuracy in predicting hydration sites. Here we show examples of the predicted hydration distribution probabilities and hydration sites in the inside class of NHase and GDH.
For a narrow cavity formed by Thr166/α, Tyr168/α, and Asp202/β sidechains at the interface of the α- and β-subunits of NHase (Fig. 4A), the predicted hydration probability distributions were localized at the crystal water sites. In the adjacent cavity formed by Tyr127/α and Leu192/α sidechains, the predicted probability distributions were continuous along the arrangement of crystal water sites 1–3 and between 4–5. Most of the hydration sites predicted by the new CNN were located within 0.3 Å from the crystal water sites. In both the cavities, the predicted sites were closer to the crystal water sites than those predicted by the previous CNN.

Comprising six identical subunits, GDH is convenient to examine the reproducibility of the hydration prediction. For the cavities formed by Arg65 and Thr91 (Fig. 4B), the predicted probability distributions were localized at the crystal water sites in each subunit, and most of the predicted sites were located within 0.3 Å from the crystal water sites. The sites predicted by the previous CNN displayed significant deviations from crystal water sites 2 in subunits C and D.
As a result, with respect to the reproducibility for hydration sites of the inside class, the new CNN displayed better performance than the previous CNN. The predicted probability distributions tended to be more localized in narrower cavities, but more continuous distributions in wider cavities.
Predicted hydration sites in the first layer class
Hydration water molecules of the first-layer class covering the surfaces of proteins have roles to maintain the surface structures of proteins [8]. In addition, their positional changes sometimes regulate conformational changes of proteins [7,8]. Figure 5 depicts the predicted probability distributions and hydration sites on the solvent accessible surfaces of NHase and GDH.
Figure 5A shows the prediction for a hexagonal arrangement of crystal water sites surrounding Ser109/β1 of NHase. The new CNN predicted hydration sites close to 12 crystal water sites, while the previous CNN failed the prediction of sites 2, 4, 6, 8, and 10. Regarding the hydration of Ser109/β2, the new CNN predicted crystal water site 6 missed in the crystal structure analysis. The new CNN did not fail the prediction, while the previous CNN failed the prediction for crystal water sites 2, 5, 9, and 11.
The crystal water sites of the first-layer class covering the six subunits of GDH are also advantageous to examine both the reproducibility of hydration structures predicted by CNNs. Figure 5B depicts the first-layer hydration structures surrounding the Gln409 side chain in each subunit. The predicted probability was circularly and continuously distributed over the six crystal water sites. Although crystal water site 5 were missed in subunits C and D of the crystal structure, the new CNN predicted hydration probability distributions for crystal water sites 1–6 for each subunit. In addition, the previous CNN failed the prediction for several crystal water site, such as sites 2, 3, and 5 in subunit A, and sites 3–5 in subunit B. Therefore, from the prediction on the hydration structures surrounding Gln409, the new CNN displayed better performance regarding the predictability and reproducibility than the previous CNN.
In contrast to the localized probability distributions in small cavities (Fig. 4), the delocalization of the probability distribution was one of characteristics in the prediction for the first-layer class. This tendency suggests the movability and exchangeability of hydration water molecules between the sites covered by the continuous probability distribution.
Predicted hydration sites in water channel
Proteins has channel-like arrangements of hydration water molecules connected to bulk solvent as found first in lysozyme [29]. Aquaporin [48,49], as a representative example, has a water permeable channel composed of seven hydration sites. As the water channel is biologically important, it is worth examining the prediction accuracy of the new CNN for the water channel (Fig. 6).

The new CNN predicted hydration probability was continuously distributed over the channel with peak values near the crystal water sites. The continuous probability may correlate with the water permeability of the channel as discussed later. The predicted hydration sites except site 3 were located within 0.3 Å from the crystal water sites. The probability distribution covered site 3, but the site-searching algorithm suggested two possible hydration sites surrounding site 3. In contrast to the new CNN, the previous CNN predicted hydration sites located slightly distant from the crystal water sites, and missed site 2. In this case, the new CNN was advantageous to predict the seven hydration sites than the previous CNN.
Predicted hydration sites on hydrophobic surface
Clusters of hydrophobic residues exposed to bulk solvent are frequently hydrated by parts of clathrate structures formed by hydration water molecules [8,16,50,51]. As reported previously, knowledge-based prediction around hydrophobic surfaces is quite difficult, because of the absence of any regular distribution of hydration water molecules around hydrophobic sidechains [52]. Therefore, it is a good examination whether hydration structures on hydrophobic surfaces are predicted by the new CNN, which was trained using hydration structures covering hydrophobic surfaces of proteins.
On an NHase surface, a pair of pentagonal arrangements of crystal water sites covered the surface of Pro175/α2-Ala176/α2 of α2-subunit (Fig. 7A). The predicted probability distribution overlapped with the eight sites and additional sites necessary to anchor the pairs to polar protein atoms. For six of 10 crystal water sites (1, 4, 5, 7, 8, and 10), the new CNN predicted hydration sites were located at closer positions than those from the previous CNN. In addition, the previous CNN failed the prediction of sites 5, 6, and 10. On the surface of Pro175α1-Ala176α1 of α1-subunit, although crystal water molecules at sites 2, 4 and 7 were missed in the electron density map, the CNN predicted the presence of the hydration sites.
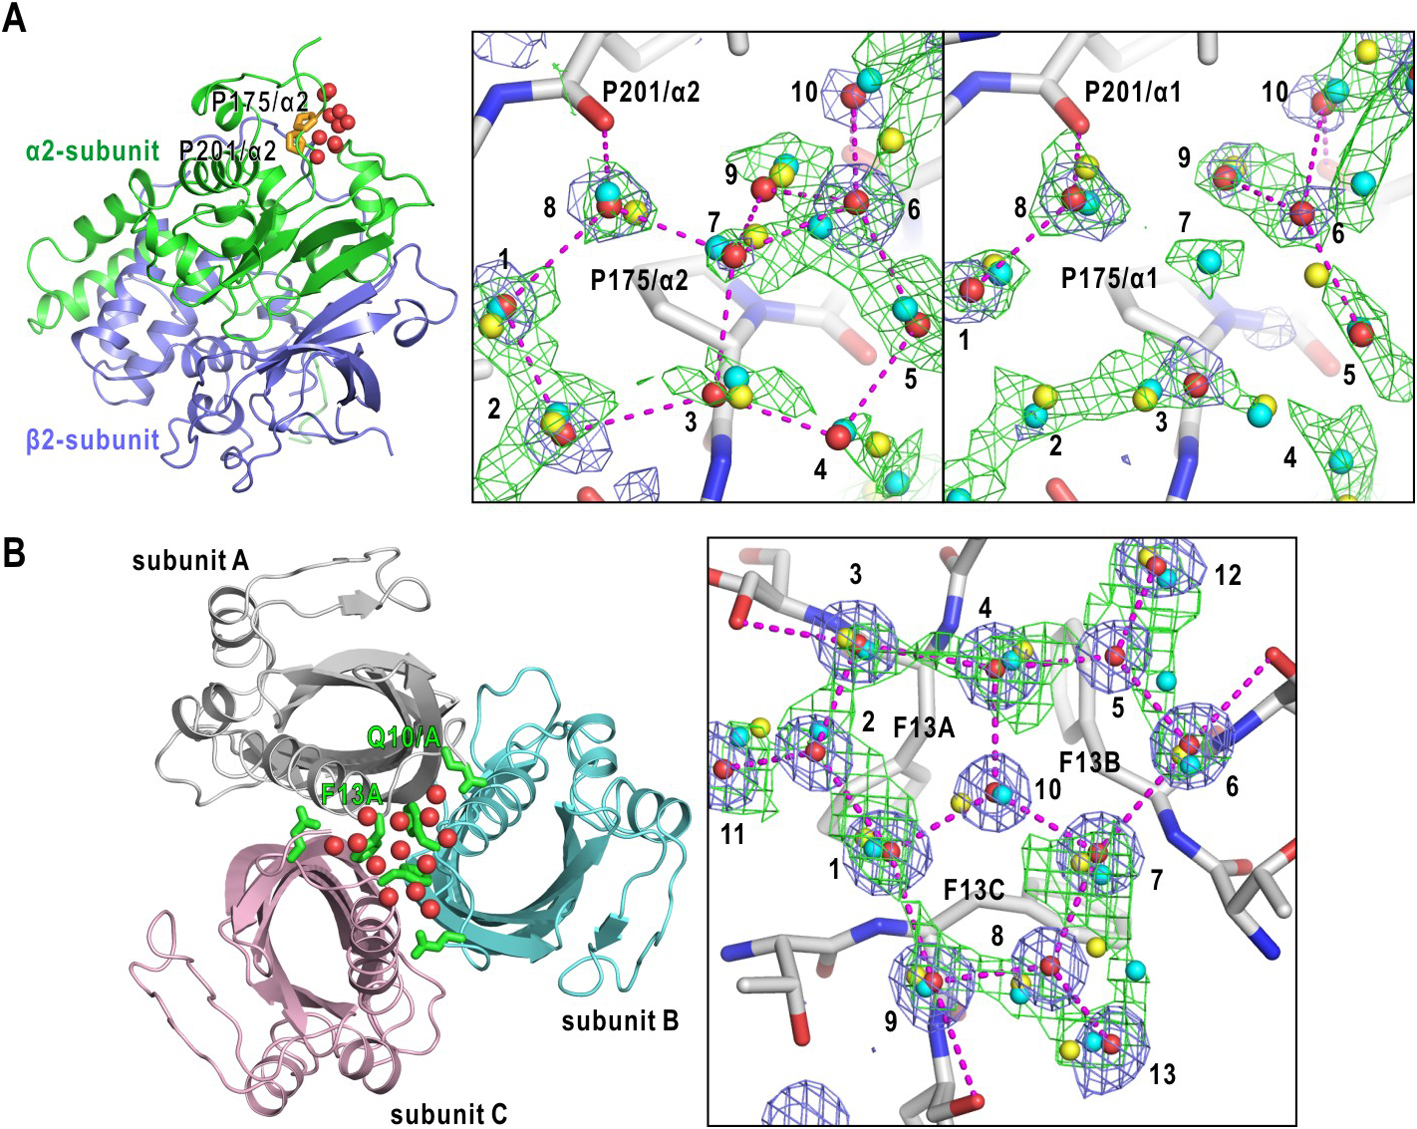
Figure 7B shows the predicted probability and crystal water sites on hydrophobic surface formed by three phenylalanine residues on a surface of scytalone dehydratase (SDH) [53,54]. The phenylalanine residues are covered by three sets of pentameric arrangement of crystal water sites. The new CNN yielded more localized probability distributions than the previous CNN for the three sets of pentagonal arrangements, and the predicted sites were closer to crystal water sites 1–4, 9, and 10 than those from the previous CNN. The previous CNN failed the prediction for crystal water sites 2, and 5, and predicted site was distant from site 10 at the center of the three pentagons. Therefore, the CNN may be superior to the previous CNN with respect to the prediction of hydration structures of hydrophobic surfaces.
Discussion
The new CNN was constructed using a new architecture and trained by the distribution of protein atoms incorporating the electronic properties of protein atoms (Figs. 1 and 2). In addition, for searching hydration sites from the predicted probability distribution, the new algorithm was developed by taking the exclusion volume of atoms and water molecules into consideration. As a result, the new CNN yielded hydration probabilities covering the crystal water sites and predicted hydration sites located closer to crystal water sites than the previously developed CNN (Figs. 3C, 3D, and 4–7). Here, we discuss the characteristics of the predicted hydration probability distribution and the future application and prospect of the CNN for predicting hydration structures of biological macromolecules.
Localization and delocalization of probability distribution
The CNN learned the localized distributions of hydration water molecules in small cavities and the positional variations of hydration water molecules around polar atoms exposed to solvent. Subsequently, the CNN predicted two types of hydration probability distributions. In many small cavities, probability distributions were localized at the stable crystal water sites to give hydration sites within 0.3 Å from the crystal water sites in the inside class (Fig. 4). As most of the hydration water molecules in the inside class acts as building blocks for stabilizing protein structures, the small uncertainty is very important to understand the roles of the hydration in protein structures.
On the other hand, in large cavities and on most of protein surfaces, hydration probabilities were delocalized and continuously distributed over the crystal water sites (Figs. 4–7). The delocalized probability distribution may sometimes correlate with the functions of proteins. In the case of aquaporin (Fig. 6), hydration water molecules actually travel through the channel formed by a hydrophilic wall of Ile202, Val206, and Phe81 and a hydrophilic wall Asn101, Asn222, and Arg225. Although the crystal structure visualized the localized hydration sites, the predicted probability distribution was delocalized for the narrow channel. The probability distribution may imply the movability of hydration water molecules between each pair of sites. Based on the crystal structure only, the permeability of the water channel is difficult to be interpreted. Therefore, the CNN-predicted hydration probability distribution may be helpful to judge whether a train of hydration water molecules in a channel is movable. In addition, the probability distribution may indicate site-dependent variation of the permeability of water molecules. The probability between sites 6 and 7 was lower than the in between regions of the other pairs of hydration sites. This low probability suggests that the permeability between sites 6 and 7 may be reduced probably due to the four hydrogen bonds with four polar atoms forming the channel.
These examples on localized and delocalized distributions of predicted hydration probability demonstrate the usefulness of the CNN for investigating the positional fluctuations of hydration water molecules in the cavities and on the surfaces of proteins.
The use of the CNN in theoretical studies
In theoretical studies subjected to the prediction of hydration structures, NNs were trained using the theoretically predicted hydration structures and/or hydration structures obtained from MD simulations [55]. However, as demonstrated in our previous study [26], appropriate force field parameters are necessary to reproduce experimentally observed hydration structures. In addition, the hydration structures predicted by the three-dimensional reference site model is inconsistent with the distribution of crystal water sites [8]. Therefore, we avoided the use of the hydration structures, which were virtually predicted by statistical mechanical calculation for liquid and molecular dynamics simulation.
In this study, the CNN demonstrated the feasibility to predict hydration probability and hydration sites consistent with the crystal water sites. Therefore, supported by the consistency, we suggest here how the CNN-predicted hydration probability and sites can be used in theoretical studies including MD simulations.
In the recent trend of structural biology, the experimentally visualized structures of proteins are subjected to MD simulations to investigate the dynamical motions and roles of key amino acid residues. When the resolution in the structure analysis is insufficient to identify hydration water molecules, it is necessary to generate hydration structures in cavities and on the surfaces. In particular, hydration of cavities inside protein is indispensable to avoid the collapse of protein structures during MD simulation. Then, the CNN may adequately and easily provide probable hydration structures for validating hydration structures generated by MD calculations.
In this regard, we have to examine whether the hydration structures provide by MD simulations are correctly reproduce real hydration structures. As reported previously, we demonstrated that the force field used in MD simulations are necessary to be improved with respect to the hydration patterns [26]. Then, we referred to the hydration distribution predicted by aggregating the knowledge-based hydration distributions around polar protein atoms [17,29]. However, the assessment was limited to hydrophilic surfaces in the previous study. Now, as the new CNN predicts not only hydrophilic surfaces but also the hydrophobic surfaces, the evaluation will be also applied to hydrophobic surfaces of proteins as demonstrated in Fig. 7.
In theoretical studies on protein structures, the design of small protein molecules is now possible using powerful artificial intelligence [56,57], such as AlphaFold2 [58]. However, the hydration structures of the designed proteins are unknown. Then, as the CNN predicts the hydration structures, it may be possible to analyze why the designed proteins are folded from the view point of hydration structures and hydration free energy.
In the field of drug design, docking studies of candidate molecules and proteins are routinely carried out [59,60]. However, hydration structures at the ligand binding-sites significantly contribute to ligand-binding geometry and the entropy/enthalpy compensation [4,61,62]. Since the CNN can predict the hydration structures of proteins and probably drug molecules composed of carbon, oxygen, nitrogen, and sulfur atoms, the quick prediction of hydration structures may help the survey of drug molecules including the influence of hydration.
Future prospect
The positional differences between the predicted and crystal water sites, such as observed in Figs. 2C, 2D, 3B-D, may be further improved. One of the possibilities for improvements is the incorporation of stereochemical information on hydrogen bonds of polar protein atoms as obtained in the previous study [17]. Then, the application of stereochemical information may be depended on how many residues involved in the formation of hydration sites.
To expand the applications of the CNN, the orientation of hydration water molecules is a challenging problem to task. To estimate the orientation, the positions of hydrogen atoms are indispensable. High-resolution X-ray crystal [63] and cryoEM [64] structure analyses, and neutron crystallography [65–68] have been providing the hydration structures including the positions of hydrogen atoms. However, at the present time, the accumulated structures are insufficient to train the new CNN, which may predict the probability distributions and positions of hydrogen atoms by introducing an atomic channel for hydrogen atoms.
As the used of the CNN is limited to soluble proteins only, we must extend the application of the CNN to membrane proteins. The CNN, which was trained by hydration structure on hydrophobic surfaces (Fig. 7), unfortunately provides the hydration distributions over the transmembrane regions of membrane proteins. To avoid this incompleteness, we developed the present method by combining the new CNN with the previously developed knowledge-based hydration prediction algorithm for hydrophilic surfaces of proteins [8,17,26]. The results and the effectiveness of the algorithm dedicated to membrane proteins will be reported. In addition, we are planning to open the CNN-based method for users all over the world through the server in the Protein Institute of Osaka University in near future.
Conclusion
In the previous study, we constructed a three-dimensional convolutional neural network to predict the probability distribution of hydration water molecules over protein surfaces and in protein cavities. Although the accuracy of the prediction was the best among the neural network-based hydration prediction, the positional accuracy remained inadequate in reproducing the hydration sites in the crystal structure models. In this study, we largely modified the architecture of the convolutional network and the algorithm for proposing hydration sites. In addition, the training data were subdivided into atomic classes based on their electrostatic properties. The constructed CNN provided hydration probability distribution more localized than the previous CNN. The positions of predicted hydration sites by the new CNN were closer to the crystal water sites than those by the previous CNN. The superiority of the new CNN against the previous was confirmed by inspecting the hydration structures in the cavities and on the surfaces of proteins. Based on the prediction, we discussed the information on the dynamics of hydration and the use of the new CNN in theoretical studies including molecular dynamics simulations.
Conflict of Interest
The authors declare no conflicts of interest.
Author Contributions
M.N. planned the study based on the previous works on hydration structure of proteins. K.S developed the neural network. M.N. wrote the manuscript and both authors have read and agreed to the published version of the manuscript.
Data Availability
The evidence data generated and/or analyzed during the current study are available from the corresponding author on reasonable request.
Acknowledgements
This study was supported by grants to MN from the Japan Science Promotion Society (Nos. jp851565, jp325150, jp11558086, jp13480214, jp17654084, jp19204042, jp22244054, jp24654140, jp16H02218, and jp21H01050), from the Ministry of Education, Culture, Sports, Science and Technology, Japan (Nos. jp0728023, jp08272236, jp09261243, jp10157202, jp15076210, jp20050030, jp22018027, jp23120525, jp25120725, jp15H01647, and jp17H05891) and from the JST SPRING (No. JPMJSP2123) to KS.
References
- [1] Ball, P. Water as an active constituent in cell biology. Chem. Rev. 108, 74–108 (2008). https://doi.org/10.1021/cr068037a
- [2] Nakasako, M., Odaka, M., Yohda, M., Dohmae, N., Takio, K., Kamiya, N., et al. Tertiary and quaternary structures of photoreactive Fe-type nitrile hydratase from Rhodococcus sp. N-771: Roles of hydration water molecules in stabilizing the structures and the structural origin for the substrate specificity of the enzyme. Biochemistry 38, 9887–9898 (1999). https://doi.org/10.1021/bi982753s
- [3] Nakasako, M., Oka, T., Mashumo, M., Takahashi, H., Shimada, I., Yamaguchi, Y., et al. Conformational dynamics of complementarity-determining region H3 of an anti-dansyl Fv fragment in the presence of its hapten. J. Mol. Biol. 351, 627–640 (2005). https://doi.org/10.1016/j.jmb.2005.06.018
- [4] Breiten, B., Lockett, M. R., Sherman, W., Fujita, S., Al-Sayah, M., Lange, H., et al. Water networks contribute to enthalpy/entropy compensation in protein-ligand binding. J. Am. Chem. Soc. 135, 15579–15584 (2013). https://doi.org/10.1021/ja4075776
- [5] Nakasako, M., Fujisawa, T., Adachi, S., Kudo, T., Higuchi, S. Large-scale domain movements and hydration structure changes in the active-site cleft in unligated glutamate dehydrogenase from Thermococcus profundus studied by cryogenic X-ray crystal structure analysis and small-angle X-ray scattering. Biochemistry 40, 3069–3079 (2001). https://doi.org/10.1021/bi002482x
- [6] Nakasako, M. Water-protein interactions from high-resolution protein crystallography. Phil. Trans. R. Soc. Lond. B. 359, 1191–1206 (2004). https://doi.org/10.1098/rstb.2004.1498
- [7] Oroguchi, T., Nakasako, M. Changes in hydration structure regulate collective motions of a multi-domain protein. Sci. Rep. 6, 26302 (2016). https://doi.org/10.1038/srep26302
- [8] Nakasako, M. Hydration structures of proteins: Atomic details. (Springer, Tokyo, 2021).https://doi.org/10.1007/978-4-431-56919-0
- [9] Rupley, J. A., Careri, G. Protein hydration and function. Adv. Protein Chem. 41, 37–172 (1991). https://doi.org/10.1016/S0065-3233(08)60197-7
- [10] Otting, G., Liepinsh, E., Wuthrich, K. Protein hydration in aqueous solution. Science 254, 974–980 (1991). https://doi.org/10.1126/science.1948083
- [11] Kossiakoff, A. A., Sintchak, M. D., Shpungin, J., Presta, L. G. Analysis of solvent structure in proteins using neutron D2O-H2O solvent maps: pattern of primary and secondary hydration of trypsin. Proteins: Struct. Funct. Genet. 12, 223–236 (1992). https://doi.org/10.1002/prot.340120303
- [12] Svergun, D. I., Richard, S., Koch, M. H. J., Sayers, Z., Kuprin, S., Zaccai, G. Protein hydration in solution: Experimental observation by x‐ray and neutron scattering. Proc. Natl. Acad. Sci. U.S.A. 95, 2267–2272 (1998). https://doi.org/10.1073/pnas.95.5.2267
- [13] Zhang, L., Kao, Y. T., Qiu, W., Wang, L., Zhong, D. Femtosecond studies of tryptophan fluorescence dynamics in proteins: Local solvation and electronic quenching. J. Phys. Chem. B. 110, 18097–18103 (2006). https://doi.org/10.1021/jp063025e
- [14] Nucci, N. V., Pometun, M. S., Wand, A. J. Site-resolved measurement of water-protein interactions by solution NMR. Nat. Struct. Mol. Biol. 18, 245–249 (2011). https://doi.org/10.1038/nsmb.1955
- [15] Fukuda, A., Oroguchi, T., Nakasako, M. Dipole–dipole interactions between tryptophan side chains and hydration water molecules dominate the observed dynamic stokes shift of lysozyme. BBA – Gen. Sub. 1864,129406 (2020). https://doi.org/10.1016/j.bbagen.2019.07.015
- [16] Nakasako, M. Large-scale networks of hydration water molecules around β-trypsin revealed by cryogenic X-ray crystal structure analyses. J. Mol. Biol. 289, 547–564 (1999). https://doi.org/10.1006/jmbi.1999.2795
- [17] Matsuoka, D., Nakasako, M. Probability distributions of hydration water molecules around polar protein atoms obtained by a database analysis. J. Phys. Chem. B. 113, 11274–11292 (2009). https://doi.org/10.1021/jp902459n
- [18] Merk, A., Bartesaghi, A., Banerjee, S., Falconieri, V., Rao, P., Davis, M. I., et al. Breaking cryo-EM resolution barriers to facilitate drug discovery. Cell 165, 1698–1707 (2016). https://doi.org/10.1016/j.cell.2016.05.040
- [19] Scheres, S. H. W., Gao, H., Valle, M., Herman, G. T., Eggermont, P. P. B., Frank, J., et al. Disentangling conformational states of macromolecules in 3D-EM through likelihood optimization. Nat. Methods 4, 27–29 (2007). https://doi.org/10.1038/nmeth992
- [20] Oide, M., Kato, T., Oroguchi, T., Nakasako, M. Energy landscape of domain motion in glutamate dehydrogenase deduced from cryo-electron microscopy. FEBS J. 287, 3472–3493 (2020). https://doi.org/10.1111/febs.15224
- [21] Beton, J. G., Cragnolini, T., Kaleel, M., Mulvaney, T., Sweeney, A., Toph, M. Integrating model simulation tools and cryo-electron microscopy. WIREs Comput. Mol. Sci., 13, e1642 (2022). https://doi.org/10.1002/wcms.1642
- [22] Roh, S. H., Shekhar, M., Pintilie, G., Chipot, C., Wilkens, S., Singharoy, A., et al. Cryo-EM and MD infer water-mediated proton transport and autoinhibition mechanisms of Vo complex. Sci. Adv. 6, eabb9605 (2020). https://doi.org/10.1126/sciadv.abb9605
- [23] Merzel, F., Smith, J. C. Is the first hydration shell of lysozyme of higher density than bulk water? Proc. Natl. Acad. Sci. U.S.A. 99, 5378–5383 (2002). https://doi.org/10.1073/pnas.082335099
- [24] Higo, J., Nakasako, M. Hydration structure of human lysozyme investigated by molecular dynamics simulation and cryogenic X-ray crystal structure analyses: On the correlation between crystal water sites, solvent density, and solvent dipole. J. Comp. Chem. 23, 1323–1336 (2002). https://doi.org/10.1002/jcc.10100
- [25] Yokomizo, T., Higo, J., Nakasako, M. Patterns and networks of hydrogen-bonds in the hydration structure of human lysozyme. Chem. Phys. Lett. 410, 31–35 (2005). https://doi.org/10.1016/j.cplett.2005.04.072
- [26] Oroguchi, T., Nakasako, M. Influences of lone-pair electrons on directionality of hydrogen bonds formed by hydrophilic amino acid side chains in molecular dynamics simulation. Sci. Rep. 7, 15859 (2017). https://doi.org/10.1038/s41598-017-16203-w
- [27] Imai, T, Hiraoka, R., Kovalenko, A., Hirata, F. Locating missing water molecules in protein cavities by the three-dimensional interaction site model theory of molecular solvation. Proteins 66, 804–813 (2007). https://doi.org/10.1002/prot.21311
- [28] Hikiri, S., Hayashi, T., Inoue, M., Ekimoto, T., Ikeguchi, M., Kinoshita, M. An accurate and rapid method for calculating hydration free energies of a variety of solutes including proteins. J. Chem. Phys. 150, 175101 (2019). https://doi.org/10.1063/1.5093110
- [29] Matsuoka, D., Nakasako, M. Prediction of hydration structures around hydrophilic surfaces of proteins by using the empirical hydration distribution functions from a database analysis. J. Phys. Chem. B. 114, 4652–4663 (2010). https://doi.org/10.1021/jp9100224
- [30] Matsuoka, D., Nakasako, M. Application of empirical hydration distribution functions around polar atoms for assessing hydration structures of proteins. Chem. Phys. 419, 59–64 (2013). https://doi.org/10.1016/j.chemphys.2012.12.040
- [31] Huang, P., Xing, H., Zou, X., Han, Q., Liu, K., Sun, X., et al. Accurate prediction of hydration sites of proteins using energy model with atom embedding. Front. Mol. Biosci. 8, 756075 (2021). https://doi.org/10.3389/fmolb.2021.756075
- [32] Park, S., Seok, C. GalaxyWater-CNN: Prediction of water positions on the protein structure by a 3D-convolutional neural network. J. Chem. Inf. Model. 62, 3157–3168 (2022). https://doi.org/10.1021/acs.jcim.2c00306
- [33] Ghanbarpour, A., Mahmoud, A. H., Lill, M. A. Instantaneous generation of protein hydration properties from static structures. Comm. Chem. 3, 188 (2020). https://doi.org/10.1038/s42004-020-00435-5
- [34] Sato, K., Oide, M., Nakasako, M. Prediction of hydrophilic and hydrophobic hydration structure of protein by neural network optimized using experimental data. Sci. Rep. 13, 2183 (2023). https://doi.org/10.1038/s41598-023-29442-x
- [35] Berman, H. M., Westbrook, J., Feng, Z., Gilliland, G., Bhat, T. N., Weissig, H., et al. The protein data bank. Nucleic Acids Res. 28, 235–242 (2000). https://doi.org/10.1093/nar/28.1.235
- [36] Steinegger, M., Söding, J. MMseqs2 enables sensitive protein sequence searching for the analysis of massive data sets. Nat. Biotechnol. 35, 1026–1028 (2017). https://doi.org/10.1038/nbt.3988
- [37] Nagashima, S., Nakasako, M., Dohmae, N., Tsujimura, M., Takio, K., Odaka, M., et al. Novel non-heme iron center of nitrile hydratase with a claw setting of oxygen atoms. Nat. Struct. Biol. 5, 347–351 (1998). https://doi.org/10.1038/nsb0598-347
- [38] Lee, B., Richards, F. M. The interpretation of protein structures: Estimation of static accessibility. J. Mol. Biol. 55, 379–400 (1971). https://doi.org/10.1016/0022-2836(71)90324-X
- [39] Ji, S., Xu, W., Yang, M., Yu, K. 3D convolutional neural networks for human action recognition. IEEE Trans. Pattern Anal. Mach. Intell. 35, 221–231 (2013). https://doi.org/10.1109/TPAMI.2012.59
- [40] Jarrett, K., Kavukcuoglu, K., Ranzato, M., LeCun, Y. What is the best multi-stage architecture for object recognition? In Proceedings of the IEEE International Conference on Computer Vision. IEEE, pp. 2146–2153 (2009). https://doi.org/10.1109/ICCV.2009.5459469
- [41] Srivastava, N., Hinton, G., Krizhevsky, A., Sutskever, I., Salakhutdinov, R. Dropuout: A simple way to prevent neural networks from overfitting. J. Mach. Learn. Res. 15, 1929–1958 (2014). https://dl.acm.org/doi/10.5555/2627435.2670313
- [42] Glorot, X., Bordes, A., Bengio, Y. Deep sparse rectifier neural networks. Proc. Mach. Learn. Res. 15, 315–323 (2011).
- [43] Kingma, D. P., Ba, J. L. Adam: A method for stochastic optimization. In 3rd International Conference on Learning Representations, ICLR 2015, 1–15 (2015).
- [44] Nakasako, M. Large-scale networks of hydration water molecules around proteins investigated by cryogenic X-ray crystallography. Cell. Mol. Biol. 47, 767–790 (2001).
- [45] Cheng, A., Henderson, R., Mastronarde, D., Ludtke, S. J., Schoenmakers, R. H. M., Short, J., et al. MRC2014: Extensions to the MRC format header for electron cryo-microscopy and tomography. J. Struct. Biol. 192, 146–150 (2015). https://doi.org/10.1016/j.jsb.2015.04.002
- [46] Carugo, O. Statistical survey of the buried waters in the Protein Data Bank. Amino Acids 48, 193–202 (2016). https://doi.org/10.1007/s00726-015-2064-4
- [47] DeLano, W. L. The PyMOL Molecular Graphics System, version 1.5.0.1, Schrödinger, LLC, New York.
- [48] Gonen, T., Walz, T. The structure of aquaporins. Quat. Rev. Biophys. 39, 361–396 (2006). https://doi.org/10.1017/S0033583506004458
- [49] Törnroth-Horsefield, S., Wang, Y., Hedfalk, K., Johanson, U., Karlsson, M., Tajkhorshid, E., et al. Structural mechanism of plant aquaporin gating. Nature 439, 688–694 (2006). https://doi.org/10.1038/nature04316
- [50] Teeter, M. M. Water structure of a hydrophobic protein at atomic resolution: Pentagon rings of water molecules in crystals of crambin. Proc. Natl. Acad. Sci. U.S.A. 81, 6014–6018 (1984). https://doi.org/10.1073/pnas.81.19.6014
- [51] Jeffrey, G. A. Hydrate Inclusion Compounds. J. Incl. Phenom. 1, 211–222 (1984). https://doi.org/10.1007/BF00656757
- [52] Walshaw, J., Goodfellow, J. M. Distribution of solvent molecules around apolar side-chains in protein crystals. J. Mol. Biol. 231, 392–414 (1993). https://doi.org/10.1006/jmbi.1993.1290
- [53] Nakasako, M., Motoyama, T., Kurahashi, Y., Yamaguchi, I. Cryogenic X-ray crystal structure analysis for the complex of scytalone dehydratase of a rice blast fungus and its tight-binding inhibitor, carpropamid: The structural basis of tight-binding inhibition. Biochemistry 37, 9931–9939 (1998). https://doi.org/10.1021/bi980321b
- [54] Motoyama, T., Nakasako, M., Yamaguchi, I. Crystallization of scytalone dehydratase F162A mutant in the unligated state and a preliminary X-ray diffraction study at 37 K. Acta Crystallogr. D Biol. Crystallogr. 58, 148–150 (2002). https://doi.org/10.1107/S0907444901017371
- [55] Kawama, K., Fukushima, Y., Ikeguchi, M., Ohta, M., Yoshidome, T. gr Predictor: A deep learning model for predicting the hydration structures around proteins. J. Chem. Inform. Model. 62, 4460–4473 (2022). https://doi.org/10.1021/acs.jcim.2c00987
- [56] Baek, M., DiMaio, F., Anishchenko, I., Dauparas, J., Ovchinnikov, S., Lee, G. R., et al. Accurate prediction of protein structures and interactions using a three-track neural network. Science 373, 871–876 (2021). https://doi.org/10.1126/science.abj8754
- [57] Huddy, T. F., Hsia, Y., Kibler, R. D., Xu, J., Bethel, N., Nagarajan, D., et al. Blueprinting extendable nanomaterials with standardized protein blocks. Nature 627, 898–904 (2024). https://doi.org/10.1038/s41586-024-07188-4
- [58] Senior, A. W., Evans, R., Jumper, J., Kirkpatrick, J., Sifre, L., Green, T., et al. Improved protein structure prediction using potentials from deep learning. Nature 577, 706–710 (2020). https://doi.org/10.1038/s41586-019-1923-7
- [59] Levitt, D. G., Banaszak, L. J. POCKET: A computer graphies method for identifying and displaying protein cavities and their surrounding amino acids. J. Mol. Graph. Model. 10, 229–234 (1992). https://doi.org/10.1016/0263-7855(92)80074-N
- [60] Chatterjee, A., Walters, R., Shafi, Z., Ahmed, O. S., Sebek, M., Gysi, D., et al. Improving the generalizability of protein-ligand binding predictions with AI-Bind. Nat. Commun. 14, 1989 (2023). https://doi.org/10.1038/s41467-023-37572-z
- [61] Pavlovicz, R. E., Park, H., DiMaio, F. Efficient consideration of coordinated water molecules improves computational protein-protein and protein-ligand docking discrimination. PLoS Comput. Biol. 16, e1008103 (2020). https://doi.org/10.1371/journal.pcbi.1008103
- [62] Samways, M. L., Taylor, R. D., Bruce Macdonald, H. E., Essex, J. W. Water molecules at protein-drug interfaces: Computational prediction and analysis methods. Chem. Soc. Rev. 50, 9104–9120 (2021). https://doi.org/10.1039/D0CS00151A
- [63] Hirano, Y., Takeda, K., Miki, K. Charge-density analysis of an iron-sulfur protein at an ultra-high resolution of 0.48 Å. Nature 534, 281–284 (2016). https://doi.org/10.1038/nature18001
- [64] Maki-Yonekura, S., Kawakami, K., Hamaguchi, T., Takaba, K., Yonekura, K. Measurement of charges and chemical bonding in a cryo-EM structure. Comm. Chem. 6, 98 (2023). https://doi.org/10.1038/s42004-023-00900-x
- [65] O’Dell, W. B., Bodenheimer, A. M., Meilleur, F. Neutron protein crystallography: A complementary tool for locating hydrogens in proteins. Arch. Biochem. Biophys. 602, 48–60 (2016). https://doi.org/10.1016/j.abb.2015.11.033
- [66] Chatake, T., Ostermann, A., Kurihara, K., Parak, F. G., Niimura, N. Hydration in proteins observed by high-resolution neutron crystallography. Proteins Struct. Funct. Genet. 50, 516–523 (2003). https://doi.org/10.1002/prot.10303
- [67] Ramos, J., Laux, V., Mason, S. A., Lemée, M.-H., Bowler, M. W., Diederichs, K., et al. Structure and dynamics of the active site of hen egg-white lysozyme from atomic resolution neutron crystallography. Structure 33, 136–148 (2025). https://doi.org/10.1016/j.str.2024.10.030
- [68] Chatake, T., Tanaka, I., Kusakac, K., Fujiwara, S. Protonation states of hen egg-white lysozyme observed using D/H contrast neutron crystallography. Acta Crystallogr. D78, 770–778 (2022). https://doi.org/10.1107/S2059798322004521


