MATERIALS AND METHODS
Reagents
The primary antibodies used were as follows; SMN [mouse, BD Biosciences, Franklin Lakes, NJ, USA, Cat# 610647, 1:10,000 for immunoblotting (IB)], TFEB [rabbit, Proteintech, Rosemont, IL, USA, Cat# 13372-1-AP, 1:5,000 for IB, 1:200 for immunofluorescence (IF)], β-actin (mouse, Sigma-Aldrich, St. Louis, MO, USA, Cat# A2228, 1:100,000 for IB), Lamp1 (rat, Abcam, Cambridge, UK, Cat# 1b25245, 1:10,000 for IB, 1:400 for IF), β-Tubulin III (rabbit, GeneTex Inc., Irvine, CA, USA, Cat# GTX130245, 1:2,000 for IF), cathepsin D (goat, R&D Systems, Minneapolis, MN, USA, Cat# AF1029-SP, 1:5,000 for IB), microtubule-associated protein light chain 3 (LC3B, rabbit, GeneTex, Cat# GTX127375, 1:10,000 for IB), p-mTOR (Ser 2448, rabbit, Cell Signaling Technology, Danvers, MA, USA, Cat# 2971S, 1:10,000 for IB), mTOR (rabbit, Cell Signaling Technology, Cat# 2972S, 1:10,000 for IB), p-p70S6K (rabbit, Cell Signaling Technology, Cat# 9234S, 1:500 for IB), p70S6K (rabbit, Cell Signaling Technology, Cat# 9202S, 1:1,000 for IB), p-S6RP (rabbit, Cell Signaling Technology, Cat# 4856S, 1:1,000 for IB), S6RP (rabbit, Cell Signaling Technology, Cat# 2317S, 1:2,000 for IB), green fluorescent protein (GFP, rabbit, MBL Life Science, Aichi, Japan,, 1:50,000 for IB).
Alexa-dye conjugated secondary antibodies were purchased from Thermo Fisher Scientific (Waltham, MA, USA, 1:400 for IF). Horseradish peroxidase (HRP)-conjugated secondary antibodies were purchased from Thermo Fisher Scientific (1:10,000 for IB). Small interfering RNAs (siRNAs) targeting Smn (siSMN#1, Cat# Smn1MSS209213; siSMN#2, Cat# Smn1MSS209214), Tfeb (siTFEB#1, Cat# TfebMSS238271; siTFEB#2, Cat# TfebMSS238272), and a negative control (Cat# 12935300), were purchased from Thermo Fisher Scientific. pEGFP-N1-TFEB was purchased from Addgene [Watertown, MA, USA, Addgene plasmid# 38119, gifted by Shawn Ferguson12)]. pAcGFP-C1 vector was purchased from Takara Bio (Shiga, Japan, Cat# CLN632470).
Cell Culture and Transfection
Murine motoneuron-like cells (NSC-34) were purchased from Cosmo Bio Co., Ltd. (Tokyo, Japan) and maintained in Dulbecco’s modified Eagle’s medium (DMEM, Nacalai Tesque, Kyoto, Japan), containing 10% fetal bovine serum (FBS, Valeant, Costa Mesa, CA), as described previously.18) Lipofectamine RNAiMAX and Lipofectamine 2000 were used as transfection reagents, according to the manufacturer’s instructions (Thermo Fisher Scientific). To induce differentiation, one day after seeding into 6-well plates, at 20,000 cells per wells, NSC-34 cells were incubated with DMEM, containing 50 µM all-trans retinoic acid (Sigma-Aldrich, Cat# R2625) and 2% horse serum (Sigma-Aldrich, Cat# H1138), for 3 days, in a humidified atmosphere of 95% air and 5% CO2 at 37°C. The percentage of neurite-bearing cells reached to 57.7 ± 9.3% on the day 3.
Cell Lysis and Immunoblotting
Cell lysis and immunoblotting were performed, as previously described.19) Briefly, cells cultured in a 12-well plate were rinsed with ice-cold PBS and lysed in radioimmunoprecipitation assay (RIPA) buffer (Sigma-Aldrich, R0278), containing protease inhibitor cocktail, and phosphatase inhibitor cocktail 2 and 3 (Sigma-Aldrich), and then centrifuged at 12,000 × g, for 20 min at 4°C. The supernatants were collected as cell lysates and boiled with sample buffer solution (FUJIFILM-Wako, Osaka, Japan), for 5 min. Protein extracts were separated by sodium dodecyl sulfate-polyacrylamide gel electrophoresis (SDS-PAGE), in a 5%–20% gradient gel (SuperSep Ace, FUJIFILM-Wako), and transferred to a polyvinylidene difluoride membrane (Immobilon-P, Millipore, Bedford, MA, USA). After blocking with Blocking One-P (Nacalai Tesque), the membranes were incubated with primary antibody, in Can Get Signal Solution-1 (Toyobo, Shiga, Japan), overnight at 4°C, with gentle agitation. After three washes with Tris-buffered saline (TBS), containing 0.05% Tween 20, the membranes were incubated with an HRP-conjugated secondary antibody, in Can Get Signal Solution-2 (Toyobo), for 1 h at room temperature. After three washes with TBS, containing 0.05% Tween 20, the chemiluminescent signal was visualized with ImmunoStar LD (Fujifilm-Wako) and then detected using an Amersham Imager 680 (GE Lifescience, Chicago, IL, USA). The band intensity was analyzed by Amersham Imager 680 Analysis Software (GE Lifescience).
Quantitative RT-PCR
Quantitative reverse transcriptase-polymerase chain reaction (RT-PCR) was performed, as described previously.20) In brief, total RNA was purified from NSC-34 cells, grown in a 12-well plate (Corning), using NucleoSpin RNA (Takara Bio), and subjected to reverse transcription to generate a cDNA library, using PrimeScript RT reagent Kit (Takara Bio). Quantitative RT-PCR was performed on a Thermal Cycler Dice Real-Time System III (Takara Bio), using TB Green Premix Ex Taq II (Takara Bio). The primer pairs used in this study were as follows; Gapdh-F, 5’-AACTTTGGCATTGTGGAAGG-3'; Gapdh-R 5’-ACACATTGGGGGTAGGAACA-3'; Tfeb-F, 5’-TCAGAAGCGAGAGCTAACAGAT-3'; Tfeb-R 5’-TGTGATTGTCTTTCTTCTGCCG-3'; Lamp1-F, 5’- CAGCACTCTTTGAGGTGAAAAAC-3'; Lamp1-R 5’-ACGATCTGAGAACCATTCGCA-3'; Ctsd-F, 5’- GCTTCCGGTCTTTGACAACCT-3'; and Ctsd-R, 5’- CACCAAGCATTAGTTCTCCTCC-3'. CT values measured Thermal Cycler Dice Real-Time System software (Takara Bio) by were normalized against Gapdh and expressed as the fold-change in gene expression.
Immunostaining
Immunostaining was performed as previously described, with minor modifications.21) Briefly, cells were grown on 12-mm glass coverslips (No. 1-S, Matsunami Glass Industry, Osaka, Japan), coated with 0.2% gelatin, from porcine skin (Sigma Aldrich, G2500), and fixed with 4% paraformaldehyde (Electron Microscopy Sciences, Fort Washington, PA) in PBS-C/M [phosphate-buffered saline (PBS), containing 0.2 mM CaCl2, 2 mM MgCl2], for 10 min at room temperature, quenched with 50 mM NH4Cl, for 10 min, followed by 30 min in blocking buffer [PBS-C/M containing 0.5% bovine serum albumin (BSA), 0.5% saponin, 0.2 mg/ml sodium azide]. The samples were incubated with primary antibodies in PBS-C/M, for 1 h. After three washes with PBS-C/M, cells were stained with secondary antibodies in PBS-C/M, containing 8.1 µM Hoechst 33342 (Thermo Fisher Scientific), for 30 min. For F-actin staining, the samples were stained with Phalloidin-iFluor 594 (Cayman Chemical, Ann Arbor, MI, USA, 1:2,000) together with the secondary antibody. After three washes with PBS-C/M, the coverslips were mounted with ProLong Gold Antifade reagent (Thermo Fisher Scientific). Images were acquired, using either a 40× or 100× objective lens, on a Zeiss LSM700 microscope (Carl Zeiss, Germany). Images were edited using ImageJ (National Institutes of Health) or Adobe Photoshop CC2019 (Adobe), for presentation purposes. To analyze TFEB foci-positive cell ratios, images were analyzed by a third person, in a blinded fashion.
DQ-Red BSA Lysosomal Activity Assay
The DQ-Red BSA (Thermo Fisher Scientific) assay was performed, according to the manufacturer's instructions. Briefly, cells were incubated with 10 µg/ml DQ-Red BSA, for 3 h at 37°C. Hoechst 33342 solution was added, 15 min before recording, to a final concentration of 8.1 µM. For live-cell imaging, the medium was changed to Live Cell Imaging Solution (LCIS, Thermo Fisher Scientific), containing 5.5 mM glucose and 1% FBS, and then images were acquired, using a 10× objective lens on a Lionheart FX Automated Microscope (Bio Tek Instruments, Winooski, VT, USA). The obtained images were analyzed by Gen5 software (Bio Tek Instruments).
Animal Experiments
SMNΔ7 mice (mSmn-/-, SMN2+/+, SMNΔ7+/+) were purchased from Jackson Laboratory (Bar Harbor, ME, USA, Stock Number 005025) and maintained, as described previously.19) Lumbar spinal cords, from either SMNΔ7 mice or their wild-type (WT) counterparts (mSmn+/+, SMN2+/+, SMNΔ7+/+), were harvested at postnatal day 11 and homogenized, using Physcotron (Microtec Co., Chiba, Japan) in RIPA buffer, containing protease inhibitor cocktail, and phosphatase inhibitor cocktail 2 and 3 (Sigma-Aldrich), then centrifuged, at 12,000 × g, for 20 min at 4°C. The supernatants were examined by immunoblotting, as tissue lysates. All animal manipulations were performed in accordance with the animal care guidelines issued by the National Institutes of Health. All experiments were approved by the Institutional Animal Care and Use Committee of Gifu Pharmaceutical University (Approval No. 2019-078, 2019-190).
Statistical Analysis
All data are presented as the mean ± standard error of the mean (S.E.M.). Statistical analyses were performed by Student’s t-tests, using SPSS Statistical Software (IBM, Armonk, NY, USA).
RESULTS
NSC-34 cells, a motoneuron-like hybrid cell line, have been used as an in vitro model because of their physiological properties.22) To silence SMN expression in NSC-34 cells, two siRNAs, targeting different regions of Smn, were validated by immunoblotting (Fig. S1A and B). The expression of SMN was significantly decreased, 24 h after transfection, and reduced expression persisted until 72 h after transfection (Fig. 1A and B). Coincidentally, we found that TFEB expression also decreased 48 h and 72 h after transfection (Fig. 1A and C). The mRNA levels of Tfeb also decreased at the 48 h time point (Fig. 1D), suggesting that the transcription of TFEB was suppressed by SMN KD. At steady state, TFEB exists in the cytosol, and activated TFEB is shuttled into the nucleus, to promote lysosomal gene expression.11) In control NSC-34 cells, endogenous TFEB staining appeared as bright cytosolic foci, in addition to signals in the nuclei (Fig. 1E). Consistent with the immunoblotting and quantitative RT-PCR results, TFEB-positive foci disappeared in SMN-depleted cells (Fig. 1E and F). These foci were diminished following the transfection of siRNA targeting TFEB expression (Fig. S2A-C), suggesting that these signals were neither background nor artifacts.

All-trans retinoic acids can induce the differentiation of NSC-34 cells.23) We performed immunostaining against the lysosomal marker Lamp1, in differentiated NSC-34 motoneurons (Fig. 2A) because TFEB is important for lysosomal biogenesis and distribution. Differentiated NSC-34 cells displayed long processes, which could be labeled by the neuronal marker β-tubulin III (Fig. 2B–D). The membranes of the neurite branches were highlighted by F-actin staining, and the distal regions of the neurites were enriched with Lamp1-positive granular structures (Fig. 2B, asterisks). Interestingly, these structures disappeared in both SMN KD and TFEB KD cells (Fig. 2C and D). Instead, we found that lysosomes became swollen and enlarged, and these irregularly shaped lysosomes accumulated in the cell bodies (soma) of KD cells (Fig. 2C and D). The shapes of lysosomes have been associated with acidity and degradation.24) Therefore, these results indicate that lysosomal function was disrupted by SMN KD.

TFEB regulates lysosome-related gene expression.11) As expected, the mRNA levels of both Lamp1 and cathepsin D (CTSD) were reduced in SMN KD cells (Fig. 3A). Consistently, the protein levels of Lamp1 and CTSD were reduced at the 72 h time point (Fig. 3B–D). Along with lysosomes, TFEB also regulates autophagic gene expression and the induction of autophagy.25) Immunoblotting for LC3 revealed that SMN KD increased autophagic flux (Fig. 3B and E). To investigate the lysosomal activity, we performed the DQ-Red BSA assay. SMN KD cells showed reduced DQ-Red BSA fluorescence intensity compared with that of control cells (Figs. 3F and S3A). Taken together, these results indicated that SMN expression is essential for maintaining lysosome level, its degradation and autophagic activity in motoneurons.

To exclude the possibility that SMN KD directly suppresses the expression of lysosome-related genes, we performed a rescue experiment, in which we transiently expressed exogenous TFEB in SMN-depleted cells (Fig. 4A). Indeed, the exogenous expression of TFEB ameliorated the LC3 ii/i ratio (Fig. 4B and C) and increased the expression of Lamp1 (Fig. 4B and D) but did not affect the expression of SMN, suggesting that TFEB is downstream of SMN. Consequently, the lysosomal and autophagy defects observed in SMN KD cells were likely mediated by decreased TFEB expression.

Lysosomes play a key role in the mTOR signaling pathway.14) Axonal translation mTOR activity has been reported to be inhibited by miR-183 in SMN KD primary neurons.26) Consistent with previous reports, SMN KD decreased mTOR phosphorylation (Fig. 5A and B). In addition to mTOR, the phosphorylation of both p70S6K and S6RP was also reduced under the same conditions (Fig. 5C and D). Although SMN KD causes apoptosis in NSC-34 cells,27) defects in the mTOR signaling pathway would also contribute to the loss of motoneurons in SMA.

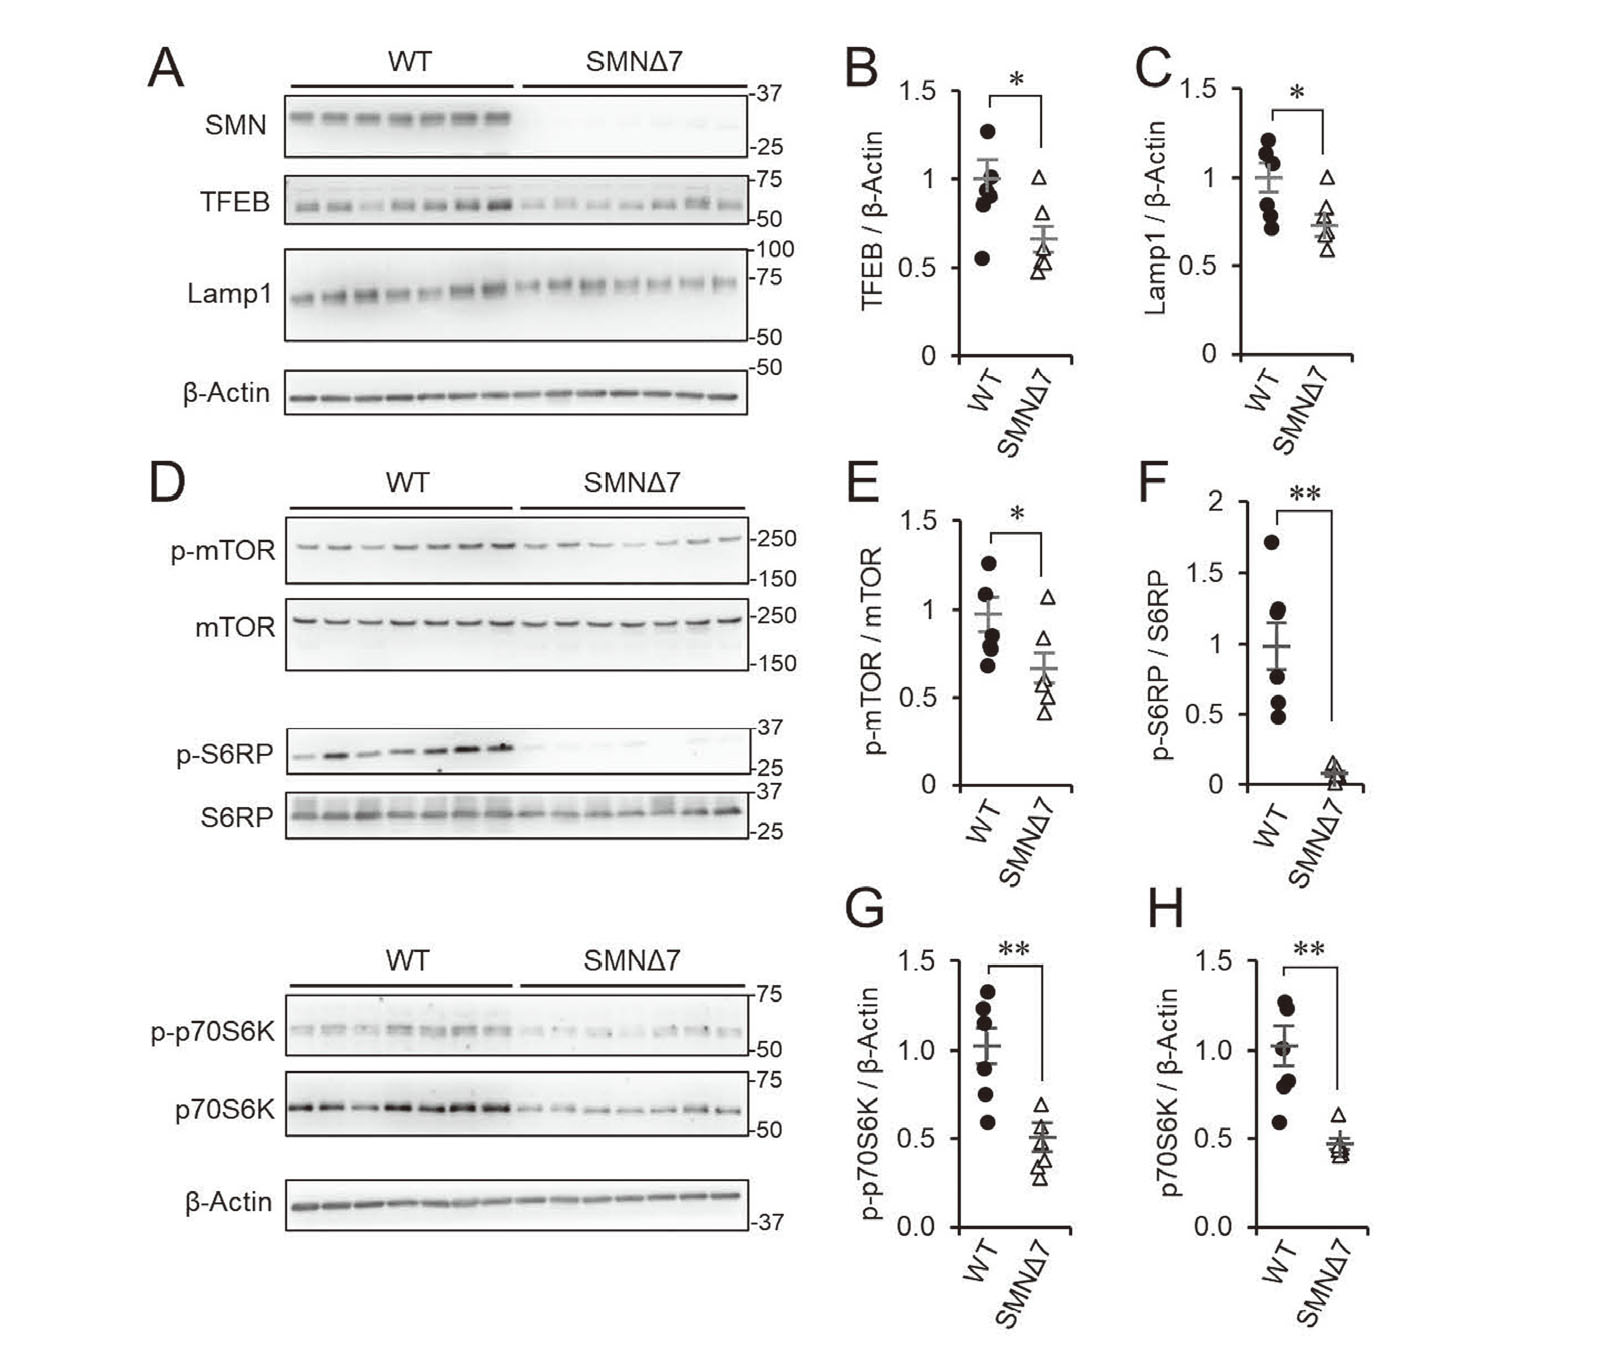
To further investigate motoneurons in the spinal cord, we used SMNΔ7 mice (mSmn-/-, SMN2+/+, SMNΔ7+/+), as an SMA animal model.19,28) The lumbar spinal cords were harvested at postnatal day 11. TFEB and Lamp1 levels were significantly decreased in SMNΔ7 mice (Fig. 6A-C), compared with their counterparts. As well as mTOR, the phosphorylation of S6RP was drastically reduced in SMNΔ7 mice (Fig. 6D–F). Interestingly, in addition to the reduced phosphorylated form, the total level of S6K was decreased in SMNΔ7 mice (Fig. 6 D–F). In summary, SMN plays a crucial role in the expression of lysosome-related genes and mTOR signaling pathways in spinal cords, in vivo.
DISCUSSION
In the present study, we investigated the functional interaction between SMN and TFEB, in motoneurons. SMN KD reduced TFEB expression, at the transcriptional level (Fig. 1). In addition to a reduction in lysosome-related gene expression, the lysosome dysfunction and increased autophagy influx were observed in SMN-depleted cells (Fig. 3). Consistent with the results obtained from NSC-34 cells, defects in the TFEB and mTOR pathway were detected in the lumbar spinal cords of SMA model mice (Fig. 6). The decline in lysosomes and autophagy was rescued by exogenously expressed TFEB (Fig. 4). Therefore, the reduced intracellular degradation caused by SMN depletion is mediated by the loss of TFEB expression. Previous report showed that caspase-3 activity significantly increased at 72 h after post transfection of SMN siRNA in NSC-34 cells 27), whereas we found that TFEB level was already declined at an earlier time point 48 h, suggesting that TFEB down regulation can occur prior to apoptosis. Further study remains necessary to clarify the molecular mechanisms involved in the SMN regulation of TFEB expression and the correlation between TFEB mediated pathway and motoneuron loss.
Intriguingly, we found that the distribution and morphology of lysosomes were altered in SMN-depleted cells (Fig. 2). The endocytic pathway and the degradation of endocytosed components are essential for neurotransmitter secretion and the maintenance of synaptic plasticity.29) Axonal lysosomes and macroautophagy have been reported to play important roles in axonal development.30,31) Lysosomal activity is also involved in trans-synaptic communications at the NMJ.32) Motoneurons have long axons; thus, the delivery of lysosomes might be crucial for their survival. TFEB has been associated with the intracellular distribution of lysosomes, by regulating their delivery.33) Understanding the molecular mechanism associated with the axonal delivery of lysosomes might be a key to understanding the sensitivity of motoneurons to the loss of SMN expression.
On the membrane of lysosomes, mTORC1 works as a sensor for metabolic status, regulating protein and lipid synthesis for cell survival.14) The local axonal translation in motoneurons is regulated by mTOR signaling.15,26) Consistent with a previous report, SMN depletion in NSC-34 cells also resulted in decreased mTOR phosphorylation and its downstream effectors, p70S6K and S6RP (Fig. 5), suggesting that the deactivation of mTOR might be associated with motoneuron loss in SMA. In addition, axon outgrowth has been reported to be influenced by the PI3K/mTOR pathway,12) indicating that mTOR dysfunction in SMA might cause the deterioration of the NMJ. mTOR regulates the activation and nuclear translocation of TFEB.12,13) In the present study, whether the loss of TFEB following SMN KD occurs in an mTOR signaling-dependent manner was not determined. Further investigations are necessary to reveal their causative relationships and roles in motoneurons and SMA pathophysiology.
Several treatments have been approved for SMA. Nusinerisen (SpinrazaTM, Biogen) is an antisense oligo that promotes the production of mature SMN2, including exon 7, by masking the regulatory sequences required for exon 7 splicing, which, consequently, increases the levels of functional SMN protein.34) Onasemnogene Abeparvovec-xioi (Zolgensma™, Novartis), also known as AVXS-101, is an Adeno-associated virus 9 that codes the SMN protein, for the replacement of the target gene.35) Although these treatments remediate the defects associated with SMN deficiency, by enhancing SMN levels in the long term, developing new treatments that prevent or reduce neuronal loss would be beneficial for SMA patients. SMA patient-derived pluripotent stem cell-derived cells are useful tools for chemical screening, and some antioxidants have been identified that display protective effects against motoneuron loss.36,37) The aberrant deposition of 4-hydroxy-2-nonenal in spinal motoneurons of SMA patients has been reported,38) and differentiated NSC-34 cells are sensitive to ferroptosis,39) an iron-dependent programmed cell death pathway,40) suggesting that motoneurons are relatively sensitive to oxidative stress. Lysosomes and autophagy are responsible for the clearance of lipid peroxides.41) Motoneurons may display characteristic features that rely on these degradative organelles to reduce oxidative stress, suggesting that chemicals capable of decreasing oxidative stress or increasing the degradation of oxidative-stress-associated molecules may represent drug candidates for SMA.
In conclusion, we demonstrated that SMN regulates the gene expression of TFEB, and consequently, the functions of lysosomes and autophagy. These findings reveal the novel roles of SMN and TFEB during lysosome homeostasis and motoneuron survival.