Abstract
Adolescent blood pressure (BP) is associated with the prevalence of hypertension in later life, and anthropometric measures have been shown to be useful indicators for predicting hypertension. However, little is known about their associations in Japanese young adults. Here, this study aimed to analyze the association between BP and anthropometric measures in Japanese university students. The participants of this cross-sectional study included 17,512 university students (12,559 males and 4,953 females) in Japan between 2011 and 2019. Abnormal BP (ABP) was defined as systolic/diastolic BP above 120 and/or 80 mmHg. ABP was seen in 59.2% of males and 16.3% of females, with the proportion in male students increasing over the nine year study period. Areas under receiver operating characteristics curves analysis showed that the top three predictors (and their cut-off points) of ABP in descending order were body mass index (20.5 kg/m2), waist circumference (74.1 cm) and chest circumference (85.4 cm) in males, and body mass index (19.8 kg/m2), body fat rate (28.5%) and chest circumference (82.4 cm) in females. The odds ratio was 2.69 (2.45‒2.94) in males and 2.40 (1.96‒2.95) in females when all three measurements were higher than their cut-off points. The incidence of ABP has increased in male university students, suggesting the need for interventions for appropriate BP control. This study suggests that anthropometric measures in combination with body mass index might be useful for this intervention in Japanese university students.
INTRODUCTION
Blood pressure (BP) above 120/80 mmHg increases the risk of morbidity due to cardiovascular and chronic kidney diseases,1) and these risks increase with elevation of BP. According to the National Health and Nutrition Survey (NHNS) 2019,2) the prevalence of hypertension in the 40‒74 year age range was 58.1% in males and 38.1% in females. In Japanese university students, this prevalence was 3.2‒3.7% for males and 0.2‒0.4% for females, respectively.3) The prevalence of hypertension increases with aging, and childhood or adolescent high BP is associated with the prevalence of hypertension in later life.4,5) Nevertheless, Japanese university students have few opportunities to understand their BP because its measurement is not required in medical checkups. Intervention for lifestyle habits should begin in the first year of university because their lifestyles are established during this critical period. Although it is necessary to educate university students regarding hypertension, data on the BP of Japanese university students is limited.
Several anthropometric measures have been shown to be associated with BP. These include body mass index (BMI), chest circumference (CC), waist circumference (WC), hip circumference (HC), WC to HC ratio (WHR), and WC to height ratio (WHtR). Recently, new anthropometric indices have been suggested for evaluation of BP, such as body roundness index (BRI), a body shape index (ABSI), body adiposity index (BAI), abdominal volume index (AVI), and conicity index (CI). Hypertension was previously reported to be associated with BMI and WC in a Lithuanian adolescent population aged 12–15 years6) and in older Greeks aged > 55 years.7) Adegoke et al.8) reported that hypertension is associated with WC, WHtR, BRI and AVI in Nigerians aged ≥ 16 years. Dzudie et al.9) also reported strong correlations between BP and WC, WHtR and BRI in Cameroonians. In Jordanian school children, BMI z-score and WC were found to be predictors of BP.10) Anthropometric measures and body indices have thus been used to evaluate BP in various races and ages. Meanwhile, in Japanese university students, an increase in BMI was shown to be associated with hypertension, and the group with a greater degree of obesity among freshman to fourth-year students had a higher incidence of hypertension.11) However, in Japan, the correlations between the BP of university students and anthropometric measures and body indices have not been adequately evaluated.
Although previous studies have examined the association between hypertension and anthropometric measures in the general population, little is known about the relationships between BP and anthropometric measures and body indices in university students. This information would be useful for the prevention of hypertension in later life. In this study, we investigated the relationship between BP and anthropometric measures and body indices in Japanese university students.
METHODS
Population
A total of 17,512 university students (12,559 males and 4,953 females) at K university, Higashi-Osaka city, Japan, between 2011 and 2019 were eligible for participation in this study after excluding subjects for whom data on sex, age, BP and anthropometric measures were missing or unclear in a questionnaire survey conducted during a lecture at the university. The valid response rate was 50.7% in males and 49.3% in females, respectively.
BP, Anthropometric Measures, and Body Indices
Systolic and diastolic BPs (SBP or DBP) were measured at heart level after 5 mins of rest in sitting position, using an automatic electronic sphygmomanometer (HEM-1010; Omron Dalian Co., LTD., Kyoto, Japan). According to The Japanese Society of Hypertension (JSH) Guidelines,1) BP was classified as follows: SBP < 120 and DBP < 80, normal BP (NBP); SBP 120–129 and DBP < 80, high normal BP (HNBP); SBP 130–139 and/or DBP 80–89, elevated BP (EBP); SBP ≥ 140 and/or DBP ≥ 90, hypertension. In this study, the combined group of HNBP, EBP and hypertension was defined as abnormal BP (ABP).
At the same time as BP measurements, anthropometric parameters (height, weight, CC, WC, and HC) were measured to the nearest 0.1 cm or 0.1 kg in the standing position, with the subject wearing minimal clothing. The body fat rate (%BF) was measured using a dual-frequency body composition Meter (DC-320 or DC-430A; Tanita Co., Tokyo, Japan). CC was measured at the level of the nipples, WC was measured at the level of the umbilicus, and HC was measured at the widest part around the buttocks. BMI, WHR and WHtR were calculated using the following formulae.
Subjects were classified according to their BMI as: < 18.5 kg/m2, underweight; 18.5 ≤ to < 25.0 kg/m2, normal; and ≥ 25.0 kg/m2, obese. The body indices including BRI,12) ABSI,13) BAI,14) AVI,15) and CI16) were calculated using the following formula.
Statistical Analysis
Student’s t-test was performed to compare BP, anthropometric measurements and the body indices between males and females. Receiver operating characteristic (ROC) curve analysis was performed to assess the predictive performance of the anthropometric measurements and body indices for ABP by calculating the areas under curves (AUC). The sensitivity and specificity of each anthropometric measurement and body indices were also determined using ROC analysis. The maximum value of Youden’s index (sensitivity + specificity − 1) was considered as the optimal cut-off point for each anthropometric measurement and the body indices, and the participants were classified into high and low groups based on each cut-off point. The top three anthropometric measurements with the highest AUCs were combined to create eight new categories as: All, WC-CC, BMI-CC, BMI-WC, CC, WC, BMI and None in males; and All, %BF-CC, BMI-CC, BMI-%BF, CC, %BF, BMI and None in females. Classification into these eight categories was based on whether the subjects were included in the high or low groups for each anthropometric measurement. For example, the All group included subjects in whom BMI, WC (%BF in females) and CC were all elevated, and the None group was defined as those in whom none of the parameters of BMI, WC (%BF in females) and CC was elevated. Multivariate logistic regression analysis was performed using these categories with the None group as the reference group. Statistical analyses were performed using JMP Pro, version 15.0.0 (SAS Institute Inc., Cary, NC, USA). A p-value of less than 0.05 was considered significant.
Ethical Consideration
This study protocol was approved by the Research Ethics Committee of Kindai University (approved ID: 08–001, 12–033, and 15–072), and all participants provided written informed consent. The participants were informed of the following: this data would only be used for research on antiaging or prevention of lifestyle-related diseases; participation in this survey was voluntary; participants’ privacy would be guaranteed.
RESULTS
The number of male students who were classified as NBP, HNBP, EBP and hypertension during the study period was 5,128 (40.8%), 3,569 (28.4%), 2,631 (20.9%) and 1,231 (9.8%), while the numbers in female students were 4,145 (83.7%), 463 (9.3%), 317 (6.4%) and 28 (0.6%), respectively. Figure 1 shows the proportion of the different BP classifications in male and female students every year between 2011 and 2019. The prevalence of NBP declined over time in both male and female students, and the prevalence was lower in 2019 (27.5% and 78.3%) than in 2011 (51.6% and 85.1%). The prevalence of hypertension in male and female students ranged from 7.4–12.4% and 0.3–0.9%, respectively, and the prevalence of ABP tended to increase over time.
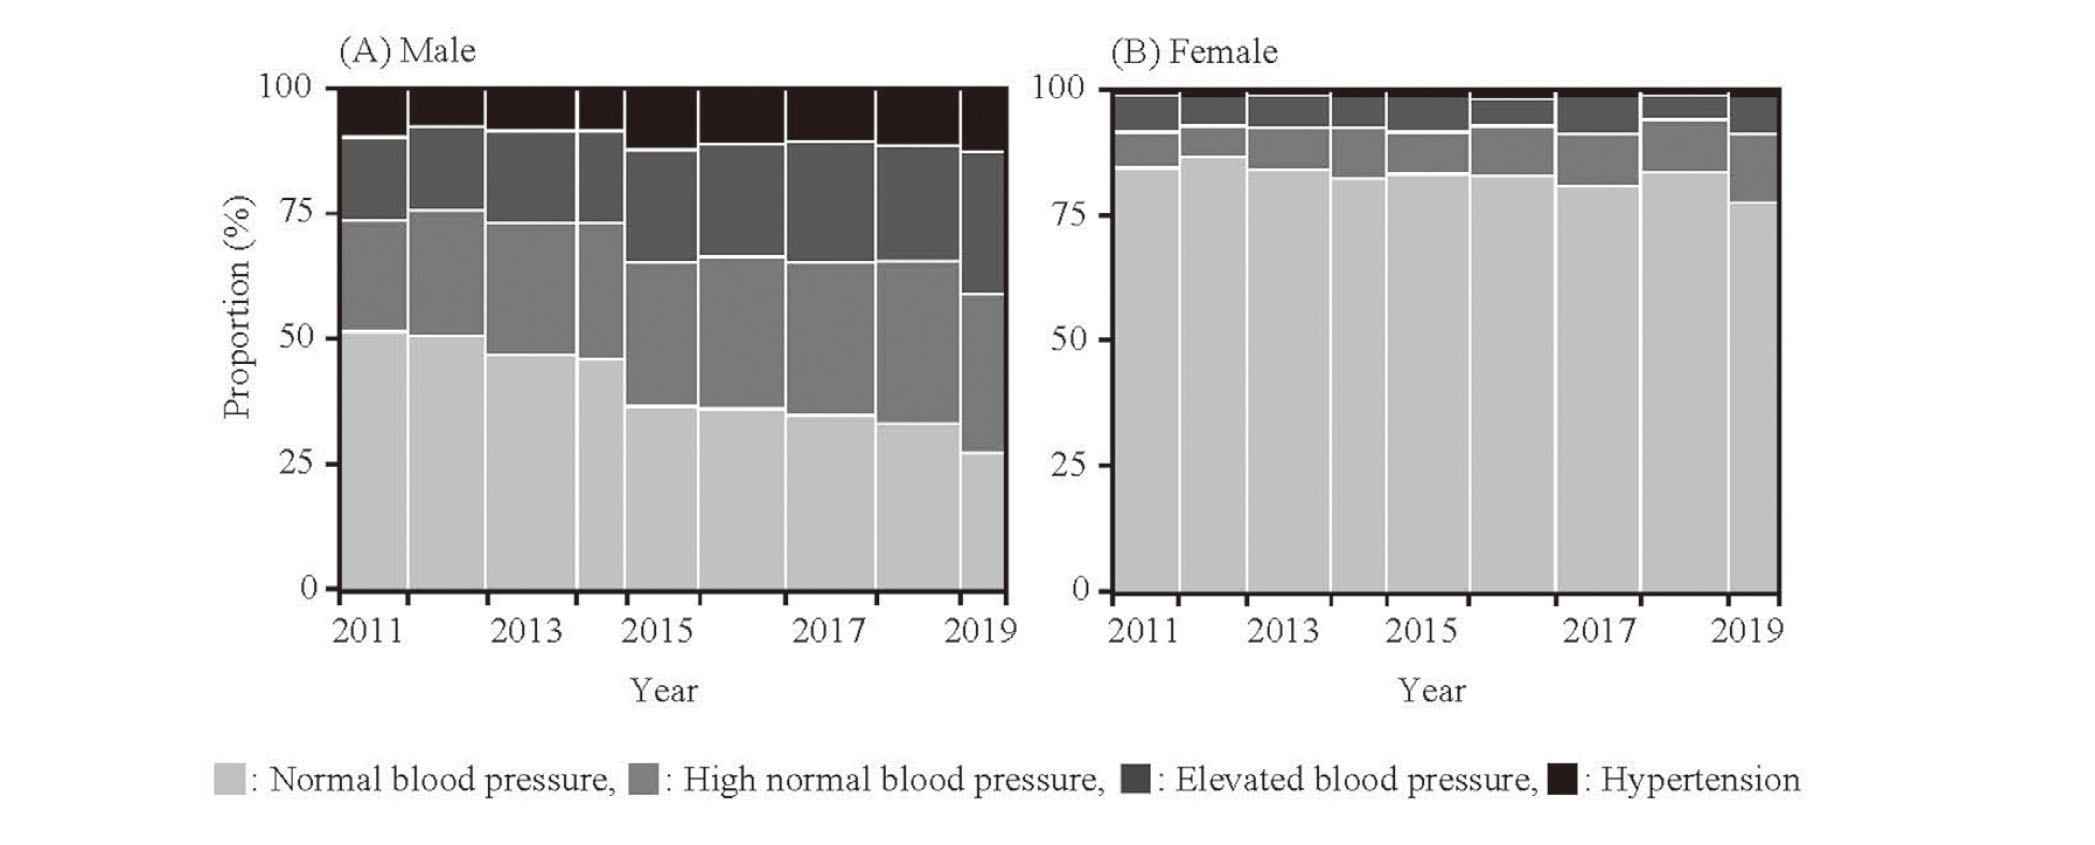
Table 1 shows the comparison of BP, anthropometric measures and body indices in males and females. The mean age ± standard deviation (SD) of the students was 18.5 ± 0.8 in males and 18.4 ± 0.7 in females, and the proportion of first-year students was 93.5% overall. Regarding anthropometric measures, the number of male students who were classified as underweight, normal and obese was 1,814 (14.4%), 9,893 (78.8%) and 852 (6.8%), respectively, while the numbers in female students were 983 (19.8%), 3,864 (78.0%) and 106 (2.1%), respectively. Mean %BF was significantly higher in female students than in male students, with a difference of approximately 10%. Mean CC and WC were significantly larger in male than in female students, while the opposite was true for HC. Regarding body indices, mean values of ABSI, AVI and CI were significantly higher in male than in female students, while the opposite was true for BAI. Mean BRI did not differ significantly between males and females. Regarding BP, SBP and DBP were significantly higher in males (122.3/68.4 mmHg) than in females (107.9/64.3 mmHg), with a difference of approximately 15 mmHg in SBP.
Table 1. Comparison of Blood Pressure, Anthropometric Measures and Body Indices in Males and Females

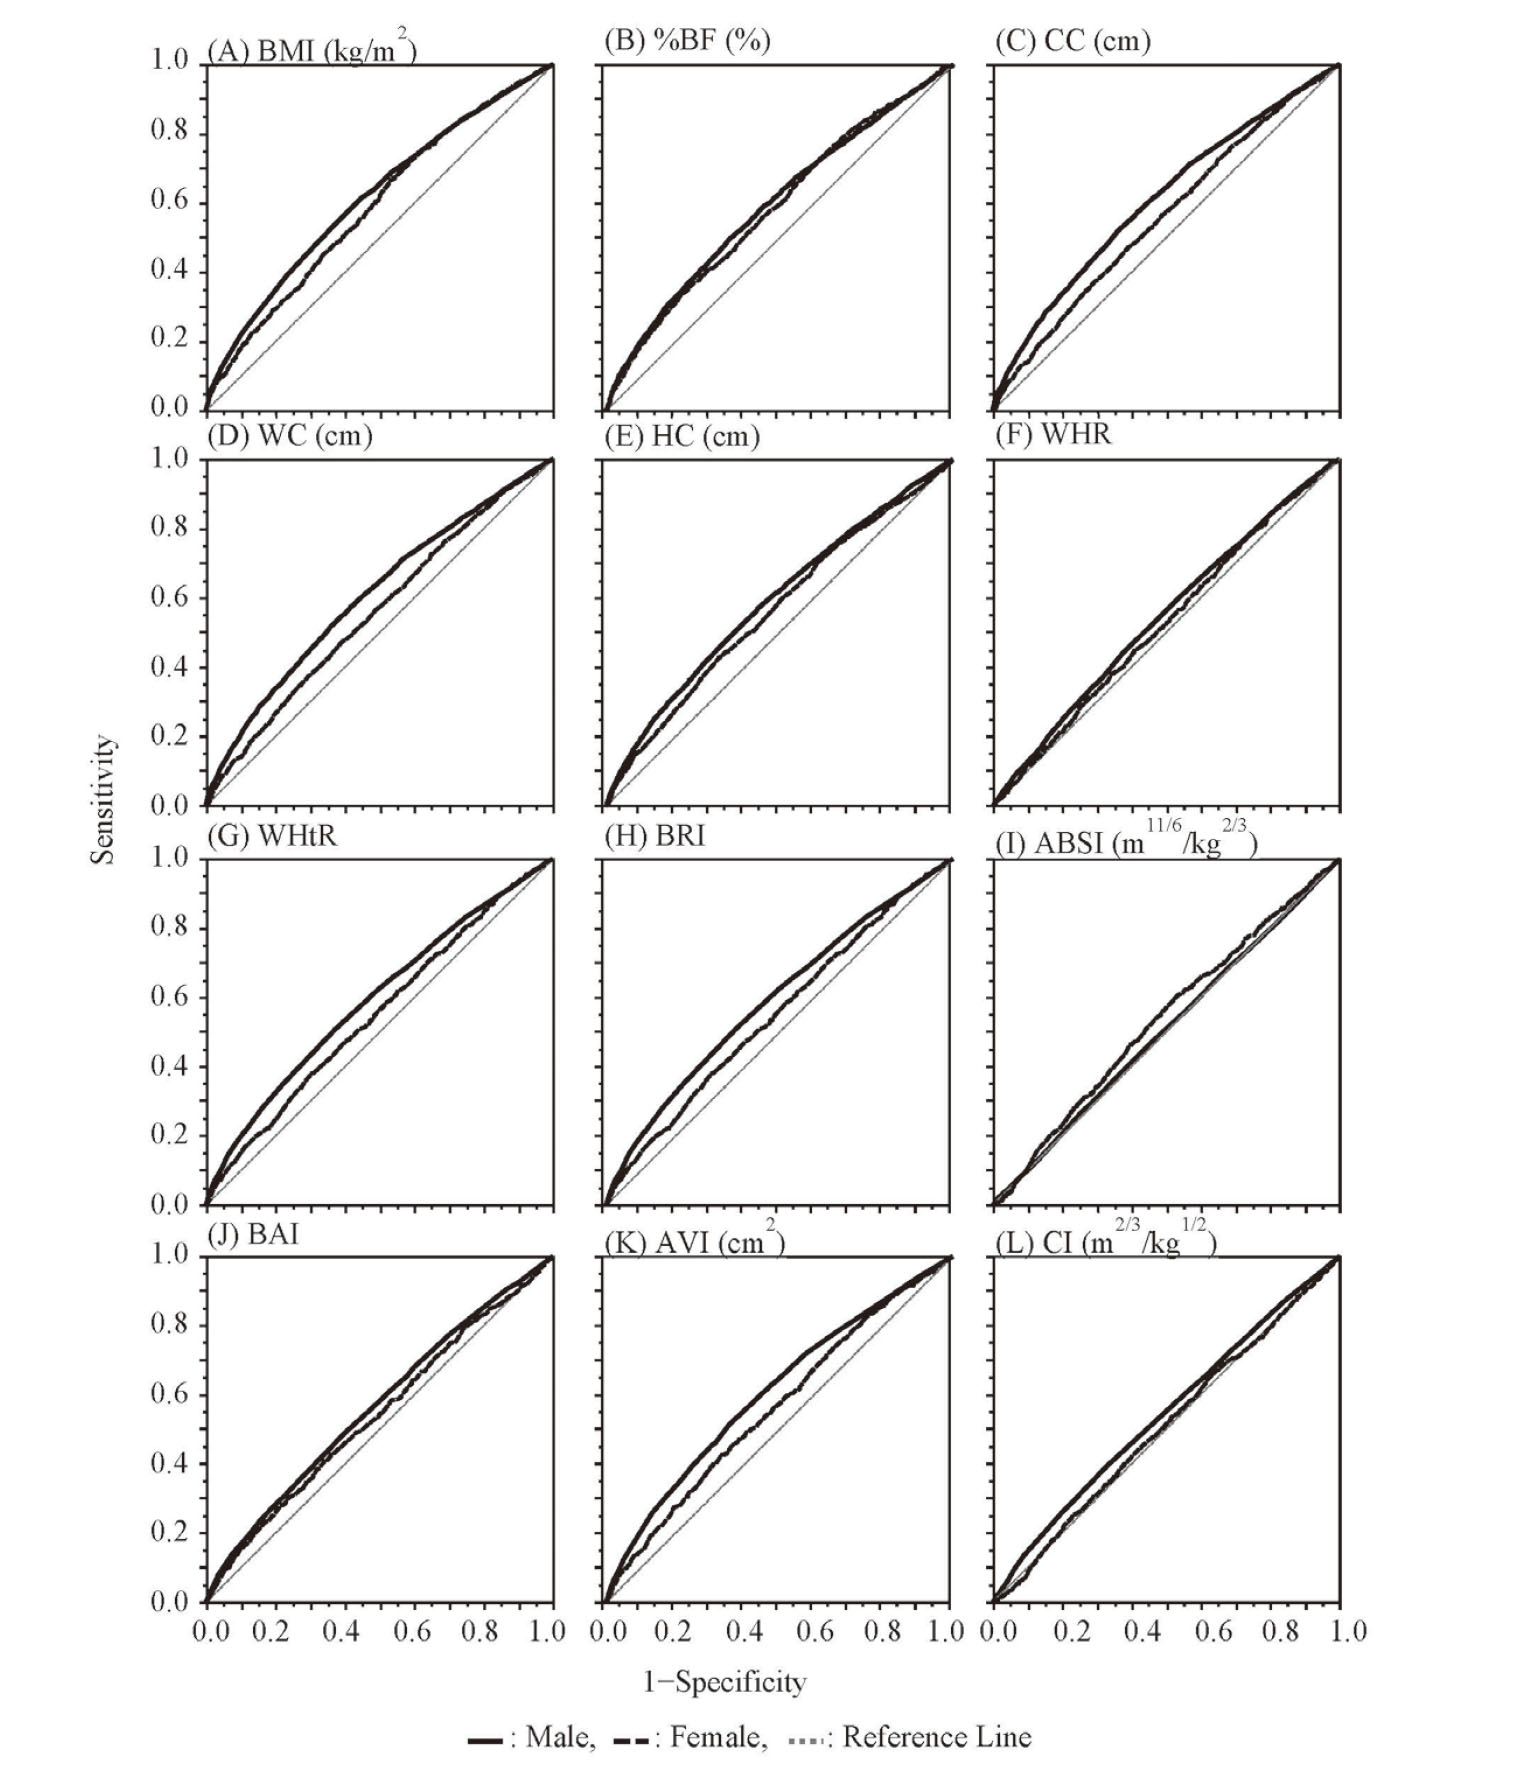
The results of ROC curve analyses, AUC, cut-off point, sensitivity, specificity and odds ratios of anthropometric measures and body indices for ABP in Japanese university students are presented in Table 2 and Fig. 2. The AUCs of anthropometric measures and body indices for ABP were less than 0.7, indicating a poor predictive performance. Univariate logistic regression analysis showed that the top three AUCs of anthropometric measures for ABP in descending order were of BMI, WC and CC in male students, and BMI, %BF and CC in female students. In both male and female students, among anthropometric measures, BMI had the highest predictive performance, with sensitivities/specificities of 58.7%/58.5% in males and 66.6%/47.0% in females. The cut-off point of BMI was 20.5 kg/m2 in males and 19.8 kg/m2 in females, and this value was within the normal range of BMI. The cut-off points of CC and WC were higher in male than female students, whereas that of %BF and HC were higher in female students with differences of approximately 12% and 2 cm. The top three AUCs of body indices for ABP in descending order were AVI, BRI and BAI in both male and female students. In both male and female students, AVI had the highest predictive performance among the body indices, with sensitivities/specificities of 53.1%/63.1% in males and 42.0%/67.3% in females. The cut-off point of AVI was 11.13 in males and 10.29 in females. The AUCs of all anthropometric measures and body indices were higher in male than in female students. The likelihood ratio test showed a significant positive association between ABP and the anthropometric measures or body indices, except for ABSI in male students and ABSI and CI in female students. The highest odds ratio (95% confidence interval: 95% CI) was of BMI in male students and %BF in female students, with values of 2.00 (1.86‒2.15) and 1.85 (1.57‒2.19), respectively.
Table 2. Univariate Analysis of Anthropometrics and Body Indices for Abnormal Blood Pressure in Japanese University Students
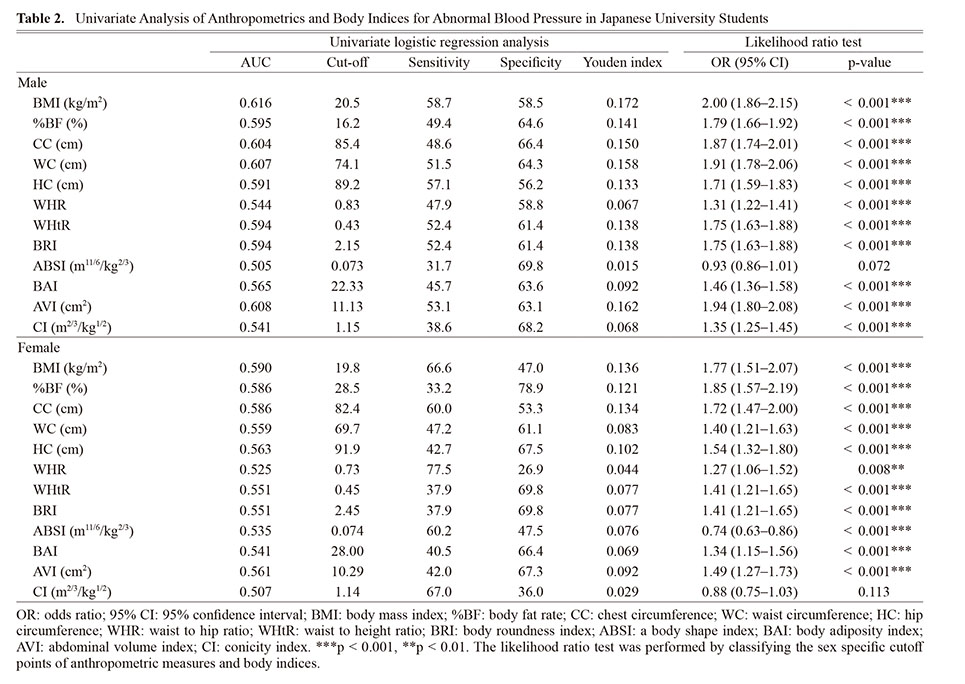
Table 3 shows the results of multivariate logistic regression analysis of ABP and anthropometric measures. In male students, all seven categories were significant independent risk factors for ABP, and the top three odds ratios (95% CI) were 2.69 (2.45‒2.94) for All, 1.73 (1.47‒2.04) for BMI-CC, and 1.68 (1.46‒1.93) for BMI-WC, respectively, compared to the None group. In female students, All, BMI-CC and BMI-%BF were significant independent risk factors for ABP, with odds ratios of 2.40 (1.96‒2.95), 1.69 (1.36‒2.09) and 2.01 (1.29‒3.13), respectively, compared to the None group. The model of p-value in male and female students was < 0.001. The odds ratios tended to increase with an increase in the number of factors in the categories.
Table 3. Multivariate Logistic Regression Analysis of ABP and Anthropometric Measures

DISCUSSION
In our study, the prevalence of hypertension was 7.4‒12.4% in male students and 0.3‒0.9% in female students, and the proportion of students who were classified as NBP tended to decline over the 9-year study period. According to the NHNS,2) the prevalence of hypertension was 4.7‒12.0% in males aged 20‒29 years and 0.0‒3.2% in females aged 20‒29 years between 2011 and 2019. A previous study reported the prevalence of hypertension in Japanese university students as 3.2‒3.7% in males and 0.2‒0.4% in females between 2015 and 2017.3) The prevalence of hypertension in our study was, therefore, similar to that reported in previous studies. Additionally, the JSH 2019 estimated that approximately 14 million people are unaware that they have hypertension and 4.5 million are untreated despite disease awareness.1) The hypertensive unaware subjects and those untreated despite awareness are likely to be younger (20‒39 years).17) Meanwhile, the JSH 2019 suggests that BP should be controlled to < 120/80 mmHg because of greater cardiovascular risks with increases in BP.1) In our study, the proportion of students who were classified as NBP was 40.8% in males and 83.7% in females, although the proportion of male students with NBP decreased over the study period. This could be related to the changes in lifestyle habits of university students when they enter university, which might affect their BP. These previous studies and our results suggest that interventions for appropriate control of BP are needed in university students.
In this study, the group of HNBP, EBP and hypertension was defined as ABP, because BP should ideally be maintained at < 120/80 mmHg. Our study revealed that BMI has a discriminatory power for ABP in university students, although its utility as a predictive factor for ABP differs between males and females. A previous meta-analysis reported that BMI, WC and WHtR have equal degrees of correlation with hypertension.18) In previous studies, the cut-off points of BMI for predicting hypertension or a BP of > 130/85 mmHg were 23.5‒27.2 kg/m2 in males and 23.2‒28.4 kg/m2 in females in Chinese,19,20) European,21) and Nigerian8) populations. Similarly, the cut-off points of the WC were 84.5‒98.0 cm in males and 78.2‒90.5 cm in females in Chinese,19,20) European,21) and Nigerian8) populations. In our study, the cut-off points of BMI and WC were 20.5 kg/m2 and 74.1 cm in males and 19.8 kg/m2 and 69.7 cm in females, respectively, which are lower than those in the previous studies. These findings suggest that the set cut-off points need to consider age and race. On the other hand, the JSH 2019 suggests that BMI should be maintained at < 25 kg/m2 for the prevention of hypertension.1) Additionally, a WC of ≥ 85 cm in males and ≥ 90 cm in females, which are equivalent to a visceral fat area of 100 cm2, have been used as a criterion for metabolic syndrome.22) These cut-off points are, however, controversial because the values are set lower in males than in females. The cut-off points in our study were lower than those in the previous studies.1,22) Although the optimal cut-off points of BMI and WC remain controversial, new cut-off points for young adults need to be established.
Regarding the other anthropometric measures, a previous study reported that WHtR is a better predicter of hypertension than the other indices in some cases.18) The AUC of WHtR in our study was lower than those of other anthropometric measures and body indices. These differences between previous studies and our results might be attributed to the special population of Japanese university students. On the other hand, our study indicated that %BF and CC might be associated with BP in female university students. The association between BP and CC remains unclear, and further research is needed to confirm this association. Previously, the AUC of %BF was reported as being higher in females than in males, and %BF was considered to be a useful predictor of hypertension in females.19) The cut-off points of %BF for predicting hypertension or a BP of > 130/85 mmHg were described as 24.25‒26.10% for males and 33.65‒36.80% for females,19,20) and these values were higher than in our study. In another study, %BF was significantly associated with the prevalence of hypertension23) and was an indicator to predict hypertension.19) Our results suggest that %BF might also be a useful predictor of BP in the Japanese population. Multivariate logistic regression analysis revealed that the odds ratio of the All group was the highest among all categories. Additionally, BMI, WC (%BF) and CC were significantly associated with ABP in males, while there was no significant association in females. Additionally, BMI-WC (%BF) and BMI-CC were significantly associated with ABP in both male and female students. These results suggest that the incidence of ABP is increased when two or more factors among BMI, WC (%BF) and CC are higher than the cut-off points.
A meta-analysis reported that BRI has greater discriminatory ability for hypertension in adults from different populations compared to ABSI, BMI, WC and WHtR.24) The cut-off points of BRI for predicting hypertension or a BP of > 130/85 mmHg have been reported as 2.80‒4.69 in males and 2.60‒6.05 in females, while those of ABSI were 0.0765‒0.083 in males and 0.0742‒0.0845 in females, respectively.8,20,21,25) The cut-off points of BRI in our study were lower than those in previous studies, whereas those of ABSI did not vary between our study and previous studies. The AUCs in our study tended to be higher for the anthropometric measures rather than for BRI or ABSI, unlike in previous studies.8,20,21,25) This might reflect the difference in classification of BP between our study and previous studies. Although the odds of hypertension were reported to be elevated by 13% with an increase in ABSI by one SD,26) a negative correlation was observed between ABSI and ABP in our study. We could not determine a plausible biological mechanism that could explain this negative correlation. ABSI is considered to be an inappropriate predictor of hypertension because it is clustered closely around the mean with a small variance, resulting in it being difficult to set cut-off points.26) Regarding other body indices, AVI had the highest AUC among BAI, AVI and CI in a previous study,8) which is similar to the result of our study. Additionally, the cut-off points of these body indices did not vary between our study and the previous study. The association between BP and these body indices, thus, remains unclear, and further research is needed to confirm this association. Our findings suggest that BRI and AVI have some discriminatory ability for ABP, although this ability is lower than that of BMI.
Our study has several limitations. First, our study was a cross-sectional study, which cannot provide causal inference between BP and anthropometric measures and mechanistic explanations. Second, information on the exercise and meal habits of the participants was not obtained, and the potential confounding effects of these variables could not be adjusted. Nevertheless, this limitation is considered to be compensated by the relatively large sample size of our study. Third, ABP was defined as > 120/80 mmHg, which could have resulted in lower estimated cut-off points. However, the definition of ABP of > 120/80 mmHg is important for university students in consideration of the risk of hypertension in later life. Although some of the predictive abilities revealed in this study were weak, the association between ABP and anthropometric measures in Japanese university students is useful information. To the best of our knowledge, this is the first study to show the current status of BP, anthropometric measures and body indices, and to evaluate the association between BP and anthropometric measures and body indices in Japanese university students. Here, we provide new evidence for the management of BP and body shape in Japanese university students.
In conclusion, in our study, we investigated the current status of BP and evaluated the association between BP and anthropometric measures and body indices in Japanese university students. The proportion of students who were classified as NBP was 40.8% in males and 83.7% in females, and the proportion of male students with NBP decreased over the nine-year study period. BMI, WC and CC had discriminatory power for ABP in male university students, while BMI, %BF and CC had discriminatory ability in females. Among these three measurements, the probability of developing ABP might be higher in subjects in whom two or more of the factors show values higher than the cut-off points. Additionally, although body indices such as the BRI, ABSI, BAI, AVI and CI also had some discriminatory ability for ABP, their ability was lower than those of BMI. These findings suggest that interventions for BP control are needed in university students, and anthropometric measures might be a useful part of such interventions.
Acknowledgment
Part of this study was conducted with the support of the Antiaging center, Kindai university.
Conflict of interest
The authors declare no conflict of interest.
REFERENCES
- 1) Umemura S, Arima H, Arima S, Asayama K, Dohi Y, Hirooka Y, Horio T, Hoshide S, Ikeda S, Ishimitsu T, Ito M, Ito S, Iwashima Y, Kai H, Kamide K, Kanno Y, Kashihara N, Kawano Y, Kikuchi T, Kitamura K, Kitazono T, Kohara K, Kudo M, Kumagai H, Matsumura K, Matsuura H, Miura K, Mukoyama M, Nakamura S, Ohkubo T, Ohya Y, Okura T, Rakugi H, Saitoh S, Shibata H, Shimosawa T, Suzuki H, Takahashi S, Tamura K, Tomiyama H, Tsuchihashi T, Ueda S, Uehara Y, Urata H, Hirawa N. The Japanese Society of Hypertension guidelines for the management of hypertension (JSH 2019). Hypertens. Res., 42, 1235–1481 (2019).
- 2) Ministry of Health. Labour and Welfare. “National Health and Nutrition Survey” <https://www.mhlw.go.jp/stf/seisakunitsuite/bunya/kenkou_iryou/kenkou/eiyou/r1-houkoku_00002.html>, cited 12 August, 2021.
- 3) Kawabe H, Azegami T, Takeda A, Kanda T, Saito I, Saruta T, Hirose H. Features of and preventive measures against hypertension in the young. Hypertens. Res., 42, 935–948 (2019).
- 4) Liang Y, Mi J. Pubertal hypertension is a strong predictor for the risk of adult hypertension. Biomed. Environ. Sci., 24, 459–466 (2011).
- 5) Chen X, Wang Y. Tracking of blood pressure from childhood to adulthood: a systematic review and meta-regression analysis. Circulation, 117, 3171–3180 (2008).
- 6) Kuciene R, Dulskiene V. Associations between body mass index, waist circumference, waist-to-height ratio, and high blood pressure among adolescents: a cross-sectional study. Sci. Rep., 9, 9493 (2019).
- 7) Benetou V, Bamia C, Trichopoulos D, Mountokalakis T, Psaltopoulou T, Trichopoulou A. The association of body mass index and waist circumference with blood pressure depends on age and gender: a study of 10,928 non-smoking adults in the Greek EPIC cohort. Eur. J. Epidemiol., 19, 803–809 (2004).
- 8) Adegoke O, Ozoh OB, Odeniyi IA, Bello BT, Akinkugbe AO, Ojo OO, Agabi OP, Okubadejo NU. Prevalence of obesity and an interrogation of the correlation between anthropometric indices and blood pressures in urban Lagos, Nigeria. Sci. Rep., 11, 3522 (2021).
- 9) Dzudie A, Njedock N, Boombhi J, Ba H, Amougou SN, Kamdem F, Barche B, Nzali A, Njomou A, Ngwasiri C, Geh MM, Azabji M, Mefire AC, Njamnshi AK, Kingue S, Empana JP, Sobngwi E, Etoundi Ngoa LS, Kengne AP. Association between measures of adiposity and blood pressure levels in adult Cameroonians. Health Sci. Rep., 4, e259 (2021).
- 10) Al Hourani HM, Alkhatib B. Anthropometric indices of obesity as predictors of high blood pressure among school children. Clin. Exp. Hypertens., 44, 11–19 (2021).
- 11) Uchiyama A, Shimizu T, Nakagawa T, Tanaka T. Association of hypertension with changes in the body mass index of university students. Environ. Health Prev. Med., 13, 271–280 (2008).
- 12) Thomas DM, Bredlau C, Bosy-Westphal A, Mueller M, Shen W, Gallagher D, Maeda Y, McDougall A, Peterson CM, Ravussin E, Heymsfield SB. Relationships between body roundness with body fat and visceral adipose tissue emerging from a new geometrical model. Obesity (Silver Spring), 21, 2264–2271 (2013).
- 13) Krakauer NY, Krakauer JC. A new body shape index predicts mortality hazard independently of body mass index. PLoS One, 7, e39504 (2012).
- 14) Bergman RN, Stefanovski D, Buchanan TA, Sumner AE, Reynolds JC, Sebring NG, Xiang AH, Watanabe RM. A better index of body adiposity. Obesity (Silver Spring), 19, 1083–1089 (2011).
- 15) Guerrero-Romero F, Rodríguez-Morán M. Abdominal volume index. an anthropometry-based index for estimation of obesity is strongly related to impaired glucose tolerance and type 2 diabetes mellitus. Arch. Med. Res., 34, 428–432 (2003).
- 16) Valdez R, Seidell JC, Ahn YI, Weiss KM. A new index of abdominal adiposity as an indicator of risk for cardiovascular disease. A cross-population study. Int. J. Obes. Relat. Metab. Disord. J. Int. Assoc. Study Obes., 17, 77–82 (1993).
- 17) Ostchega Y, Hughes JP, Wright JD, McDowell MA, Louis T. Are Demographic characteristics, health care access and utilization, and comorbid conditions associated with hypertension among US adults? Am. J. Hypertens., 21, 159–165 (2008).
- 18) Deng G, Yin L, Liu W, Liu X, Xiang Q, Qian Z, Ma J, Chen H, Wang Y, Hu B, Li W, Jiang Y. Associations of anthropometric adiposity indexes with hypertension risk: A systematic review and meta-analysis including PURE-China. Medicine (Baltimore), 97, e13262 (2018).
- 19) Jiang J, Deng S, Chen Y, Liang S, Ma N, Xu Y, Chen X, Cao X, Song C, Nie W, Wang K. Comparison of visceral and body fat indices and anthropometric measures in relation to untreated hypertension by age and gender among Chinese. Int. J. Cardiol., 219, 204–211 (2016).
- 20) Zhang J, Zhu W, Qiu L, Huang L, Fang L. Sex- and age-specific optimal anthropometric indices as screening tools for metabolic syndrome in Chinese adults. Int. J. Endocrinol., 2018, 1067603 (2018).
- 21) Głuszek S, Ciesla E, Głuszek-Osuch M, Kozieł D, Kiebzak W, Wypchło Ł, Suliga E. Anthropometric indices and cut-off points in the diagnosis of metabolic disorders. PLoS One, 15, e0235121 (2020).
- 22) Yamagishi K, Iso H. The criteria for metabolic syndrome and the national health screening and education system in Japan. Epidemiol. Health, 39, e2017003 (2017).
- 23) Li R, Tian Z, Wang Y, Liu X, Tu R, Wang Y, Dong X, Wang Y, Wei D, Tian H. The Association of Body fat Percentage with Hypertension in a Chinese rural population: the Henan rural cohort study. Front. Public Health, 8, 70 (2020).
- 24) Calderon-Garcia JF, Roncero-Martin R, Rico-Martin S, De Nicolas-Jimenez JM, Lopez-Espuela F, Santano-Mogena E, Alfageme-Garcia P, Sanchez Munoz-Torrero JF. Effectiveness of Body Roundness Index (BRI) and a Body Shape Index (ABSI) in predicting hypertension: a systematic review and meta-analysis of observational studies. Int. J. Environ. Res. Public Health, 18, 11607 (2021).
- 25) Liu PJ, Ma F, Lou HP, Zhu YN. Comparison of the ability to identify cardiometabolic risk factors between two new body indices and waist-to-height ratio among Chinese adults with normal BMI and waist circumference. Public Health Nutr., 20, 984–991 (2017).
- 26) Ji M, Zhang S, An R. Effectiveness of A Body Shape Index (ABSI) in predicting chronic diseases and mortality: a systematic review and meta-analysis. Obes. Rev., 19, 737–759 (2018).
;%0A%09%09%09newWindow.document.open();%0A%09%09%09newWindow.document.write('<img src=%22./Graphics/5_140-t1.jpg%22>');%0A%09%09%09newWindow.document.close();%0A%09%09)
;%0A%09%09%09newWindow.document.open();%0A%09%09%09newWindow.document.write('<img src=%22./Graphics/5_140-t2.jpg%22>');%0A%09%09%09newWindow.document.close();%0A%09%09)
;%0A%09%09%09newWindow.document.open();%0A%09%09%09newWindow.document.write('<img src=%22./Graphics/5_140-t3.jpg%22>');%0A%09%09%09newWindow.document.close();%0A%09%09)