Report
PPARγ Protein Expression is Regulated by Cited1 and Cidec in Mouse 3T3-L1 Adipocytes Treated with Troglitazone
2023 年 6 巻 2 号 p. 55-61
詳細
2023 年 6 巻 2 号 p. 55-61
We previously reported that treatment with thiazolidinediones (TZDs), such as troglitazone (Tro), downregulates the protein levels of peroxisome proliferator-activated receptor gamma (PPARγ), with enhanced lipid accumulation during 3T3-L1 murine adipocyte differentiation in the presence of 3-isobutyl methylxanthine, dexamethasone, and insulin (MDI). In this study, we performed DNA microarray analysis to compare the gene expression profiles of MDI-induced and MDI/Tro-induced 3T3-L1 adipocytes to elucidate the mechanism underlying the reduction in PPARγ protein expression by Tro treatment. Apoptotic process genes of Gene Ontology were selected from the upregulated genes in MDI/Tro-induced cells and analyzed using real-time RT-PCR and western blotting. For several proteins, higher expression was detected in MDI/Tro-treated 3T3-L1 cells than in MDI-treated cells. Plasmid expression analysis using 293T cells revealed that the expression of cell death-inducing DFFA-like effector C (Cidec) or Cbp/P300-interacting transactivator with Glu/Asp-rich carboxy-terminal domain 1 (Cited1) reduced PPARγ protein expression compared with the vector control. When 3T3-L1 preadipocytes transfected with small interfering RNA targeting Cidec or Cited1 were differentiated in response to MDI or MDI/Tro treatment, the reduction in PPARγ expression in MDI/Tro-treated 3T3-L1 adipocytes was partially suppressed. Our findings indicate that the expression of PPARγ protein is regulated in part by the induction of Cidec and Cited1 in MDI/Tro-treated 3T3-L1 adipocytes.
Thiazolidinediones (TZDs) are high-affinity ligands for peroxisome proliferator-activated receptor gamma (PPARγ) that act as anti-diabetic insulin-sensitizing compounds. Most of the pharmacological effects of TZDs are believed to activate PPARγ. In vitro studies have shown that TZDs exert a strong adipogenic effect on preadipocytes.1–3) During the differentiation of murine 3T3-L1 preadipocytes, the induction of lipid accumulation by natural compounds or synthetic chemicals is associated with an increase in PPARγ expression.4–6) In contrast, inhibition of adipogenesis by natural compounds is associated with the downregulation of PPARγ expression.7–12)
PPARγ, a member of the nuclear receptor superfamily, is a ligand-inducible transcription factor that controls the gene networks involved in lipid metabolism and glucose homeostasis. It is associated with the differentiation and phenotypic maintenance of adipocytes, which play important roles in metabolic disorders such as type 2 diabetes and obesity. Under physiological conditions, the activation of PPARγ provides beneficial effects, including the improvement of insulin sensitivity. However, the overactivation of PPARγ in vitro has been shown to induce adipogenesis, adipose tissue expansion, weight gain, and the development of fatty liver in human and animal studies.13–15)
In a previous study of the mechanism associated with the TZD-induced reduction in PPARγ protein expression during 3T3-L1 adipocyte differentiation, we found that the induction of fatty acid-binding protein 4 (FABP4) at an early stage of differentiation induced negative feedback of the super-induction of PPARγ expression.16) Furthermore, we observed that the upregulation of FABP4 and downregulation of PPARγ commenced at 24 h after treatment with TZDs and continued to increase for up to 48 h compared with 3-isobutyl methylxanthine, dexamethasone, and insulin (MDI) treatment and we also established that PPARγ protein levels were lower in MDI/TZD-treated cells than in MDI-treated cells for up to 8 days after stimulation.16) However, for up to 8 days after stimulation, it is possible for metabolism-associated factors to affect the reduction of PPARγ in MDI/TZD-treated cells.
Based on these findings, we hypothesized that the reduction in PPARγ levels during MDI/TZD-induced 3T3-L1 adipocyte differentiation is attributable to negative regulation induced by an increase in the levels of metabolism-associated factors, including FABP4. To verify this hypothesis, in the present study, we evaluated the effects of the metabolism-associated factors induced by the TZD troglitazone (Tro) on PPARγ protein expression in fully differentiated 3T3-L1 adipocytes.
Troglitazone was purchased from Wako Pure Chemical Industries, Ltd. (Osaka, Japan) and dissolved in dimethyl sulfoxide (DMSO; Wako, Osaka, Japan) to a final concentration of 10 mM and then diluted in the culture medium to a final concentration of 0.05% DMSO for cell treatments. MG262 was purchased from Boston Biochem, Inc. (Cambridge, MA, USA).
Microarray AnalysesMicroarray analysis of RNA isolated from 3T3-L1 adipocytes treated with DMSO with MDI or Tro (MDI/Tro) was performed by Toray 3D gene contract analysis (Toray Industries, Inc., Tokyo, Japan).
Cell Culture and Transfection Assays3T3-L1 cells were cultured in Dulbecco’s modified Eagle’s medium (DMEM; Wako) with 10% bovine calf serum (HyClone, South Logan, UT, USA) and 100 U/mL penicillin and 0.1 mg/mL streptomycin (Nacalai Tesque, Kyoto, Japan) at 37°C in a 5% CO2 incubator. For gene knockdown experiments, the cells were seeded in 24-well plates after transfection with small interfering RNA (siRNA) for target genes using Lipofectamine RNAiMAX (Invitrogen, Carlsbad, CA, USA). At post-confluence, cell differentiation was induced by Cayman Induction Medium containing MDI (Cayman Chemical, Ann Arbor, MI, USA) with 10% fetal bovine serum (FBS; Gibco, Carlsbad, CA, USA) for 3 days, and then the culture medium was replaced every 2 days thereafter, with DMEM containing 10% FBS and insulin (Cayman Chemical). During differentiation of 3T3-L1 preadipocytes, 0.05% DMSO or 5µM Tro was added. Cidec siRNA (sc-142342) was purchased from Santa Cruz Biotechnology (Dallas, TX, USA). Control siRNA (Silencer Select Negative Control) and Cited1 siRNA (Silencer Select Type) were from Themo Fisher Scientific (Waltham, MA, USA).
For plasmid overexpression analysis, 293T cells cultured in DMEM with 10% FBS containing 100 U/mL penicillin and 0.1 mg/mL streptomycin were transfected using the PEI-MAX reagent (Polysciences, Inc., Warrington, PA, USA) and the indicated plasmids. Empty vector pcDNA3.1 (Invitrogen) was added to maintain a constant amount of 5 µg DNA per well. pPPARγ, pFABP4, pCidec, pCited1 and pCycs, which have the same CMV promoter, were purchased from GenScript (Nanjing, China). These plasmids except pPPARγ were Flag-tagged.
Oil Red O Staining3T3-L1 adipocytes at 7 days after differentiation, seeded in 24-well cell culture plates, were rinsed with phosphate-buffered saline (PBS) and fixed in formalin overnight at room temperature. The next day, formalin was removed and the cells were rinsed twice with water. Oil red O solution (Cayman Chemical) was added to the dried wells and incubated with the cells for 20 min to 1 h. The cells were rinsed three times with water. The stained lipid droplets were dissolved in isopropanol and the absorbance of the extracted solution was measured at 540 nm by a plate reader (Tecan, Mannedorf, Switzerland).
Immunoblot Analysis3T3-L1 cells cultured in 24-well plates were rinsed twice with PBS and suspended in 200 µL of cell lysis buffer (50 mM Tris-HCl pH 8.0, 150 mM NaCl, 1 mM EDTA, 0.1% NP-40, and 1% protease inhibitor cocktail; Sigma-Aldrich, St. Louis, MO, USA), and the lysates were collected in Eppendorf tubes. The protein content of the cell lysates was measured using a Quick Start Protein Assay Kit (Bio-Rad, Hercules, CA, USA). The cell lysates were mixed with 4× sample buffer (Sigma-Aldrich) and the samples (6–8 µg protein) were separated by sodium dodecyl sulfate-12.5% polyacrylamide gel electrophoresis. The proteins were electro-transferred onto a polyvinylidene fluoride membrane (Immobilon-P; Millipore, Bedford, MA, USA). The membranes were blocked overnight at 4°C in 5% skim milk in PBS with 0.05% Tween-20 and then incubated with the primary antibody at 4°C for 2 h. Thereafter, the membranes were incubated with horseradish peroxidase (HRP)-conjugated secondary donkey anti-rabbit IgG (Cell Signaling Technology, Beverly, MA, USA) or HRP-conjugated secondary rabbit anti-mouse IgG (Cell Signaling Technology). Anti-PPARγ and anti-β-actin antibodies were purchased from Cell Signaling Technology. Anti-FABP4, anti-Cited1, anti-Cycs, and anti-Ptn antibodies were purchased from Proteintech, Inc (Rosemont, IL, USA). Anti-Cidec antibody was purchased from Elabscience Biotechnology, Inc (Houston, TX, USA). HRP substrate (Luminata Forte Western HRP Substrate; Millipore) was added to the membrane and chemiluminescence was detected using the LAS 3000 imaging system (Fujifilm, Tokyo, Japan) or Lumicube (Liponics, Tokyo, Japan). The blots were stripped and re-probed with other primary antibodies and subjected to chemiluminescence detection. Target protein band intensity was quantified using ImageJ (National Institutes of Health, Bethesda, MD, USA).
Quantitative Real-Time RT-PCRThe cells were washed twice with PBS and suspended in RNAiso Plus (Takara Bio, Shiga, Japan). Reverse transcription was performed on 1 µg total RNA using MMLV reverse transcriptase (Takara). RT-PCR was carried out using the Step One Real-Time PCR system (Applied Biosystems, Foster City, CA, USA). The conditions used for the PCR reactions were 95°C for 2 min, followed by 40 cycles at 95°C for 15 s and 59°C for 30 s. Data analysis was performed using the ΔΔCT method. mRNA levels were normalized relative to β-actin expression levels. The primer sequences used for real-time PCR are shown in Table 1.
| F | R | |
|---|---|---|
| b-actin | CAGCCTTCCTTCTTGGGTATGG | CTGTGTTGGCATAGAGGTCTTTACG |
| PPARγ | GGAGCCTAAGTTTGAGTTTGCTGTG | TGCAGCAGGTTGTCTTGGATG |
| FABP4 | CATGGCCAAGCCCAACAT | CGCCCACTTTGAAGGAAATC |
| Cidec | TGTCGTGTTAGCACCGCAGAT | CTCCAGCACCAGGGAGAAGG |
| Cited1 | GAAGGCACAGCACCCACTC | TTCACTCCAAGGTTGGAGTAGG |
| Cycs | CATTACCCTGGTGTGGCTTTCA | ATGCCATAAATACAGCAGCCATTAG |
| Ptn | TGTCGTCCCAGCAATATCAG | ACTCCACTGCCATTCTCCAC |
Results are presented as the means of at least triplicate determinations ± standard deviation (S.D.) Significance was determined by the Student’s t-test. For all statistical comparisons, a P-value < 0.05 was considered statistically significant.
To investigate the mechanism underlying the reduction in PPARγ expression during 3T3-L1 adipocyte differentiation for 6–8 days, we analyzed the microarray expression profiles induced by Tro in fully differentiated 3T3-L1 adipocytes. For this, 3T3-L1 preadipocytes were differentiated in the presence of DMSO or Tro. At 6 days after differentiation, RNA was isolated and microarray analysis was performed. We identified 2,748 and 676 genes that were activated (> 2-fold) and suppressed (> 2-fold), respectively, after treatment with Tro and analyzed the core set of genes for enrichment of Gene Ontology terms associated with the regulation of lipid metabolism and apoptotic processes. Finally, we identified 53 genes that were activated after treatment with Tro (Fig. 1A and Supplemental Table 1); the genes repressed after treatment with Tro are shown in Fig. 1B.
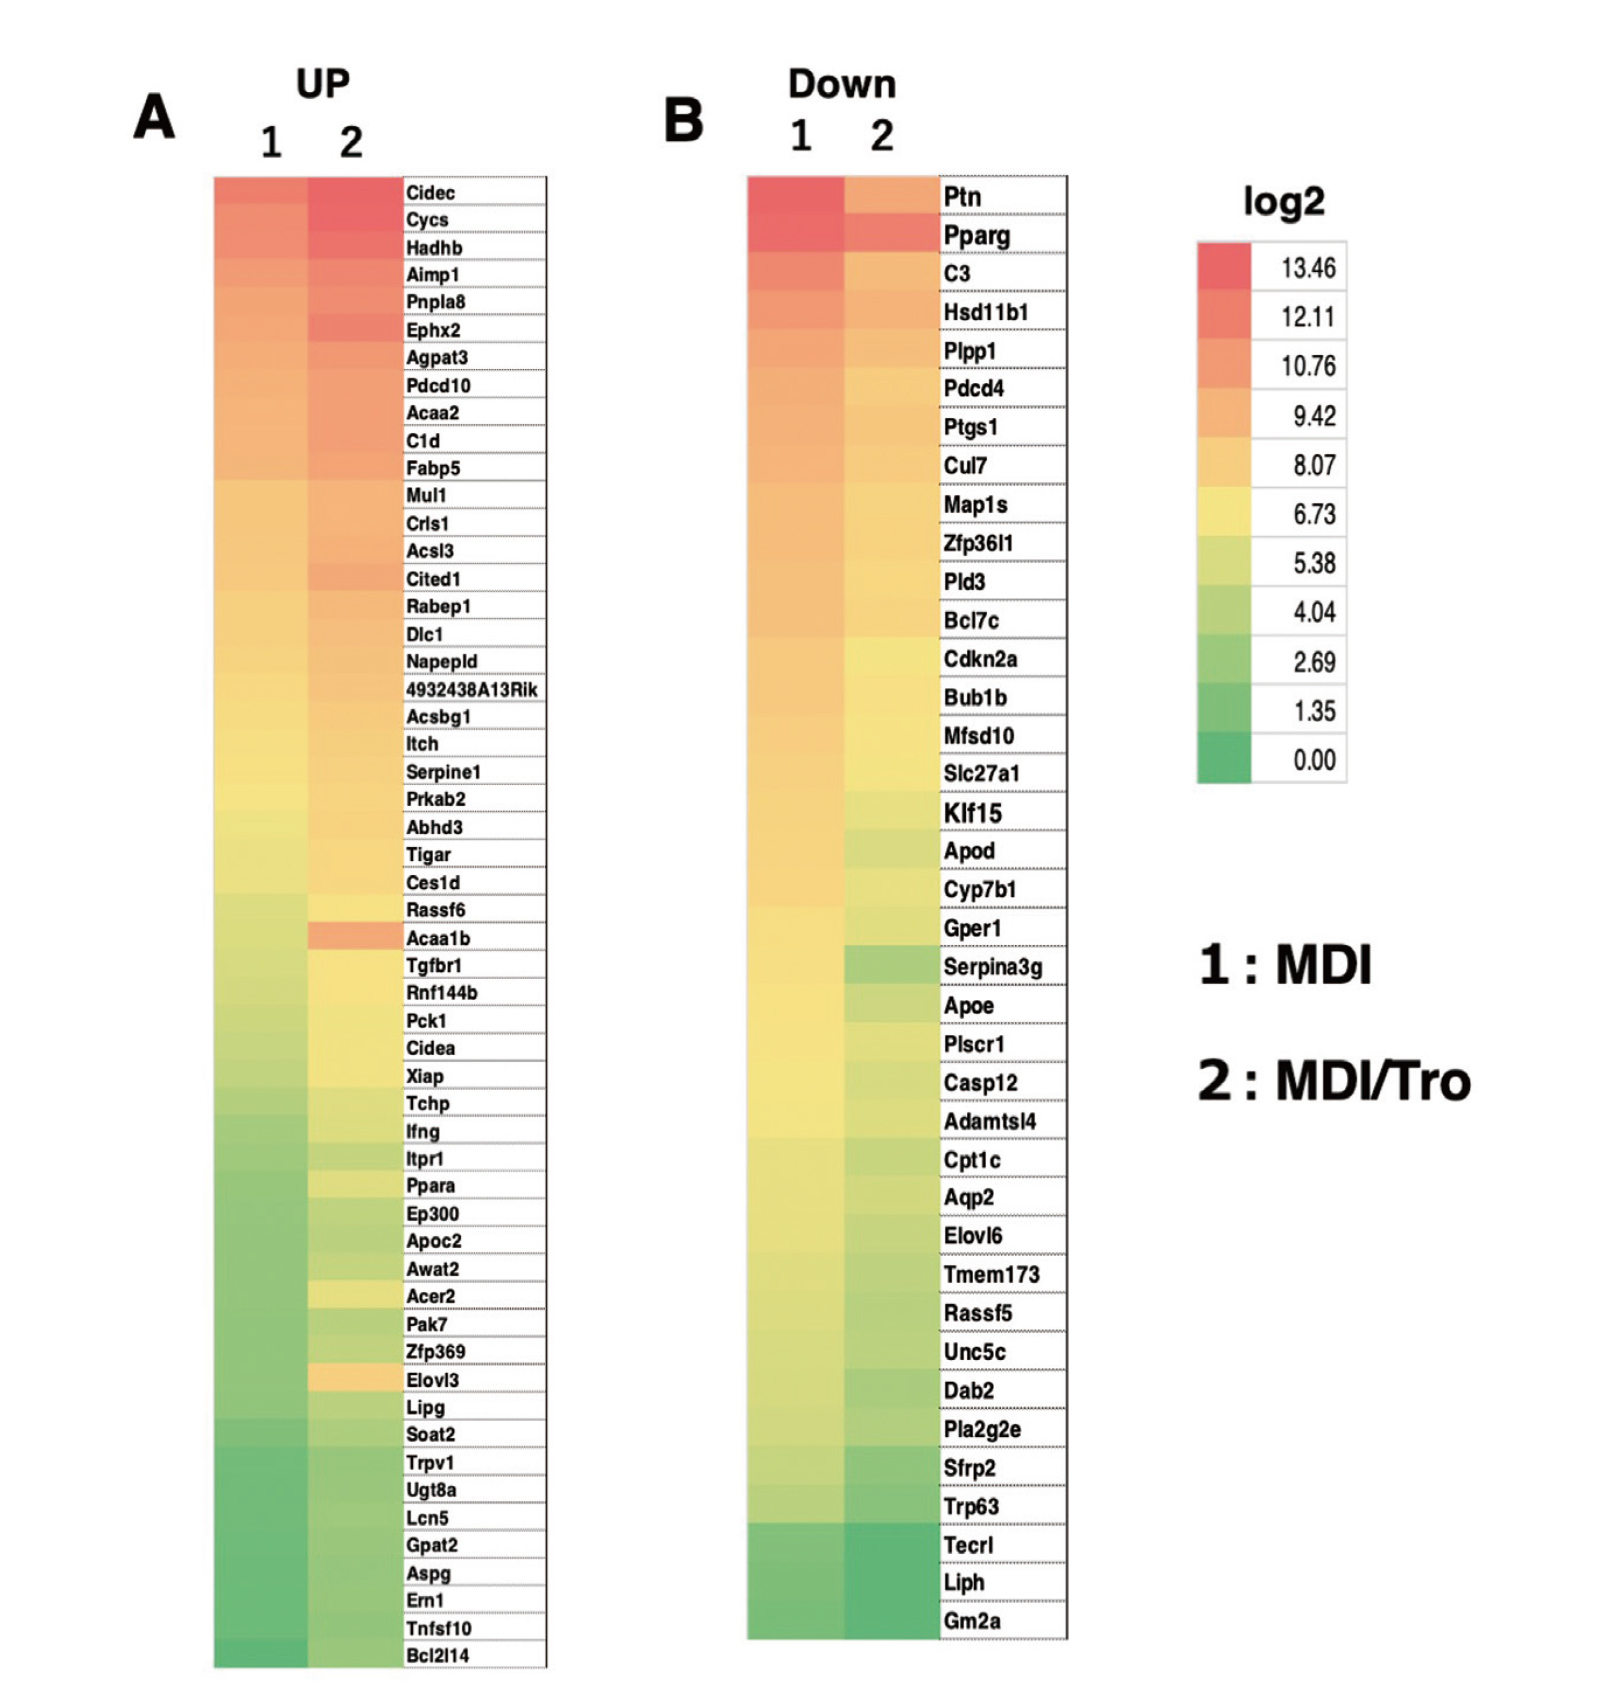
Microarray Analysis Heat Map
Post-confluent 3T3-L1 cells differentiated following treatment with MDI or MDI/Tro. Total RNA was extracted on day 6. Some of the genes that were activated (> 2-fold) (A) or repressed (> 2-fold) (B) after treatment with Tro and the core set of genes enriched in Gene Ontology terms associated with the regulation of lipid metabolism and apoptotic processes were analyzed.
We also selected cell death-inducing DFFA-like effector C (Cidec), Cbp/P300-interacting transactivator with Glu/Asp-rich carboxy-terminal domain 1 (Cited1), and somatic cytochrome c (Cycs) as apoptotic process-associated and higher expressed genes containing a PPAR response element (PPRE) in their promoter from the upregulated genes in the heatmap expression profiles. Real-time RT-PCR showed that Cidec, Cited1, and Cycs were upregulated in MDI/Tro-treated 3T3-L1 adipocytes compared with MDI-treated cells (Fig. 2). Consistently, western blotting revealed that Cidec, Cited1, and Cycs mRNA levels were upregulated in MDI/Tro-treated cells compared with MDI-treated cells (Fig. 3). Microarray analysis did not indicate a > 2-fold induction of FABP4 mRNA in MDI/Tro-treated cells compared with MDI-treated cells at 6 days after differentiation, whereas we detected decreased PPARγ mRNA and protein levels in MDI/Tro-treated 3T3-L1 adipocytes compared with MDI-treated cells, as described previously.16) Furthermore, in MDI/Tro-treated cells, we detected increases in the mRNA and protein levels of FABP4, while reductions in the mRNA and protein levels of pleiotrophin (Ptn) were observed during 3T3-L1 preadipocyte differentiation (Figs. 2 and 3).

Real-Time PCR Analysis of Upregulated Genes in MDI/Tro-Induced 3T3-L1 Adipocytes
Post-confluent 3T3-L1 cells differentiated in the presence of DMSO (C or DM) or Tro (T or TM) with (DM or TM) or without (D or T) MDI. Total RNA was extracted on day 6 and the mRNA levels of PPARγ (A), FABP4 (B), Cidec (C), Cited1 (D), Cycs (E), and Ptn (F) were evaluated using real-time RT-PCR. All expression levels were normalized to that of β-actin. Values are presented as means ± S.D. (n = 3).
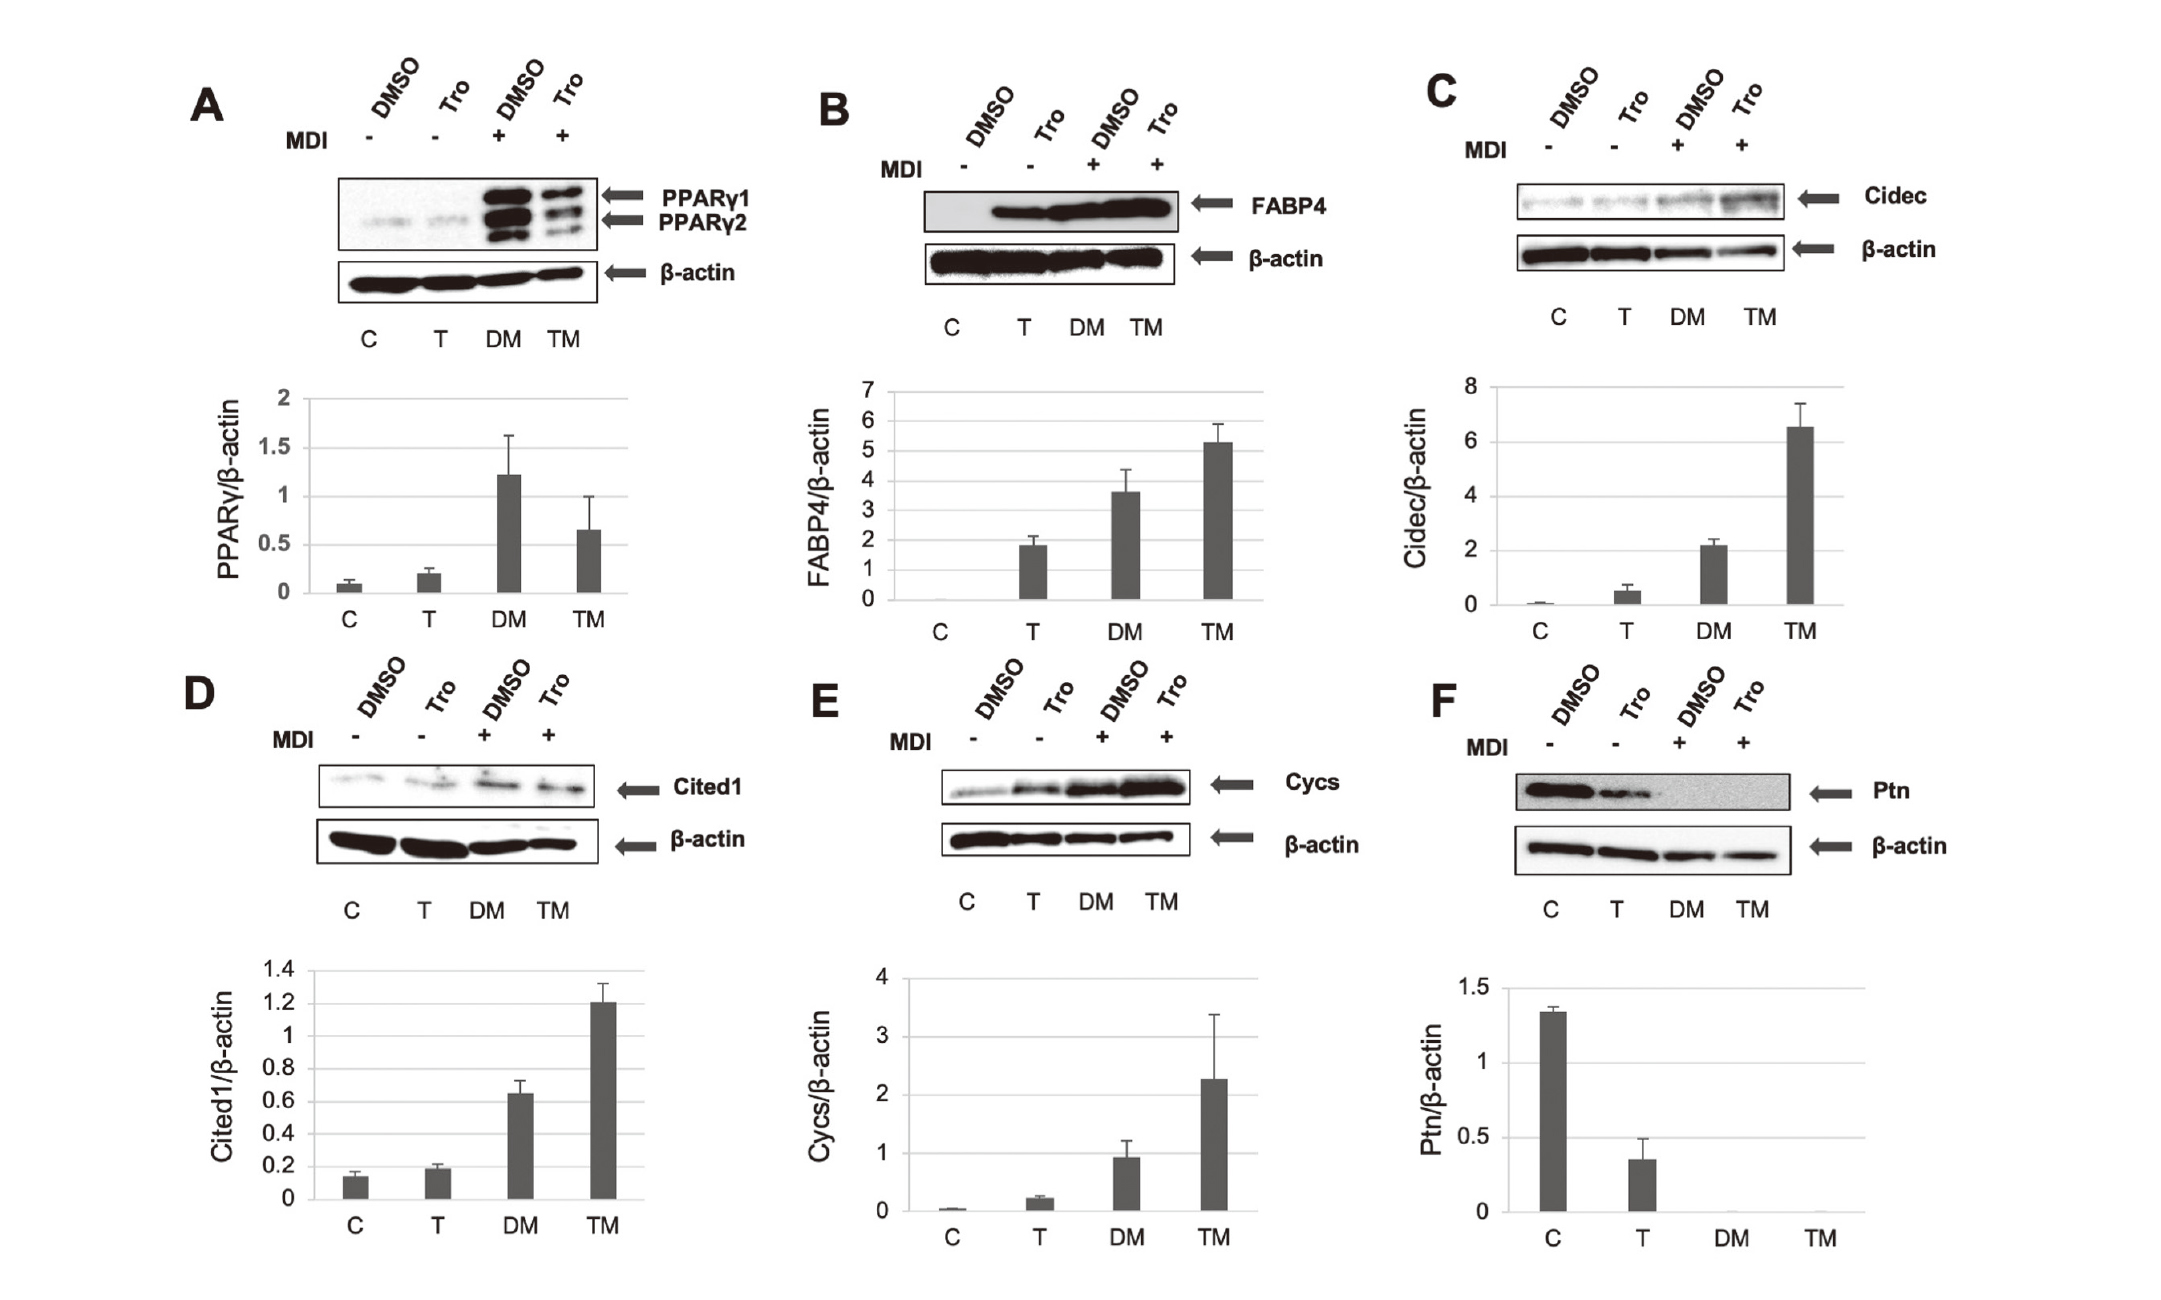
Western Blot Analysis of Upregulated Genes in MDI/Tro-Induced 3T3-L1 Adipocytes
Post-confluent 3T3-L1 cells were differentiated in the presence of DMSO (C or DM) or Tro (T or TM) with (DM or TM) or without (D or T) MDI. Cell lysates were obtained on day 6 and subjected to western blot analysis with anti-PPARγ (A), anti-FABP4 (B), anti-Cidec (C), anti-Cited1 (D), anti-Cycs (E), and anti-Ptn (F) antibodies. All expression levels were normalized to that of β-actin. Values are presented as means ± S.D. (n = 3).
To examine the effects of the genes induced in MDI/Tro-treated cells on PPARγ protein expression, we overexpressed PPARγ in 293T cells, alone or in combination with Cidec, Cycs, Cited1, or FABP4. Immunoblotting showed that the coexpression of PPARγ with Cidec or Cited reduced the levels of PPARγ by approximately 55% or 65%, respectively (Fig. 4A). Given that the basal turnover of PPARγ is reported to be mediated by proteasomal degradation, we investigated whether treatment with the proteasome inhibitor MG262 reversed the reduction in PPARγ protein expression. We found that MG262 treatment combined with Cidec or Cited1 expression restored PPARγ protein levels by up to approximately 25% or 10%, respectively (Fig. 4).
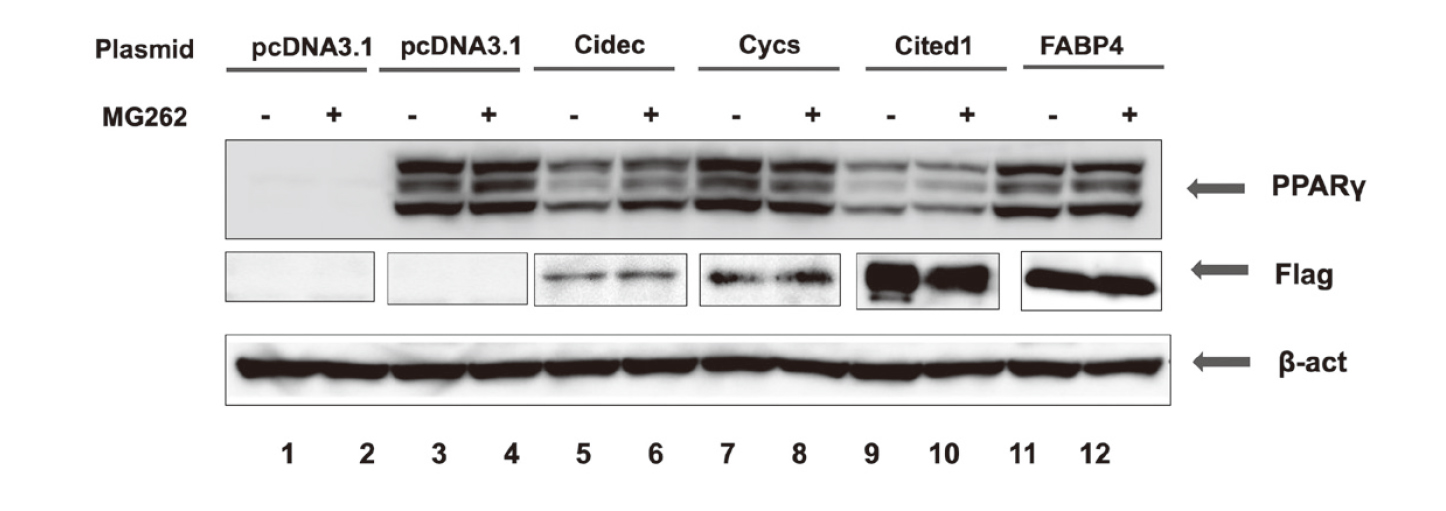
Co-Expression of Cidec and Cited1 Reduces PPARγ Protein Levels in 293T Cells
293T cells were transfected with pPPARγ (lanes 2–12) and either pcDNA3.1 empty vector (lane 2) or the indicated expression plasmids (lanes 3–12). At 37 h after transfection, MG262 (0.1 µmol/L) was added for 17 h, and cell extracts were prepared and immunoblotted with anti-PPARγ, anti-β-actin, and anti-Flag antibodies. As a control, 293T cells were transfected with only the pcDNA3.1 empty vector (lanes 1).
To examine the effects of Cidec and Cited1, 3T3-L1 preadipocytes were transfected with siRNA targeting Cidec or Cited1. Post-confluent 3T3-L1 preadipocytes treated with MDI or MDI/Tro were differentiated to adipocytes. Real-time RT-PCR showed that transfection of 3T3-L1 cells with Cidec or Cited1 siRNA reduced their respective mRNA levels by 61% ± 5% or 75% ± 0.6% (Fig. 5A). Additionally, transfection with Cidec siRNA reduced Cited1 mRNA levels by 39% ± 0.5% (Fig. 5A).
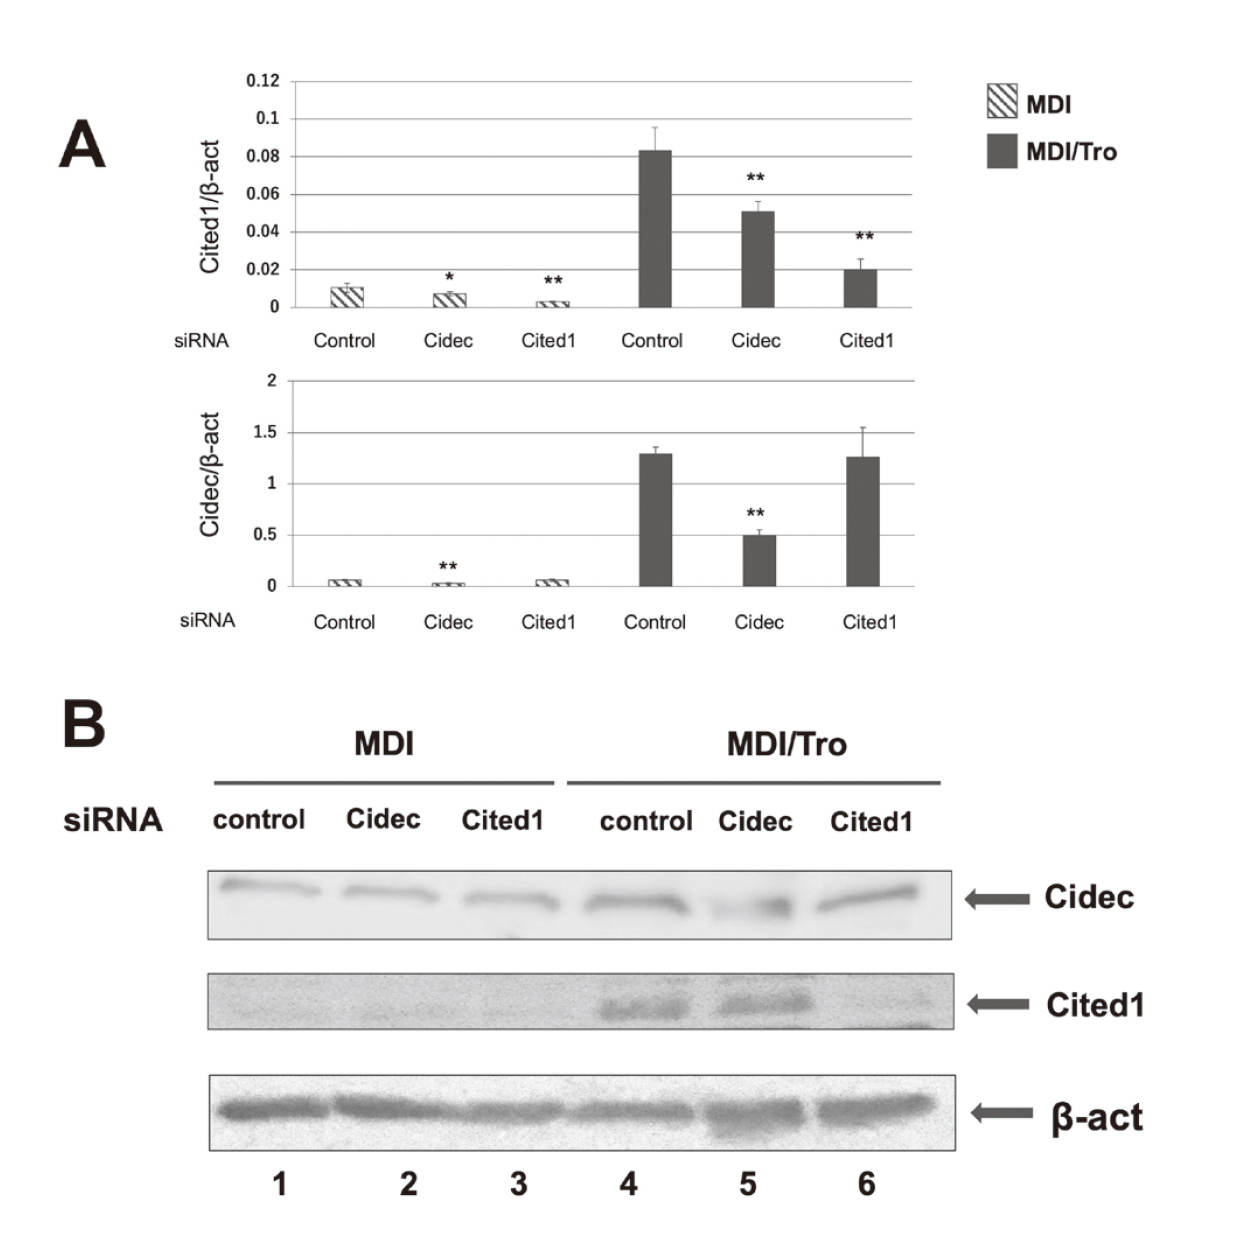
mRNA and Protein Expression Levels in 3T3-L1 Adipocytes Transfected with Cidec or Cited1 siRNA
3T3-L1 preadipocytes were transfected with a non-targeting siRNA (control), Cidec siRNA, or Cited1 siRNA and then differentiated with MDI in the presence or absence of Tro for up to 6 days. (A) Total RNA was isolated from the cell extracts and measured using real-time RT-PCR. All expression levels were normalized to that of β-actin. Values are presented as means ± S.D. (n = 3). *p < 0.05, **p < 0.01. (B) Cell lysates transfected with siRNA were prepared and immunoblotted with antibodies against Cidec, Cited1, or β-actin.
Furthermore, immunoblot analysis showed that compared with MDI-treated adipocytes, Cidec and Cited1 protein levels were increased in MDI/Tro-treated adipocytes. Transfection with Cidec siRNA decreased the levels of Cidec protein in MDI/Tro-treated 3T3-L1 cells by 60% ± 6.0%. Similarly, transfection with Cited1 siRNA decreased Cited1 protein levels in MDI/Tro-induced 3T3-L1 cells by 70%. ± 7.6% (Fig. 5B).
We subsequently examined the effect of the partial knockdown of Cidec or Cited1 on lipid accumulation in 3T3-L1 adipocytes. Knockdown of Cidec, but not Cited1, decreased lipid accumulation in MDI-treated 3T3-L1 adipocytes, but not in MDI/Tro-treated cells at 7 days after differentiation (Fig. 6).
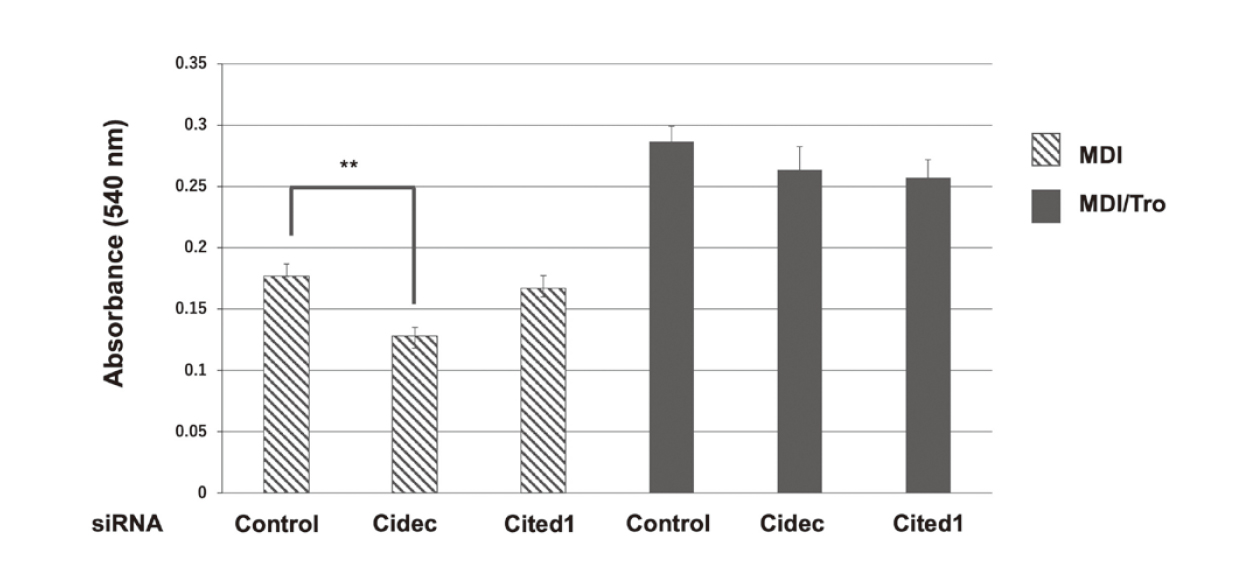
Lipid Accumulation in siRNA-Transfected 3T3-L1 Adipocytes
3T3-L1 preadipocytes were transfected with a non-targeting siRNA (control), Cidec siRNA, or Cited1 siRNA, then induced to differentiate with MDI in the presence or absence of Tro for up to 6 days and stained with Oil Red O. The stained lipid droplets were dissolved in isopropanol and the absorbance of the extracted solution was measured at 540 nm. Values are presented as means ± S.D. (n = 3). *p < 0.05, **p < 0.01.
We examined PPARγ protein levels following 3T3-L1 preadipocyte differentiation with knockdown of Cidec or Cited1 expression. At 6 days after the differentiation of 3T3-L1 adipocytes, Cidec knockdown, but not Cited1 knockdown, resulted in a significant reduction in the levels of PPARγ1 and PPARγ2 in MDI-treated 3T3-L1 adipocytes compared with the control cells (Fig. 7A and B). In contrast, in MDI/Tro-treated 3T3-L1 adipocytes, Cidec knockdown increased PPARγ2 levels, while Cited1 knockdown increased PPARγ1 and PPARγ2 expression significantly compared with control (Fig. 7A and B).
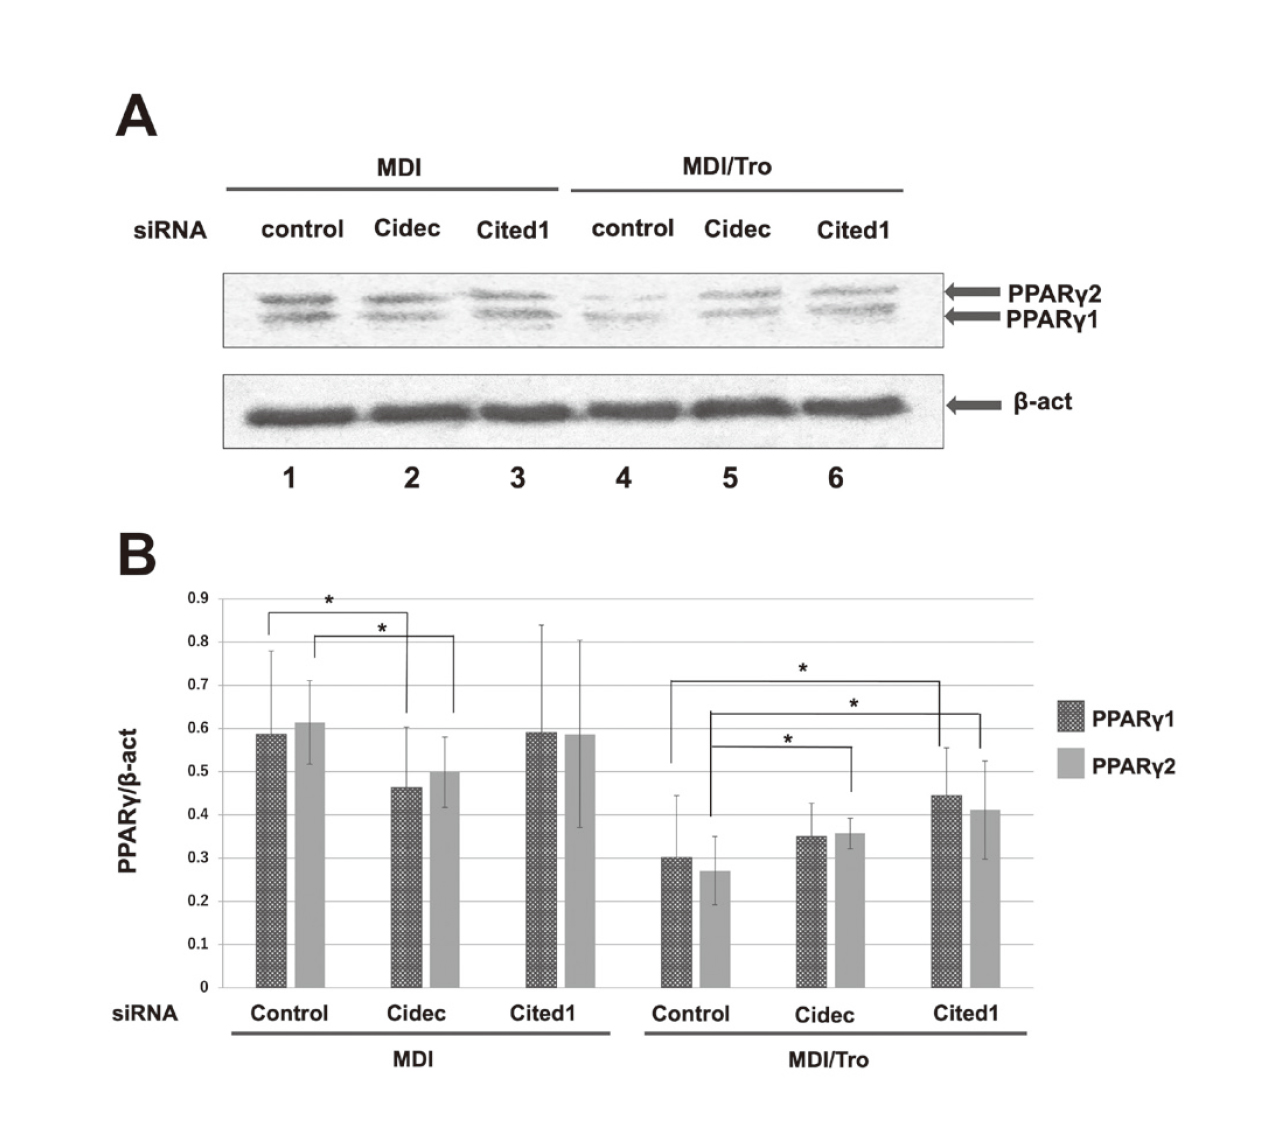
PPARγ Protein Expression in siRNA-Transfected 3T3-L1 Adipocytes
3T3-L1 preadipocytes were transfected with a non-targeting control siRNA (lanes 1 and 4), Cidec siRNA (lanes 2 and 5), or Cited1 siRNA (lanes 3 and 6), then induced to differentiate with MDI in the presence (lanes 1–3) or absence (lanes 4–6) of Tro for up to 6 days. (A) Cell lysates were prepared and immunoblotted with anti-PPARγ antibody. (B) All expression levels were normalized to that of β-actin. Values are presented as means ± S.D. (n = 3). *p < 0.05.
We previously reported that TZDs downregulate PPARγ protein levels in differentiated 3T3-L1 adipocytes. Camp et al. and Perrey et al. indicated that TZDs decrease PPARγ mRNA and protein levels without reducing the expression of genes that are positively regulated by PPARγ.17,18) However, the mechanisms for the reduction in PPARγ expression by TZD treatment have not been reported. In contrast, Garin-Shkolnik et al. demonstrated that FABP4 (aP2) attenuates PPARγ expression and adipogenesis in adipocytes.19) Based on these finding, we speculated that the pronounced induction of FABP4 by TZDs negatively regulates PPARγ expression during the early stages of differentiation.16) However, at 6 days after the differentiation of 3T3-L1 preadipocytes, we found that in addition to FABP4 protein several other metabolism-associated factors are induced. Tro, a PPARγ agonist, enhances insulin sensitivity with lipid accumulation by increasing the number of small adipocytes, and decreasing the number of large adipocytes by inducing apoptosis in adipocytes.20) Apoptotic process genes of Gene Ontology were selected from the upregulated genes in MDI/Tro-induced cells. Microarray analysis of 6-day differentiated cells enabled us to identify Cycs, Cidec, and Cited1 as Tro-induced genes expressed at high levels in 3T3-L1 adipocytes. By co-expressing these Tro-induced genes with PPARγ in 293T cells, we established that their expression was associated with a reduction in PPARγ expression, with Cidec and Cited1 having the most pronounced suppressive effects. Moreover, we found that Cidec siRNA not only reduced the levels of Cidec mRNA but also those of Cited1 mRNA by 39% ± 0.5%, which we suspect could be attributable to the indirect transcriptional regulation of Cited1 expression by Cidec.
Cited1 siRNA transfection was found to rescue the reduced expression of PPARγ protein in MDI/Tro-treated 3T3-L1 adipocytes, albeit without altering lipid accumulation. In contrast, in MDI-treated 3T3-L1 adipocytes, the Cidec siRNA-induced reduction of PPARγ protein expression coincided with a reduction in lipid accumulation (Figs 6 and 7). Given that the expression of PPARγ protein in MDI/Tro-treated 3T3-L1 adipocytes was not associated with lipid accumulation, it appears that Cidec and Cited1 play differing roles in MDI- and MDI/Tro-treated 3T3-L1 adipocytes. It is thus plausible that whereas at the early stage after MDI stimulation, the upregulation of FABP4 reduces PPARγ protein levels, thereafter Cidec or Cited1 may reduce the PPARγ protein expression levels in 3T3-L1 adipocytes treated with MDI/Tro. In this regard, Garin-Shkolnik et al. suggested that the abrogation of FABP4 restores the suppressed expression of PPARγ protein, thereby enhancing lipid accumulation and thus resulting in an increase in insulin sensitivity.19) Based on our findings, we propose that in MDI/Tro-treated 3T3-L1 adipocytes, the upregulated Cidec and Cited1 proteins play roles that differ from those of FABP4.
In MDI/Tro-induced 3T3-L1 adipocytes, Cited1 has been implicated in induction of the browning of white adipocytes,21–24) and it has been established that during 3T3-L1 pre-adipocyte differentiation, TZDs can induce the expression of browning-associated genes. Furthermore, Cidec has been found to be associated with a lipid droplet protein and thermogenesis.25–28) Browning and thermogenesis are metabolic processes that are important for maintaining good health. Cidec and Cited1, which were selected from the apoptotic process term of Gene Ontology in microarray analysis, are representative browning and thermogenesis genes. These genes may inhibit the overexpression of PPARγ protein induced by Tro treatment, thereby decreasing the number of large adipocytes.
Although Tro enhances lipid accumulation accompanied by the induction of certain thermogenic genes associated with the regulation of PPARγ protein levels, resulting in the improvement of insulin sensitivity, its association with certain detrimental effects such as weight gain and edema remain unresolved. It is conceivable that during 3T3-L1 pre-adipocyte differentiation, MDI/Tro-induced factors such as Cidec or Cited1 abrogate these adverse side effects as a consequence of the hyperactivation of PPARγ. Further studies of the interaction of PPARγ and PPARγ ligands may identify key factors that can be used to develop agents that enhance insulin sensitivity with limited side effects.
This work was supported by the Education Research Project of Aomori University.
Conflict of interestThe authors declare no conflict of interest.